2019 International Conference on Applied Mathematics, Modeling, Simulation and Optimization (AMMSO 2019) ISBN: 978-1-60595-631-2
Finite Element Numerical Simulation-Based Fatigue Life Analysis on
High-Temperature Gas-Cooled Reactor
Jian-yong GAO
1, Chen QING
2and Yuxue JIN
3,* 1Suzhou Nuclear Power Research Institute, Guangzhou, 518033, PR China
2
Suzhou Nuclear Power Research Institute, Guangzhou, 518033, PR China
3
School of Reliability and Systems Engineering, Beihang University, 37th, Xueyuan Road, Haidian District, Beijing, 100191, PR China
*Corresponding author
Keywords: High-temperature Gas-cooled reactor, Numerical simulation, Fatigue analysis.
Abstract. The high-temperature gas-cooled reactor ensures the smooth flow of helium in the reactor. At the same time, the high-temperature flowing gas also has a great impact on the equipment. In this paper, through the finite element numerical simulation analysis of the rod part in the equipment, according to the expansion mechanism of fatigue crack in fracture mechanics, combined with the actual material parameters of the inner rod, the residual fatigue life is calculated. It has certain guiding significance for the calculation of residual fatigue life of high temperature gas cooled reactors.
Introduction
As the structural basis for the functions, the high-temperature gas-cooled reactor directly affects its safe running [1,2]. Once an accident occurs, it may cause radioactive pollution and threaten environmental safety [3]. Since the equipment is subjected to a certain external pressure both under the circumstances of normal operation and an accident [4,5], all these loads have a great influence on its life. Therefore, it is necessary to carry out detailed calculation and analysis on the fatigue life of the high temperature gas-cooled reactor [6].
In this paper, based on the finite element numerical simulation of the inner rod part of the reactor, the complex operating conditions of the reactor are simulated. Therefore, the weak points are identified, and the weak links are analyzed. Then based on the simulation output results, which includes the overall simulation results and key part simulation results, and combined with the actual material parameters of the inner rod, the fatigue life is calculated.
Theoretical Analysis on Mechanics
In fracture mechanics theory, the stress intensity factor is usually expressed as
K a (1) Where: —nominal stress; a—crack size; —shape factor (related to crack size, position, etc.). Aiming at fatigue crack propagation, many calculation formulas for crack growth rate have been proposed. Among them, the most widely used in engineering is the Paris formula, and the Paris formula is expressed as
m d
d
a
C K
N (2)
If the initial crack size a0 and the critical crack size ac of the component are known, then the
fatigue life of the component can be obtained by integrating the Paris formula. By formula (2)
max min max min
= - =
K K K a a
(3) Because = maxmin,
Then forum(3)is
=
K a
(4) And the Paris forum is expressed as followed
md d
a
C a
N (5)
Where: —Stress pulse. It can be determined based on the measured stress-time process. Assuming a0 is the initial crack size, obtained by non-destructive detection:ac is the critical crack
size, determined by the broken criteria K KC, which is
2 C c 1 = K a
; N0—the number of cycles
when the crack propagates to a0, and N0 0;Nc—the number of cycles when the crack propagates to
c a .
Integrating forum (5)
c c
0 0 m
d d N a N a a N
C a
(6)The fatigue crack growth life is obtained
1 m/ 2 1 m/ 2
0 c m c c 2 0 2 2 2 1
ln , 2
a a m C N m a m a C (7)
In practical engineering, the component is rarely subjected to constant amplitude stress. On the other hand, in most cases, it is subjected to variable amplitude stress. Under variable amplitude loading, there are interactions between different load cycles, so the load sequence affects the fatigue crack growth life. In general, for the sake of application, the effect of the load sequence is not considered. The Paris formula applies to constant amplitude stress. Under the variable amplitude stress, the formula (7) cannot be directly used. Therefore, the Miner criterion is used to convert the variable amplitude stress into the corresponding equivalent constant amplitude stress, and then the equivalent constant amplitude stress is brought into the equation (7), finally the residual fatigue life of the component is obtained.
Finite Element Numerical Simulation
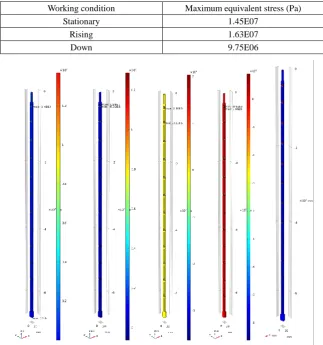
According to the actual working conditions and fatigue life calculation requirements, in the following calculation of the life, the whole process of "stationary-rising-stationary-down-stationary" is recorded as one time, which is also in line with the project. The simulation results of weak area are shown in Table 1
Table 1. Simulation results of weak area.
Working condition Maximum equivalent stress (Pa)
Stationary 1.45E07
Rising 1.63E07
Down 9.75E06
(a)Mises stress (b)Principal stress (c)Second principal stress (d)Third principal stress (e)Stress concentration division
Figure 1. Overall stress field calculation result of inner rod.
[image:3.595.123.470.543.723.2](c)Second principal stress (d)Third principal stress (e)Weak area distribution
Figure 2. Calculation results of stress field in key parts of inner rod.
Calculation of Fatigue Life
Material Parameters of Weak Area
According to the document HS1T107230JDA2002EN001 Assembly Specification on Control Rod and the output of simulation, the material of the inner dangerous part is Incoloy800. The mechanical and fatigue crack propagation parameters of Incoloy 800 were determined by consulting the relevant literature, as shown in Table 2.
Table 2. The mechanical and fatigue crack propagation parameters of Incoloy 800.
Material Density (g/cm3)
Elastic Modulus(GPa)
Poisson's ratio
Fatigue crack growth parameter lgC
Fatigue crack growth parameter m
Incoloy800 7.94 196.5 0.339 -14.5 4
Fatigue Life Calculation Based on Probability Fracture Mechanics
In the evaluation of the residual fatigue life of the structure by the linear elastic fracture mechanics method, the parameters are considered as deterministic quantities. However, due to the influence of subjective and objective factors, there are great uncertainties in these parameters, such as material performance uncertainty, randomness of applied loads, uncertainty in crack shape simplification, and uncertainty in dimensions of cracks caused by non-destructive testing, etc. Therefore, it is necessary to introduce the method of probability and statistics in fracture mechanics.
The method formed by combining fracture mechanics and probability and statistics theory is so called probabilistic fracture mechanics. The residual fatigue life assessment based on probabilistic fracture mechanics is a method to evaluate the residual fatigue life of the structure by considering the random parameters as statistics with a certain statistical distribution.
From section 1, the fatigue crack growth life is
1 m/2 1 m/2
c m 0 c
e
2 2
N a a
m C
(8)
There are six parameters in equation (2.1). Considering these parameters as random variables, the fatigue crack growth life can be written as a function of six random variables, ie
c , , , e, 0, c
N C m a a (9)
1 m/2 1 m/2
c m e 0 c
2
lg lg lg lg lg
2
N C m a a
m C
(10)
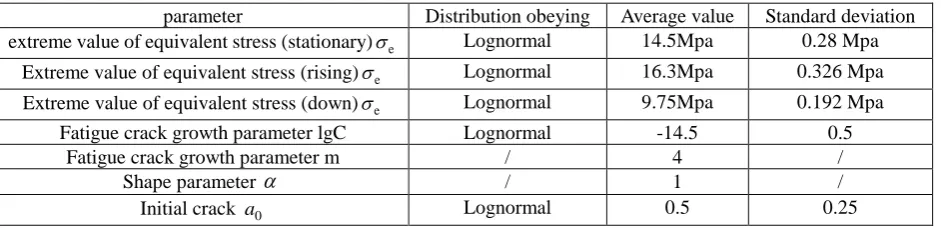
The calculation parameters required are shown in the Table 3. In the calculation of fatigue crack growth, it is generally considered that the equivalent normal amplitude stress efollows a lognormal distribution, and the standard deviation is about 2% of the mean value. According to the experimental data in the literature, the fatigue crack propagation parameters C and m based on the average value, and C obeys a lognormal distribution; in general, because a0=ac ,
1 m/2 1 m/2
0 c
lg a a is approximately equal to 1 lg 0 2
m a
. The Initial cracks a0 is considered to be
0.05 mm to 0.5 mm according to large number of statistical results of non-destructive testing, which also obeys a lognormal distribution. The maximum value of this report is 0.5 mm and the coefficient of variation is 0.5.
Substituting each of the above variables into equation (4.3), it can be seen that the fatigue crack growth life of the member also obeys the lognormal distribution. The average value
c
lgN and standard
c
lgN
deviation of lgNc can be obtained. Given the level of reliability pr,
r
P
u can be
obtained by looking up the table (
r
P
u is the “standard normal offset” associated with reliabilitypr),
the logarithmic extended lifetime at this level of reliability is
c r c
c lg P lg
lgN = N u N (11)
lg c Pr lg c
c=10
N u N
[image:5.595.65.536.445.559.2]N (12)
Table 3. Calculation parameters of fatigue in Inner rod.
parameter Distribution obeying Average value Standard deviation extreme value of equivalent stress (stationary)e Lognormal 14.5Mpa 0.28 Mpa
Extreme value of equivalent stress (rising)e Lognormal 16.3Mpa 0.326 Mpa Extreme value of equivalent stress (down)e Lognormal 9.75Mpa 0.192 Mpa
Fatigue crack growth parameter lgC Lognormal -14.5 0.5
Fatigue crack growth parameter m / 4 /
Shape parameter / 1 /
Initial crack a0 Lognormal 0.5 0.25
Conclusion
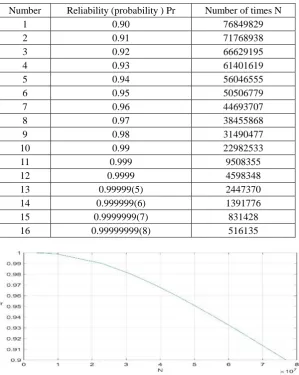
16 groups data of reliability are selected: 0.90, 0.91, 0.92, 0.93, 0.94, 0.95, 0.96, 0.97, 0.98, 0.99, 0.999, 0.9999, 0.99999, 0.999999, 0.9999999, 0.99999999. Calculate the corresponding life for the above reliability, the calculation results are shown in Table 4, and the probability-life curve is shown in Figure 3. Note: "stationary-rising-stationary-down-stationary" is recorded as 1 time.
From data in Table 4, the reliability-life curve of inner rod approximates the expression:
0.148904* ^ 3 0.308314* ^ 20.0193301* 0.999802
Pr X X X
Table 4. Reliability—life calculation results of inner rod.
Number Reliability (probability ) Pr Number of times N
1 0.90 76849829
2 0.91 71768938
3 0.92 66629195
4 0.93 61401619
5 0.94 56046555
6 0.95 50506779
7 0.96 44693707
8 0.97 38455868
9 0.98 31490477
10 0.99 22982533
11 0.999 9508355
12 0.9999 4598348
13 0.99999(5) 2447370
14 0.999999(6) 1391776
15 0.9999999(7) 831428
[image:6.595.147.451.89.464.2]16 0.99999999(8) 516135
Figure 3. Reliability-life curve of inner rod.
Acknowledgement
The research was financially supported by the Major Project of National Science and Technology High-temperature Reactor Demonstration Engineering Reliable Operation Technology Research Project, Operation Reliability Key Equipment Support Sub-project (Grant No. 2018ZX06906012).
Reference
[1]Yang-Ping Zhou, Peng-Fei Hao, Xi-Wen Zhang, Feng He. Numerical investigations of thermal mixing performance of a hot gas mixing structure in high-temperature gas-cooled reactor[J].Nuclear Science and Techniques, 27(2016)142-148.
[2]Zuo Jiaxu, Jing Jianping, Bi Jinsheng, et al. Framework analysis of fluoride salt-cooled high temperature reactor probabilistic safety assessment[J].Nuclear Science and Techniques, 26(2015) 114-119.
[3] Tong, J. Development of Probabilistic Safety Assessment with respect to the first demonstration nuclear power plant of high temperature gas cooled reactor in China[J]. Nuclear Engineering and Design, 251(2012) 385-390.
[5] Frisani, A. YA. Hassan, Computation fluid dynamics analysis of the Reactor Cavity Cooling System for Very High Temperature Gas-Cooled Reactors[J].Annals of Nuclear Energy, 72(2014) 257-267.