Optimized Approach for the Analysis of
Drinking Water Quality
Hariharan S1, Hariprakash R2, Gowtham N3, Rajasekaran N4
Student, Department of EEE, K. S. Rangasamy College of Technology, Tamilnadu, India1
Student, Department of EEE, K. S. Rangasamy College of Technology, Tamilnadu, India2
Student, Department of EEE, K. S. Rangasamy College of Technology, Tamilnadu, India3
Assistant Professor, Department of EEE, K. S. Rangasamy College of Technology, Tamilnadu, India4
ABSTRACT: Now a day’s water pollution is one of the biggest fears for the green globalization. To prevent the water pollution, first we have to estimate the water parameters like pH, turbidity, temperature and TDS as the variations in the values of these parameters point towards the presence of pollutants. At present, water parameters are detected by chemical test or laboratory test, where the testing equipments are stationary and samples are provided to testing equipments. Thus the current water quality monitoring system is a manual system with tedious process and is very time consuming. In order to increase the frequency, the testing equipments can be placed in the water resources and detection of pollution can be made remotely. This paper proposes a Sensor-Based Water Quality Monitoring System which is used for measuring physical and chemical parameters of the water. The parameters such as Temperature, pH, TDS and Turbidity of the water can be measured. The measured values from the sensors can be processed by the core controller. The Raspberry Pi model can be used as a core controller. Finally, the sensor data can be viewed on internet using. The uniqueness of our proposed paper is to obtain the water monitoring system with high frequency, high mobility, and low powered. This system provides a strong base to detect changes in natural systems to provide the basis for their proper management to safeguard public health as well as critical ecosystems.
KEYWORDS: Temperature sensor, TDS Sensor, Conductivity sensor, Water flow sensor, Turbidity, Arduino, IoT.
I. INTRODUCTION
The pollution in water is increasing day by day, and many researchers and scientists are trying to solve the problem by checking and maintaining the quality of water. This paper focuses mainly on the quality checking of water. The aim of the paper is to test the water quality so that it will be n real time to keep human life safe from the polluted water. Analyzing the condition and checking whether the water is favorable for the living beings and plants is the main target. There are different kinds of the available water quality measuring device on the market, ranging from cheap to expensive ones and house to industrial applications. Devices are very costly and hard to understand for the consumer and might be affordable but cannot fulfill the needs of quality checking ineffective and fast ways. And these water testers measure either turbidity or pH, but none of them measures the pH, turbidity, TDS as well as the temperature of the water. Some other water quality testers only measure the pH of water. If all the parameters are available in the device, then that device is not affordable for common people. Since it is not available on the market, this project includes all three required parameters for checking the quality of water in affordable cost. This paper will check the value of pH, Turbidity, TDS and Temperature of the water and determines whether the water is suitable for the normal use.
the quality of water requires much hard work. Most of the things that exist in the earth dissolve in water, and it is very hard to determine the amount of the material mixed in it. For determining the number of materials in water requires much hard work and is time-consuming. It has become necessary with the evolving technology a quick and efficient method determine the quality of water.
II. RELATEDWORKS
Water quality is described as the general composition of water with reference to its chemical, physical and biological properties [1][2]. Water is a limited natural resources and it is very essential for human beings [1][3]. This is because nowadays, human uses water for daily chores such as hydration, washing, cooking and other. Aside from that, water is also a vital substance for most of the human activity such as agriculture, industrial manufacturing, animal rearing, etc. Therefore, it is necessary to maintain the water at high quality so that the water is save for the consumption of human and human activity [4][5][8].
Nowadays, WQM are performed by integrating advance technologies to achieve a larger amount, more precise and accurate data for better data analysis. The technology such as microcontroller system and electrical and electronic sensors are implemented for a better result. Further improvement of WQM systems is done by applying the concept of wireless sensor network (WSN) and Internet of Thing (IoT) to achieve effective result in supporting the capture, analysis and transmission of water quality data [1][6]. Besides the capability of the system to acquire and process data at various distributed spot in a short manner of time is also reducing the manpower require to perform the [7][9] WQM.
Realizing the advantages of integration between microcontroller system and WSN for WQM, this project is motivated to develop a low-cost WQM system with large coverage and user friendly based on Wi-Fi technology. This project is carried out by developing a prototype of water quality monitoring system using WSN technology system and microcontroller system. The scope of the development includes hardware and software. The multi-sensor circuit is designed to collect data. The sensor that is applied in the system is temperature sensor, pH sensor and Total Dissolved Solid (TDS) sensor. The system is able to measure, collect and display the readings of the water quality.
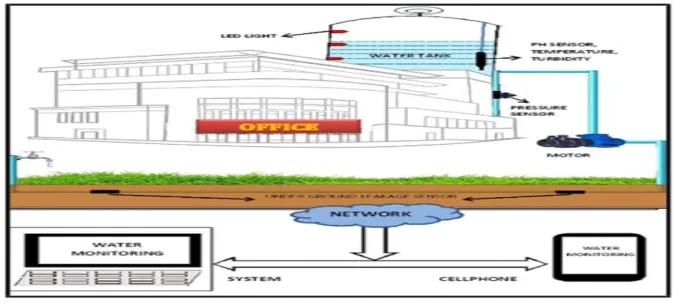
III. SYSTEM ARCHITECTURE
generated by the sensors. A Wi-Fi module is connected to the Arduino device which helps to transfer the data to the cloud over internet. The ultrasonic sensor helps to measure the water level when the water flow reach certain level then the water flow can be stopped automatically by turning the motor off or close the water flow in pipe by the help of Arduino. The water flow sensor measures the quantity of water flow through the pipe in a given time, this data will be sent to the cloud for storage and analysis purposes. The other sensors like temperature, pH and turbidity sensor measures the water quality and helps to determine whether the water is useful for drinking or any agricultural purposes.
IV. EXPERIMENTALRESULTS
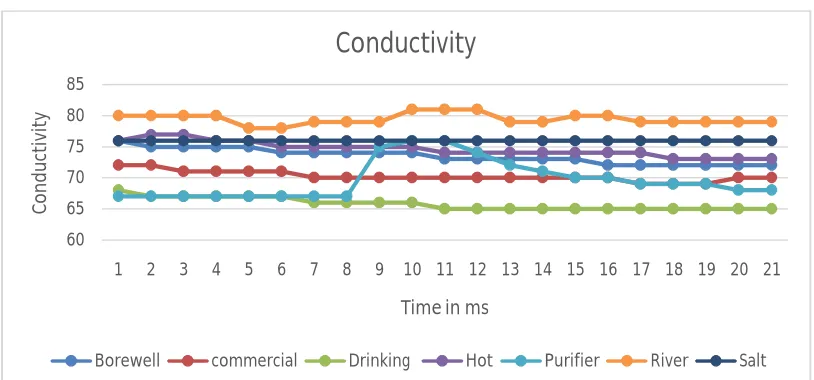
Conductivity Analysis
Fig 2: Conductivity parameter analysis of water samples
Figure 2 shows conductivity parameter analysis for different samples. Electrical conductivity is a measure of the saltiness of the water and is measured in microsiemens per centimeter. WHO specified the conductivity permissible value for irrigating and drinking purpose is 600 µS/cm. In the above figure river water samples have more conductivity in the range of 81 µS/cm which meant that it has more ionic content in the water. The RO water contains low conductivity in the range of 65µS/cm. All samples were tested and the value measured for the specified time interval and it has been used for wide range of applications.
Turbidity Analysis
The figure 3 shows that the turbidity parameter analysis of different water samples. Turbidity is a measure of the degree to which the water loses its transparency due to the presence of suspended particles. The WHO establishes that the turbidity of drinking water should not be more than 5 NTU. The suspended particles absorb heat from the sunlight, making turbidity water become warmer and so reducing the concentration of oxygen in the water. The suspended particles scatter the light, thus decreasing the photosynthetic activity of the plants which contribute to lowering the oxygen concentration even more.
60 65 70 75 80 85
1 2 3 4 5 6 7 8 9 10 11 12 13 14 15 16 17 18 19 20 21
C
o
n
d
u
ct
ivi
ty
Time in ms
Conductivity
Fig 3: Turbidity parameter analysis of water samples
From above figure the river water samples has the maximum range of 10 NTU. So the river water has high solid suspended particle and it I not offered to drink. The mineral water has lower turbidity level in the range of 3 – 4 NTU. As per the BIS, the permissible range of turbidity is 5 NTU. So the river water is likely to be used for drinking purpose.
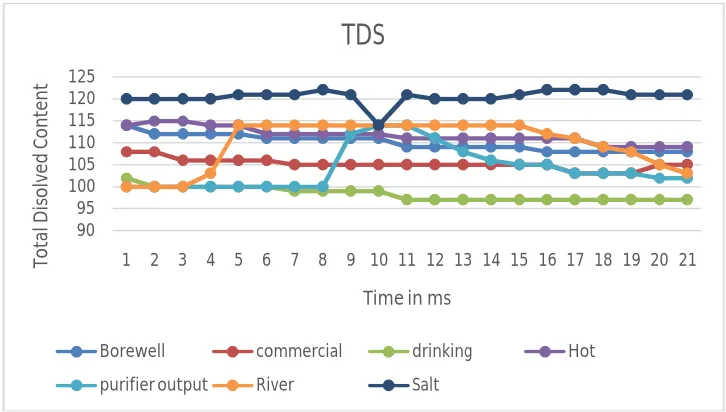
Total dissolved solvent analysis
0 2 4 6 8 10 12
1 2 3 4 5 6 7 8 9 10 11 12 13 14 15 16 17 18 19 20 21 22
Tu
rb
id
it
y
Time in ms
Turbidity
Borewell Commercial Drinking
90 95 100 105 110 115 120 125
1 2 3 4 5 6 7 8 9 10 11 12 13 14 15 16 17 18 19 20 21
To
ta
l D
is
o
lve
d
C
o
n
te
n
t
Time in ms
TDS
Borewell commercial drinking Hot
TDS stands for total dissolved solids and represents the total concentration of dissolved substance in water. TDS is made up of inorganic salts as well as a small amount of organic matter. A high concentration of dissolved solid is usually not a health hazard. As per the BIS TDS must be between 150 to 500. If the TDS value less than 150 it is unacceptable, because of too less minerals. Figure 4 shows that maximum TDS value achieved by salt water in the maximum range of 122 mg/lt. the drinking water contain very less minerals in the range of 97 mg/lt. the drinking water has less minerals and it will health hazard to human.
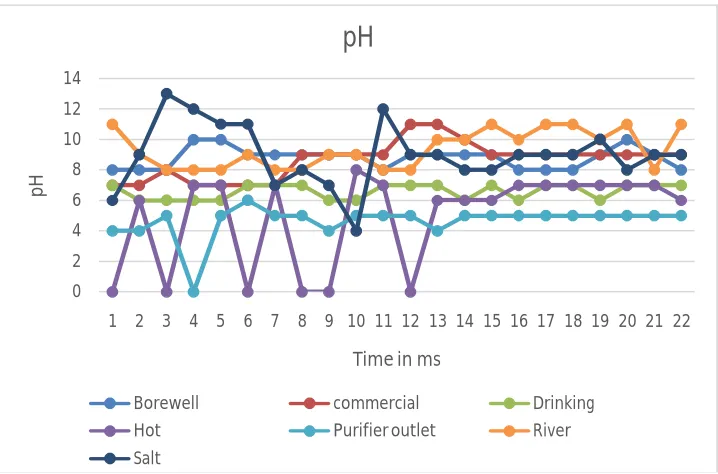
pH measurement analysis
Fig 5: pH value analysis of water samples
The pH value of a water source is a measure of its acidity or alkalinity. The pH level is a measurement of the activity of the hydrogen atom, because the hydrogen activity is a good representation of the acidity of alkalinity of the water. Water with low pH is said to acid. As per BIS , the pH of drinking water should be between 6.5 to 8.5. figure 5 shows that the water purifier outlet water has very low pH value in the range of 4 and below. This water contains more acidity and the mineral water has the pH value in the range of 7 and it is to be neutral. There has been no problem for drinking purposes.
Drinking Water Analysis
The figure 6 shows the mineral water analysis, all the parameter are with in the range except the TDS value. It is less than 150 mg/lt. so the mineral deficiency has been major problem by taking this water continuously.
0 2 4 6 8 10 12 14
1 2 3 4 5 6 7 8 9 10 11 12 13 14 15 16 17 18 19 20 21 22
p
H
Time in ms
pH
Borewell commercial Drinking
Hot Purifier outlet River
Fig 6: Mineral water analysis of water samples
V. CONCLUSION
Temperature, pH, conductivity, total dissolved solids and turbidity in bore well water, mineral water, salt water, RO purifier outlet water, river water and hot water were studied. Temperature values are almost similar value in the range between 40°C to 50°C and it is not bad interms of supporting microbial growth. Average pH is slightly acidic and indicated corrosion problems, especially in the RO purified outlet. Conductivity values of river water I high in the range of 81µS/cm. it has more ionic content and also mineral water has very less ionic content in the range of 65 µS/cm. turbidity values are very less in the mineral water which indicates the less suspended particles. Total dissolved solids value are very less in the mineral water in the range of 97 mg/lt. from this study, it is concluded that mineral water has satisfied the all the standard value except TDS which has less minerals.
VI. FUTURESCOPE
In the future, it is possible to extend this system with several intelligent modules. For example, water pumps can be installed and controlled by monitoring the module to change the water level in a pond, to reduce or raise temperature and pH level. Other types of sensors such as dissolved oxygen, turbidity, conductivity can be attached to our system with a little modification. Moreover, power consumption can be reduced by adopting solar energy to power the Sensor Nodes, especially in tropical areas likes Asian countries.
REFERENCES
[1] K.S. Adu-manu, C. Tapparello, and W. Heinzelman, “Water Quality Monitoring Using Wireless Sensor Networks : Current Trends and Future
Research Directions,” ACM Transactions on Sensor Networks (TOSN), vol. 13, no. 1, 2017, pp. 4.
[2] H. Malik, and A. Szwilski, “Towards Monitoring the Water Quality Using Hierarchal Routing Protocol for Wireless Sensor Networks,” In Procedia Computer Science, vol. 58, 2016, pp. 140–147.
[3] S. Sridharan, “Water Quality Monitoring System Using Zigbee Based Wireless Sensor Network,” International Journal of Engineering & Technology , vol. 3, no. 2, 2014, pp. 51–57.
0 20 40 60 80 100 120
1 2 3 4 5 6 7 8 9 10 11 12 13 14 15 16 17 18 19 20 21
A
ll
P
ar
am
et
er
s
Time in ms
Drinking Water Analysis
[6] X. Wang, L. Ma, and H. Yang, “Online water monitoring system based on ZigBee and GPRS,” Procedia Engineering, vol. 15, 2011, pp. 2680– 2684.
[7] T.I. Salim, H.S. Alam, R.P. Pratama, I. Asfy, F. Anto, and A. Munandar, “Portable and Online Water Quality Monitoring System using Wireless Sensor Network,” In International Conference on Automation, Cognitive Science, Optics, Micro Electro-Mechanical System, and Information Technology, 2017, pp. 34–40.
[8] M.A. Miskam, I.A. Rahim, O. Sidek, M.Q. Omar, and M.Z. Ishak, “Deployment of wireless water-quality monitoring system at titi serong paddy crop field, Malaysia,” In Proceedings - 2013 IEEE 3rd International Conference on System Engineering and Technology, 2013. [9] D.S. Simbeye, and S.F. Yang, “Water quality monitoring and control for aquaculture based on wireless sensor networks,” Journal of Networks,