| GENOMIC SELECTION
Host Genome In
fl
uence on Gut Microbial Composition
and Microbial Prediction of Complex Traits in Pigs
Amelia Camarinha-Silva,*,1Maria Maushammer,*,1Robin Wellmann,* Marius Vital,†Siegfried Preuss,*
and Jörn Bennewitz*,2 *Institute of Animal Science, University of Hohenheim, 70599 Stuttgart, Germany and†Microbial Interactions and Processes Research Group, Helmholtz Centre for Infection Research, 38124 Braunschweig, Germany
ABSTRACTThe aim of the present study was to analyze the interplay between gastrointestinal tract (GIT) microbiota, host genetics, and complex traits in pigs using extended quantitative-genetic methods. The study design consisted of 207 pigs that were housed and slaughtered under standardized conditions, and phenotyped for daily gain, feed intake, and feed conversion rate. The pigs were genotyped with a standard 60 K SNP chip. The GIT microbiota composition was analyzed by 16S rRNA gene amplicon sequencing technology. Eight from 49 investigated bacteria genera showed a significant narrow sense host heritability, ranging from 0.32 to 0.57. Microbial mixed linear models were applied to estimate the microbiota variance for each complex trait. The fraction of phenotypic variance explained by the microbial variance was 0.28, 0.21, and 0.16 for daily gain, feed conversion, and feed intake, respectively. The SNP data and the microbiota composition were used to predict the complex traits using genomic best linear unbiased prediction (G-BLUP) and microbial best linear unbiased prediction (M-BLUP) methods, respectively. The prediction accuracies of G-BLUP were 0.35, 0.23, and 0.20 for daily gain, feed conversion, and feed intake, respectively. The corresponding prediction accuracies of M-BLUP were 0.41, 0.33, and 0.33. Thus, in addition to SNP data, microbiota abundances are an informative source of complex trait predictions. Since the pig is a well-suited animal for modeling the human digestive tract, M-BLUP, in addition to G-BLUP, might be beneficial for predicting human predispositions to some diseases, and, consequently, for preventative and personalized medicine.
KEYWORDSGenPred; shared data resource; complex traits; genomic selection; gut microbial composition; microbial prediction; pig
H
OST–MICROBIOTA interactions have received consid-erable attention in human studies in recent years, and it has been shown repeatedly that host genetics, as well as the environment, affect gut microbiota composition (Sporet al.2011). In order to unravel host genetic effects, the use of a model organism that is kept in a stable environment with minimum environmental variations is needed (Zhao
et al.2013). Kosticet al.(2013) described different model organisms, such as mice, zebrafish, the fruit flyDrosophila, and the bobtail squid, as important sources of information on host–microbiota homeostasis. The pig can be used as a model for human-related research, as the human and porcine
physiology, metabolism, and gastrointestinal tract (GIT) mi-crobiota are similar (Heinritzet al.2013). It has already been used as an animal model for microbiota-associated diseases such asHelicobacter pyloriinfections, necrotizing enterocoli-tis disease, obesity, and diabetes, and to formulate dietary strategies for overcoming obesity and other metabolic syn-dromes (Heinritz et al.2013). Moreover, pigs are not only suitable model organisms for human-related research but also some of the most important livestock species used for meat production worldwide. Breeding is frequently carried out using genome-wide SNP data for the prediction of selec-tion candidate breeding values (Knol et al.2016)—a tech-nique that is recognized as a form of genomic selection (Meuwissenet al.2001). The underlying assumption is that each SNP affects complex traits of interest only marginally, but modeling all SNPs jointly in a prediction equation is at-tributed with remarkably high levels of prediction accu-racy. Genomic prediction is also utilized in plant breeding (Jannink et al. 2010), and has been proposed as a tool for predicting complex genetic predispositions in humans Copyright © 2017 by the Genetics Society of America
doi:https://doi.org/10.1534/genetics.117.200782
Manuscript received February 2, 2017; accepted for publication April 27, 2017; published Early Online May 2, 2017.
Supplemental material is available online atwww.genetics.org/lookup/suppl/doi:10. 1534/genetics.117.200782/-/DC1.
1These authors contributed equally to this work.
(de los Camposet al.2010). Inspired by the success of geno-mic prediction methods, Rosset al.(2013) developed a meta-genomic prediction approach. These authors used human and cattle datasets with massive parallel sequencing data to form metagenomic relationship matrices, which in turn were used to predict complex traits with considerable accuracy. This study clearly highlights the potential to consider alter-native high-dimensional host-related explanatory variables beyond SNP markers for prediction purposes, and, more gen-erally, opportunities to apply quantitative-genetic methods in holistic analyses of data on microbiota, host genetics, and complex traits.
Currently, there is a lack of research in pigs regarding the genetic influences on gut microbial community, and the effect of this community on complex host traits. Besides studies on the influence of nutrition and medication on the microbiota, one study has approached the question of how the early-life pig gut microbiota impacts host phenotypes (Mach et al.
2015).
In this study, standard quantitative-genetic methods were extended and applied to analyze the interrelationship be-tween pig GIT microbiota compositions, complex traits, and pig genomes. The specific aims were (i) to characterize GIT microbiota for pigs of a mature age, (ii) to analyze the effects of host genetics on GIT microbial composition, (iii) to investigate the role of GIT microbial composition on key host complex traits, and (iv) to evaluate genomic as well as microbial predictions of complex host traits.
Materials and Methods
Sample collection
The animal experiments were performed in accordance with German Animal Welfare legislation. All procedures regarding animal handling and treatment were approved by the Uni-versity of Hohenheim Committee of Animal Welfare under authorization number S411/14TZ. The pigs belonged to the Piétrain breed. This is an important sire line breed (Stratzet al.
2014) for which genomic selection is practiced (Wellmann
et al.2013). Housing, slaughtering, and the recording of phe-notypes of the pigs was performed under standardized condi-tions at one experimental farm. Performance testing started with a weight of 30 kg and ended with a weight of 105 kg. Animal feed intake (FI) and daily gain (DG) values were recorded during performance testing. The feed conversion (FC) value was calculated as a ratio of the consumed feed and weight gain occurring during performance testing. See Supplemental Material,Table S1for descriptive statistics of these traits. By reaching 105 kg, the pigs were slaughtered with an average slaughter age of 188 (614) days, and an average performance testing duration of 100 (611) days. In total, colon and blood samples from 207 Piétrain sows were collected on 14 slaughter days. Blood samples were taken directly during the slaughtering and stored on ice. After opening of the abdomen, colon samples were collected from
the mid-colon and also stored on ice. For long-term storage, blood samples were kept at220°and colon samples at280°.
Illumina amplicon sequencing
Colon digesta samples were thawed on ice and homogenized, and 250 mg of each sample was used to extract DNA using the FastDNA SPIN Kit for Soil (MP Biomedicals, Solon, OH) according to the manufacturer’s instructions. PCR targeting of the V1-2 region of the 16S rRNA gene was carried out as described in Camarinha-Silvaet al.(2014). Based on a pre-vious work of our group (Burbachet al.2016), this 16S region and DNA extraction method was giving the best coverage of the microbial community. Amplicons were purified and nor-malized using a SequalPrep Normalization Kit (Invitrogen, Carlsbad, CA), and were pooled and sequenced with 250 bp paired-end sequencing chemistry applied on an Illumina MiSeq platform.
Bioinformatic processing of sequences was done according to Camarinha-Silva et al. (2014) with some modifications. Raw reads were assembled (Cole et al. 2014) and subse-quently aligned using MOTHUR (gotoh algorithm with the SILVA reference database) prior to preclustering of the se-quences with two mismatches (diffs = 2). Low abundance operational taxonomic units (OTUs), if present in,5 sam-ples in relative abundances,0.01%, were removed. Finally, 40,37961149 sequences were obtained per sample, com-prising a total of 2714 OTUs that were taxonomically assigned using the naïve Bayesian RDP classifier (Wang
et al. 2007). The OTUs were then evaluated against the RDP database using Seqmatch function, which belongs to the RDP database. Note that no differences were observed in the microbiota regarding the day of DNA extraction, which was performed on 5 consecutive days by the same person.
Genotyping
In total, 207 German Piétrain sows were genotyped using an Illumina PorcineSNP60 BeadChip (Ramos et al. 2009). Genotypes from individuals werefiltered with respect to call rates (removal of SNPs with a call rate of,95%), minor allele frequencies (exclusion of SNP with a minor allele frequency of,5%), significant deviations from Hardy-Weinberg equi-librium (P,0.0001), and SNPs on the Y-chromosome were removed. The call rate across all animals was$0.994. After quality control measures were performed, 51,970 SNPs remained for further analysis.
Statistical analysis
Microbial community:A multivariate dataset comprising the relative abundance of each phylotype across each sample was analyzed using v.6.1.6, PRIMER-E (Plymouth Marine Laboratory, UK; Clarke and Warwick 2001). The Bray-Curtis coefficient (Bray and Curtis 1957) was used to create a sample-similarity matrix, and microbial community structures were explored via nonmetric multidimensional scaling (MDS) (Clarke and Warwick 2001). Statistical comparisons between a priori
using analysis of similarity (ANOSIM) based on 999 permu-tations, and were considered significantly different at a
P-value of,0.05. Species responsible for observed dif-ferences were identified based on similarity percentages (SIMPER) (Clarke and Warwick 2001). Tax4fun (Aßhauer
et al.2015) was used to predict the functional capabilities of microbial communities detected in colons based on the 16S rRNA sequencing data.
Genetic parameters of bacterial genera:Genetic parameters were estimated for bacterial genera rather than for OTUs, because the latter would result in numerous statistical anal-ysis, and, thus, in a strong multiple testing problem. An analysis of variance was performed by fitting a univariate genomic mixed linear model to test for significant effects. The age and weight measured at the test station and the slaughter weight were included asfixed covariables in the model, and the slaughter day (SD) was considered as a random effect in the model. The observation vector included the relative abun-dance of one genus. Only genera with abunabun-dance values exceeding 0.1% were considered. By backward elimination, nonsignificant effects (significance level for the elimination of a = 0.05) were removed from the model. An univariate analysis was performed to estimate the heritability of each genus. Statistical analyses were performed using the ASReml package available through R (Butleret al.2009). The mixed linear model is written as follows:
y¼XbbþZSDSDþaþe; (1)
whereyis the observation vector, which includes the abun-dance of one genus,bis the vector offixed effects (described above),SDis the vector with random slaughter day effects with variances2
SD;ais a vector with random animal genetic
effects, Xb andZSD are the corresponding design matrices,
andeis the residual term with residual variances2
e:Note that
a random pen effect as well as a random maternal effect were not significant, and thus were not included in this model. The distribution of the random animal effect is aNð0;Gs2
AÞ, withGbeing the genomic relationship
ma-trix, and s2
A being the additive genetic variance. The G
matrix was estimated using SNP genotypes following VanRaden (2008) as
G¼ðZP22QÞðZ22QÞT
m2pmð12pmÞ;
whereZis the gene content matrix with entries 0, 1, or 2 for each SNP and each animal, and matrixQcontains the fre-quency pm of each SNP m: Narrow-sense heritability was
estimated as h2¼s2
A=s2P; with s2P¼s2SDþs2Aþs2e: The
p-values of the heritability estimates were calculated by con-ducting a likelihood-ratio test on random animal effects. The null-hypothesis, that the variance of the random effect is 0, was rejected if twice the difference in the log-likelihoods of the full model, and the reduced model without the random
effect was larger than the 0.95-quantile of ax2–distribution
with 1 d.f. We chose a significance level ofP-value = 0.05. A total of 49 genera was analyzed, which resulted in a multiple testing problem. In order to judge how many false positives were among the significant results, we applied the false dis-covery rate (FDR) technique. We calculated for each test an FDRq-value using the software QVALUE (Storey and Tibshirani 2003). The FDR q-value of the significant genera with the lowest test statistic (P-value 0.05) provided an estimate of the proportion of false positives among the significant out-comes. Note that model (1) is a mixed linear model, which assumes normality of the data. The relative abundance of the genera were, in general, not normally distributed, and some-times peaked at zero. However, due to the small data set we did not apply generalized linear mixed models.
Genetic and microbial parameters of host traits: First, explanatory variables for host traits FC, DG and FI were estimated via backward elimination, using ages and weights measured upon test station arrival and slaughter weights as fixed covariables, and SD and pen as random effects. Non-significant effects ofa = 0.05 were excluded. To estimate genetic variance components and narrow sense heritabilities of the host traits, the following model was applied
y¼XbbþZSDSDþZpenpenþaþe; (2)
where y is a vector of observations (FC, DG, or FI), bis a vector offixed effects (i.e., for FC and FI weights measured upon test station arrival, and for DG slaughter weights), and SD andpen are vectors of random slaughter day, and pen effects, respectively, with variance componentss2
SDands2pen: Xb;ZSD;Zpenare corresponding design matrices, ande
de-notes the residual term. The distribution of the random ani-mal effect a is the same as described in model (1). The heritability was estimated in the same manner as shown in model (1) for the bacteria genera. TheP-value of the additive genetic variance was calculated by performing a likelihood ratio test of the animals’random effects, as described for the random effect in model (1).
The microbial variance component was estimated by ap-plying the following univariate microbial mixed linear model (fitted in ASReml R):
y¼XbbþZSDSDþZpenpenþmþe; (3)
where the model parameters are as described in model (2) except vector m; which contains the random effect of the animal microbiota for each individual withmNð0;Ms2
mÞ;
where s2
m is the microbial variance. The microbial
rela-tionship matrix M was calculated as follows: we have M¼1=NXXT;with matrixX(dimension n3Nwhere nis the number of animals andNis the number of OTUs), con-structed from matrixP(dimensionnxN). The elementsPik
Xik¼
logPik2logP∘k
sdðlogP∘kÞ
Thus, the off-diagonals in M are calculated as
Mij¼1=N
PN
k¼1XikXjk;and the diagonals as
Mii¼ 1
N
XN
k¼1
Xik2 ¼1 N
XN
k¼1
ðlogPik2logP∘kÞ2
varðlogP∘kÞ :
Note, that it might happen that the diagonals are.1. This is the case if
logPik2logP∘k.sdðlogP∘kÞ;
i.e.,logPik,logP∘k2sdðlogP∘kÞ or logPik.logP∘kþsdðlogP∘kÞ;
which means that the abundances of the OTUs in animali
deviate strongly from the average values, e.g., if OTUs are missing in the animal that are present in most other animals, and if OTUs are present that are rare in other animals. Note also that the microbial relationships are affected by some errors remaining in the OTU data. More research is needed regarding the effect of data screening on the precision of the microbial relationship estimation.
The fraction of the phenotypic variance explained by the microbial variance was calculated as m2¼s2
m=s2P; where s2
P ¼s2mþs2SDþs2penþs2e is the phenotypic variance. This
fraction was termed microbiability by Diffordet al.(2016). TheP-value of the microbial variance was calculated by per-forming a likelihood ratio test of the animals’random micro-biota effects, as described for the random animal effect in model (1).
Genomic and microbial prediction:To predict host traits FC, DG, and FI using genomic and microbiota data, G-BLUP and
M-BLUP models were applied, respectively. For the G-BLUP predictions (VanRaden 2008), model (2) was applied with previously estimated variance components. In a similar vein, for the M-BLUP predictions, model (3) was applied. For both types of predictions, a repeated cross validation was per-formed with 10,000 iterations, where 80% of the individuals were sampled randomly without replacement to train the prediction model (reference population). The pig trait phe-notypes (FC, DG, and FI) were predicted from the remaining 20% of the pigs based on the results of the reference popu-lation analysis (validation popupopu-lation). The accuracy of a pre-diction was defined as the correlation between predicted and observed trait phenotypes in the validation population. The mean correlation was calculated as the mean of 10,000 cor-relation estimates. Confidence intervals of correlations were estimated as 2.5 and 97.5% quantiles of the 10,000 ordered correlation estimates.
Effects of single OTUs on complex host traits: To identify the drivers of prediction accuracy levels, the marginal effects of OTUs on phenotypic traits (i.e., single OTU effects not captured by the remaining OTUs) were estimated from the solutions of the M-BLUP model. To do this, an adapted ver-sion of the back solving method proposed by Strandén and Garrick (2009) was used, which is described in the supple-mentary information (File S1).
Figure 1 Nonmetric multidimensional scaling (nMDS) plot illustrating similarities in the global bacterial community structure of pig colon digesta. The pigs are colonized with higher abundances of Firmicutes ( ) and Bac-teroidetes ( ). While a two-dimensional (2D) stress value of 0.2 denotes some stress on the plot, this is considered acceptable since 207 samples are ordinated together.
Data availability
The authors state that all data necessary for confirming the conclusions presented in the article are fully represented within the tables and figures. Sequences are available at the European Nucleotide Archive (ENA) under accession number PRJEB18070 (http://www.ebi.ac.uk/ena/data/view/ PRJEB18070).File S2andFile S3contain genotypes and phe-notypes for each individual, respectively.File S4contains rela-tive abundances at OTU level.
Results
Microbial community characterization and heritability of gut microbiota compositions
The main phyla that account for higher abundances were found to be Firmicutes (54%), Bacteroidetes (42%), Proteo-bacteria (2%), and Spirochaetes (1%). The most abundant families found in colons were Ruminococcaceae (24%), Pre-votellaceae (21%), Porphyromonadaceae (8%), Clostridia-ceae 1 (6%), RikenellaClostridia-ceae (6%), and LachnospiraClostridia-ceae (5%), with all other families found to be present at average levels of ,5%. The microbial community harboring the different pigs showed a similarity of 35% between animals. Overall, the predicted KEGG pathways of higher abundance were found to be related to pathways associated with carbohydrate metabolism, such as starch and sucrose pyruvate, fructose and mannose metabolism; amino acid metabolism; environ-mental information processing such as membrane transport and signal transduction; genetic information processing such as replication and repair; and translation (Figure S1).
In Figure 1, a nonmetric multidimensional scaling plot is provided to illustrate similarities in the global bacterial com-munity structure of pig colon digesta. The stress value asso-ciated with this plot measures the difficulty involved in compressing the samples relationship into two dimensions. It was 0.22, indicating some stress, but we consider this as acceptable, because larger data sets (as in our case) general result in larger stress values. A significant difference was observed between two groups of animals in this plot: one colonized at higher levels with Firmicutes (F), and another col-onized with Bacteroidetes (B) (R = 0.339,P-value = 0.001). The groups showed an average dissimilarity value of 68%,
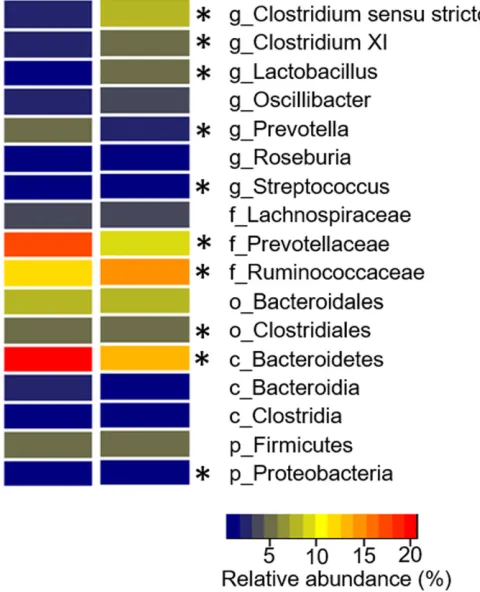
where the average similarity level between all samples in group B was found to be 33%, and that for group F was 38%. Microorganisms contributing to this separation belonged to the genera Clostridium sensu stricto (B = 20.7%, F = 12.8%),
Lactobacillus(B = 1.3%,F = 5.2%),Prevotella(B = 5.3%,
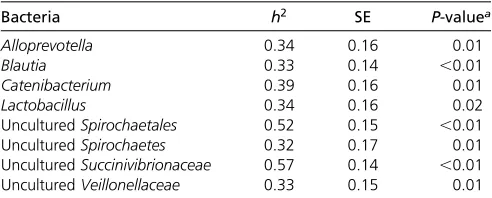
F = 2.7%), andClostridium XI(B = 1.9%,F = 5.8%) (Fig-ure 2). Additional groups of microorganisms presenting signif-icant differences between both groups are shown in Figure 2. The reasons for the separation into these two groups could not be identified and might also be due to different conditions at birth and weaning period, which were unknown to us. Despite the different colon colonization patterns found, no effect of the Firmicutes/Bacteroidetes ratio was observed for DG, FC, or FI (Figure S2). Eight genera generated significant heritability esti-mates (P-value , 0.05), which are shown in Table 1. The FDR of these significant results was,0.11. Heritability estimates of all 49 bacterial genera are shown inTable S2.
Heritability and microbiability of host traits and prediction results
The heritability and microbiability of the DG, FC, and FI traits are shown in Table 2. The heritability estimates are likely slightly underestimated, due to the use of SNP chip data in-stead of pedigree data. However, they are within a typical range for complex pig traits measured under standardized conditions. The heritability and microbiability estimates were significant with the exception of the heritabilities of FC and FI. For these traits, the microbiability estimates were higher than the heritability estimates. The microbial relationship matrix M, and genomic relationship matrix G, underlying these calculations are shown as heatmaps inFigure S3and Figure S4, respectively. The mean of the diagonal values ofG was 0.99, and the values ranged from 0.85 to 1.19. The mean of the diagonal values of Mwas 0.995, and the values ranged from 0.66 to 1.97.
The results of the genomic and microbial predictions are shown in Table 3. The microbial prediction generated an accuracy of 0.41 for DG, and 0.33 for FC and FI. These pre-diction accuracies were higher than those obtained from ge-nomic predictions. In addition, confidence intervals showed that the accuracies were significantly.0 (as was twice the case for genomic predictions).
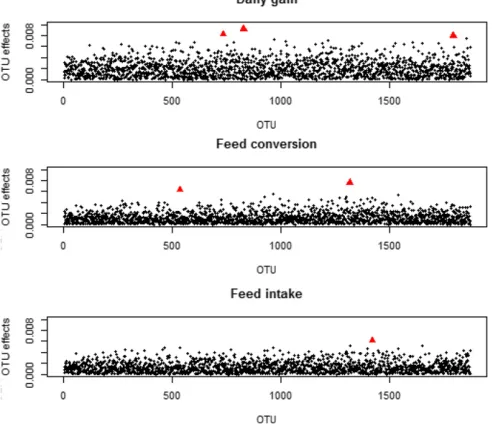
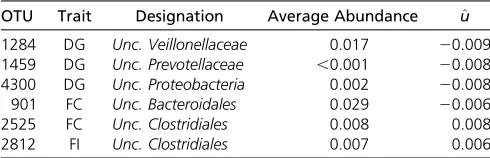
A plot of marginal OTU effects is shown in Figure 3. Some outlier effects were detected (Table 4), but none of the mar-ginal OTU effects showed substantial effects. For DG, the outliers were assigned to uncultured Veillonellaceae, uncul-tured Prevotellaceae and uncultured Proteobacteria. For FC two OTUs with outlier effects were detected, which were Table 1 Estimated heritability ðh2Þand P-value for the relative
abundances of bacterial genera
Bacteria h2 SE P-valuea
Alloprevotella 0.34 0.16 0.01
Blautia 0.33 0.14 ,0.01
Catenibacterium 0.39 0.16 0.01
Lactobacillus 0.34 0.16 0.02
UnculturedSpirochaetales 0.52 0.15 ,0.01
UnculturedSpirochaetes 0.32 0.17 0.01
UnculturedSuccinivibrionaceae 0.57 0.14 ,0.01
UnculturedVeillonellaceae 0.33 0.15 0.01
aAllp-values showed a FDR,0.12.
Table 2 Estimated microbiabilityðm2Þand heritabilityðh2Þwith SE andP-values for DG, FC, and feed intake
Trait m2 SE P-value h2 SE P-value
DG 0.28 0.13 0.01 0.42 0.14 ,0.01
FC 0.21 0.14 0.01 0.19 0.13 0.08
FI 0.16 0.10 0.03 0.11 0.11 0.22
m2¼s2
assigned to unculturedBacteroidalesand uncultured Clostri-diales. One outlier of OTU effects was found for FI, and was assigned to unculturedClostridiales.
Discussion
In this study, we analyzed the microbial composition of pig colon samples. The general pattern of microbiota composition is in agreement with reports on colon (Looftet al.2014; Kim and Isaacson 2015). No interrelationships were found be-tween the Firmicutes-Bacteroidetes ratio and DG, FC, or FI, as previously shown by Machet al.(2015). In former studies conducted in mice and humans, this ratio was considered as an important marker for obesity (Ley et al. 2005, 2006; Turnbaughet al.2006). However, other studies showed con-tradictory results, or even no evidence of a possible effect in human obesity (Duncan et al.2008; Schwiertz et al.2010; Jumpertzet al.2011).
The host genetic variance on the GIT microbiota compo-sition was substantial for some bacterial genera as denoted by the heritability estimates (Table 1). This result is in agree-ment with earlier findings of Estellè et al. (2014) and O’Connor et al. (2014), who reported similar heritabilities for Blautia and Lactobacillus in a French Large White pig population, and in a segregated mouse population, respec-tively. The underlying mechanism of this host genetic deter-mination remains largely unknown thus far. In general, host genetics can influence microbiota compositions through dif-ferences in immunoglobulin and antibacterial molecules se-creted into gut lumen (Wen et al.2008; Vijay-Kumaret al.
2010; Shulzhenkoet al.2011), owing to differences in mu-cosal gut structures (Sommer et al.2014; Wlodarskaet al.
2014) and bile acid metabolism (Ryanet al.2014). Genome-wide association studies (GWAS) may help identify host genes affecting microbiota compositions, and, thus, derive and substantiate novel hypotheses on the genetic mechanism underlying the heritability of microbiota compositions. How-ever, this involves the use of large datasets, and was therefore not possible in this study.
Microbiability asfirst defined by Diffordet al.(2016) al-lows for a holistic view of the influence of microbiota on host traits. For all three investigated traits, microbiability levels were found to be significant, and, for FC and FI, microbiability estimates were higher than the heritability estimates (Table 3). This points to a strong effect of GIT microbiota composi-tions on these traits. As microbiota are partly under the control of host genes, from an animal breeder’s perspective they can be
viewed as host traits. This highlights the possibility of breeding for optimized microbiota to indirectly improve complex host traits. Indeed, from the heritabilities shown in Table 1, selec-tion responses can be expected for at least eight (from a total of 49) bacterial genera. This targeted breeding strategy might be especially beneficial for important and so-called hard-to-measure traits, for which precise data collection is restricted to few individuals. Examples include the utilization of certain nutrients in monogastric animals (Beck et al. 2016), and greenhouse gas emissions in ruminants (Hayes et al. 2013; Roeheet al.2016).
The microbial prediction method M-BLUP is closely related to the well-known G-BLUP model, which is widely used in animal breeding. The key difference is that relationships be-tween individuals are modeled based on relative microbiota abundances at the OTU level, for which calculations are straightforward. The M-BLUP predictions outperformed the G-BLUP predictions in terms of prediction accuracy levels (Table 3). This further underscored the importance of micro-biota compositions for trait variability. Thus, it seems that, in addition to SNP data, microbiota abundances are an informa-tive source of complex trait prediction data for pigs, which again may be of special interest for hard-to-measure traits. To identify drivers of prediction accuracy levels, we estimate the marginal effects of a single OTU. Since only few outliers were detected (Table 4), it can be tentatively concluded that many of the OTUs explain a small fraction of the trait variability and that such traits, like DG, FC, and FI, are not only polygenic in nature (Wellmannet al.2013), but also highly polymicrobial determined in this pig population. However, this must be in-vestigated further because this putative polymicrobial trait determination might, at least in part, also be attributable to M-BLUP model assumptions.
Table 3 Accuracy of microbialðrmÞand genomic predictionsðrgÞof DG, FC, and FI, with C.I.
Trait
Microbial Prediction Genomic Prediction
rm 97.5% CI rg 97.5% CI
DG 0.41 0.18:0.62 0.35 0.08:0.58
FC 0.33 0.07:0.54 0.23 20.04:0.48
FI 0.33 0.15:0.51 0.20 20.08:0.46
One limit of the microbial prediction model pertains to the fact that the GIT microbial composition for pigs is itself not constant, but changes from birth to adulthood (Kim et al.
2011; Pajarillo et al. 2014; Mach et al. 2015), and is, of course, affected by environmental conditions. In the current study, these effects were minimized by housing pigs under standardized conditions, and by collecting microbiota data on pigs of the same age, which may have additionally con-tributed to the high level of microbial prediction accuracy achieved. However, it remains to be determined whether GIT microbial compositions at a juvenile stage can be used as predictors of complex host traits measured at a mature age. Further, it is likely that microbial compositions collected from different locations of the GIT, or from feces, will show various complex trait predictive capacities.
The two microbiota pig breeding strategies described above (i.e., breeding for an optimized microbiome and apply-ing microbial prediction) define the microbiota composition differently. For the former, it is treated as a quantitative host trait, whereas, for the latter, it is used as an explanatory vari-able for prediction purposes. Detailed investigations show that not all microbiota genera are heritable host traits, and not all microbiota OTUs are equally important for predictions (Figure 3). Hence, a comparatively detailed analysis of these two com-ponents is desirable, but larger datasets must be used. In ad-dition to GWAS of microbiota compositions and complex host traits, this interplay may be analyzed through structural equa-tion models as introduced to thefield of livestock genetics by Gianola and Sorensen (2004). In a quantitative genetic set-ting, structural equation models allow for the separation of direct and indirect genetic effects shaping genetic relation-ships among traits. Direct genetic effects result from linkage disequilibrium between genes affecting traits or from pleiotro-pic effects. However, when a causal relationship between two traits exists, genes directly affecting only one trait may also affect the second trait indirectly via the causal relationship between the traits. Methods for identifying causal structures (Valente et al. 2010) would help simultaneously identify which microbiota bacteria present host genetic variance and the impact of these bacteria on complex host trait variations.
This study was conducted using pig samples. Since the pig is an animal well-suited for modeling the human digestive tract, our results may have implications for predicting human predisposition to disease, and consequently for preventative
and personalized medicine. For genetically determined traits such as type-2 diabetes, G-BLUP has already been proven to be useful (de los Campos et al.2013). This study extends the scope of predictions toward using microbiota data, which might be of special interest for traits where it is known that the microbiome plays an important role,e.g., metabolic dis-eases and obesity (Karlsson et al. 2013; Le Chatelieret al.
2013). Applications of M-BLUP with appropriate microbiota data may help quantify the risks of suffering from such dis-eases, and may further the development of personalized pre-ventative strategies.
Methods that combine highly dimensional and correlated predictors (G-BLUP and M-BLUP) with cumulative prediction power will have to be developed in future studies. For this purpose, the present data set is too small.
Acknowledgments
We thank Dr. Jörg Heinkel and the animal care staff at the experimental farm of the Landesanstalt für Schweinezucht in Boxberg, Germany, for assisting with animal sampling procedures. The authors declare no conflicts of interest.
Literature Cited
Aßhauer, K. P., B. Wemheuer, R. Daniel, and P. Meinicke, 2015 Tax4Fun: predicting functional profiles from metage-nomic 16S rRNA data. Bioinformatics 31: 2882–2884. Beck, P., H. P. Piepho, M. Rodehutscord, and J. Bennewitz,
2016 Inferring relationships between Phosphorus utilization, feed per gain, and bodyweight gain in an F2 cross of Japanese quail using recursive models. Poult. Sci. 95: 764–773.
Bray, J. R., and J. T. Curtis, 1957 An ordination of the upland forest communities of Southern Wisconsin. Ecol. Monogr. 27: 325–349.
Burbach, K., J. Seifert, D. H. Pieper, and A. Camarinha-Silva, 2016 Evaluation of DNA extraction kits and phylogenetic diversity of the porcine gastrointestinal tract based on Illumina sequencing of two hypervariable regions. MicrobiologyOpen 5: 70–82.
Butler, D., B. R. Cullis, A. R. Gilmour, and B. J. Gogel, 2009 ASREML-R,
Reference Manual Version 3. Queensland Department of Primary Industries and Fisheries, Brisbane.
Camarinha-Silva, A., R. Jáuregui, D. Chaves-Moreno, A. P. Oxley, F. Schaumburget al., 2014 Comparing the anterior nare bacte-rial community of two discrete human populations using Illu-mina amplicon sequencing. Environ. Microbiol. 16: 2939–2952. Clarke, K. R., and R. M. Warwick, 2001 Change in Marine Com-munities: An Approach to Statistical Analysis and Interpretation, Ed. 1. E Ltd, Plymouth, UK.
Cole, J. R., Q. Wang, J. A. Fish, B. Chai, D. M. McGarrellet al., 2014 Ribosomal database project: data and tools for high throughput rRNA analysis. Nucleic Acids Res. 42: D633–D642. de los Campos, G., D. Gianola, and D. B. Allison, 2010 Predicting genetic predisposition in humans: the promise of whole-genome markers. Nat. Rev. Genet. 11: 880–886.
de los Campos, G., A. L. Vazquez, R. Fernando, Y. C. Klimentidis, and D. Sorensen, 2013 Prediction of complex human traits using the genomic best linear unbiased predictor. PLoS Genet. 9: e1003608.
Difford, G. F., J. Lassen, and P. Løvendahl, 2016 Genes and mi-crobes, the next step in dairy cattle breeding. In Proceedings, EAAP—67th Annual Meeting, Belfast.
Table 4 Outliers of marginal OTU effect estimates (u^) with designations and average abundances for DG, FC, and FI
OTU Trait Designation Average Abundance ^u
Duncan, S. H., G. E. Lobley, G. Holtrop, J. Ince, A. M. Johnstone
et al., 2008 Human colonic microbiota associated with diet, obesity and weight loss. Int. J. Obes. 32: 1720–1724.
Estellè, J., N. Mach, Y. Ramayo-Caldas, F. Levenz, G. Lemonnier
et al., 2014 The influence of host’s genetics on the gut micro-biota composition in pigs and its links with immunity traits. In Proceedings, 10th World Congress of Genetics Applied to Live-stock Production, Vancouver.
Gianola, D., and D. Sorensen, 2004 Quantitative genetic models for describing simultaneous and recursive relationships between phenotypes. Genetics 167: 1407–1424.
Hayes, B. J., H. A. Lewin, and M. E. Goddard, 2013 The future of livestock breeding: genomic selection for efficiency, reduced emissions intensity, and adaptation. Trends Genet. 29: 206–214. Heinritz, S. N., R. Mosenthin, and E. Weiss, 2013 Use of pigs as a potential model for research into dietary modulation of the hu-man gut microbiota. Nutr. Res. Rev. 26: 191–209.
Jannink, J. L., A. J. Lorenz, and H. Iwata, 2010 Genomic selection in plant breeding: from theory to practice. Brief. Funct. Geno-mics 9: 166–177.
Jumpertz, R., D. S. Le, P. J. Turnbaugh, C. Trinidad, C. Bogardus
et al., 2011 Energy-balance studies reveal associations be-tween gut microbes, caloric load, and nutrient absorption in humans. Am. J. Clin. Nutr. 94: 58–65.
Karlsson, F. H., V. Tremaroli, I. Nookaew, G. Bergstrom, C. J. Behre
et al., 2013 Gut metagenome in European women with normal, impaired and diabetic glucose control. Nature 498: 99–103. Kim, H. B., and R. E. Isaacson, 2015 The pig gut microbial diversity:
Understanding the pig gut microbial ecology through the next gen-eration high throughput sequencing. Vet. Microbiol. 177: 242–251. Kim, H. B., K. Borewicz, B. A. White, R. S. Singer, S. Sreevatsanet al., 2011 Longitudinal investigation of the age-related bacterial diver-sity in the feces of commercial pigs. Vet. Microbiol. 153: 124–133. Knol, E. F., B. Nielsen, and P. W. Knap, 2016 Genomic selection in
commercial pig breeding. Anim. Front. 6: 15.
Kostic, A. D., M. R. Howitt, and W. S. Garrett, 2013 Exploring host –microbiota interactions in animal models and humans. Genes Dev. 27: 701–718.
Le Chatelier, E., T. Nielsen, J. Qin, E. Prifti, F. Hildebrand et al., 2013 Richness of human gut microbiome correlates with met-abolic markers. Nature 500: 541–546.
Ley, R. E., F. Backhed, P. Turnbaugh, C. A. Lozupone, R. D. Knight
et al., 2005 Obesity alters gut microbial ecology. Proc. Natl. Acad. Sci. USA 102: 11070–11075.
Ley, R. E., P. J. Tunrbaugh, S. Klein, and J. I. Gordon, 2006 Mi-crobial Ecology: Human gut microbes associated with obesity. Nat 444: 1022–1023.
Looft, T., H. K. Allen, B. L. Cantarel, U. Y. Levine, D. O. Bayleset al., 2014 Bacteria, phages and pigs: the effects of in-feed antibiotics on the microbiome at different gut locations. ISME J. 8: 1566–1576. Mach, N., M. Berri, J. Estellé, F. Levenez, G. Lemonnieret al.,
2015 Early-life establishment of the swine gut microbiome and impact on host phenotypes. Environ. Microbiol. Rep. 7: 554–569. Meuwissen, T. H. E., B. J. Hayes, and M. E. Goddard, 2001
Pre-diction of total genetic value using genome-wide dense marker maps. Genetics 157: 1819–1829.
O’Connor, A., P. M. Quizon, J. E. Albright, F. T. Lin, and B. J. Bennett, 2014 Responsiveness of cardiometabolic-related mi-crobiota to diet is influenced by host genetics. Mamm. Genome 25: 583–599.
Pajarillo, E. A. B., J. P. Chae, M. P. Balolong, H. B. Kim, K. S. Seo
et al., 2014 Pyrosequencing-based analysis of fecal microbial com-munities in three purebred pig lines. J. Microbiol. 52: 646–651. Ramos, A. M., R. P. M. A. Crooijmans, N. A. Affara, A. J. Amaral, A.
L. Archibaldet al., 2009 Design of a high density SNP
geno-typing assay in the pig using SNPs identified and characterized by next generation sequencing technology. PLoS One 4: e6524. Roehe, R., R. J. Dewhurst, C. A. Duthie, J. A. Rooke, N. McKain
et al., 2016 Bovine host genetic variation influences rumen microbial methane production with best selection criterion for low methane emitting and efficiently feed converting hosts based on metagenomic gene abundance. PLoS Genet. 12: e1005846. Ross, E. M., P. J. Moate, L. C. Marett, B. G. Cocks, and B. J. Hayes,
2013 Metagenomic predictions: from microbiome to complex health and environmental phenotypes in humans and cattle. PLoS One 8: e73056.
Ryan, K. K., V. Tremaroli, C. Clemmensen, P. Kovatcheva-Datchary, A. Myronovychet al., 2014 FXR is a molecular target for the effects of vertical sleeve gastrectomy. Nature 509: 183–188. Schwiertz, D., K. Taras, K. Schäfer, S. Beijer, N. A. Bos et al.,
2010 Microbiota and SCFA in lean and overweight healthy subjects. Obesity (Silver Spring) 18: 190–195.
Shulzhenko, N., A. Morgun, W. Hsiao, M. Battle, M. Yao et al., 2011 Crosstalk between B lymphocytes, microbiota and the intestinal epithelium governs immunity vs.metabolism in the gut. Nat. Med. 17: 1585–1593.
Sommer, F., N. Adam, M. E. V. Johansson, L. Xia, G. C. Hansson
et al., 2014 Altered mucus glycosylation in core 1 O-glycan-deficient mice affects microbiota composition and intestinal ar-chitecture. PLoS One 9: e85254.
Spor, A., O. Koren, and R. Ley, 2011 Unravelling the effects of the environment and host genotype on the gut microbiome. Nat. Rev. Microbiol. 9: 279–290.
Storey, J. D., and R. Tibshirani, 2003 Statistical significance for genomewide studies. Proc. Natl. Acad. Sci. USA 100: 9440–9445. Strandén, I., and D. J. Garrick, 2009 Technical note: derivation of equivalent computing algorithms for genomic predictions and reliabilities of animal merit. J. Dairy Sci. 92: 2971–2975. Stratz, P., K. Wimmers, T. H. E. Meuwissen, and J. Bennewitz,
2014 Investigations on the pattern of linkage disequilibrium and selection signatures in the genomes of German Piétrain pigs. J. Anim. Breed. Genet. 131: 473–482.
Turnbaugh, P. J., R. E. Ley, M. A. Mahowald, V. Magrini, E. R. Mardiset al., 2006 An obesity-associated gut microbiome with increased capacity for energy harvest. Nature 444: 1027–1031. Valente, B. D., G. J. M. Rosa, G. De Los Campos, D. Gianola, and M. A. Silva, 2010 Searching for recursive causal structures in multivar-iate quantitative genetics mixed models. Genetics 185: 633–644. VanRaden, P. M., 2008 Efficient methods to compute genomic
predictions. J. Dairy Sci. 91: 4414–4423.
Vijay-Kumar, M., J. D. Aitken, F. A. Carvalho, T. C. Cullender, S. Mwangiet al., 2010 Metabolic syndrome and altered gut micro-biota in mice lacking toll-like receptor 5. Science 344: 228–231. Wang, Q., G. M. Garrity, J. M. Tiedje, and J. R. Cole, 2007 Naive Bayesian classifier for rapid assignment of rRNA sequences into the new bacterial taxonomy. Appl. Environ. Microbiol. 73: 5261–5267. Wellmann, R., S. Preuß, E. Tholen, J. Heinkel, K. Wimmerset al.,
2013 Genomic selection using low density marker panels with application to a sire line in pigs. Genet. Sel. Evol. 45: 28. Wen, L., R. E. Ley, P. Y. Volchkov, P. B. Stranges, L. Avanesyanet al.,
2008 Innate immunity and intestinal microbiota in the devel-opment of Type 1 diabetes. Nature 455: 1109–1113.
Wlodarska, M., C. A. Thaiss, R. Nowarski, J. Henao-Mejia, J. P. Zhanget al., 2014 NLRP6 inflammasome orchestrates the co-lonic host-microbial interface by regulating goblet cell mucus secretion. Cell 156: 1045–1059.
Zhao, L., G. Wang, P. Siegel, C. He, H. Wanget al., 2013 Quan-titative genetic background of the host influences gut micro-biomes in chickens. Sci. Rep. 3: 1–6.