Development, Characterization and Analysis
of Quartz Tuning Fork Sensor for Atomic
Force Microscope
Syed Basit Ali Shah1, Naveed Ullah2, M. Naeem Khan3, S. Shoukat Ali Shah4, Fazli Yazdan5
M.Sc.Scholar, Dept. of Mechanical Engineering, UET, Peshawar, Pakistan1
Asst. Professor, Dept. of Mechanical Engineering, UET, Peshawar, Pakistan2
Professor, Dept. of Mechanical Engineering, UET, Peshawar, Pakistan3
Asst. Professor, Dept. of Mechanical Engineering, UET, Peshawar, Pakistan4
Lecturer, Dept. of Mechanical Engineering, UET, Peshawar, Pakistan5
ABSTRACT: Quartz Tuning Forks (QTFs) have been used as substitute force detection sensors in various scanning probe microscopy experiments in place of Micromachined Cantilevers due to many advantageous properties, such as high Quality Factor, low cost, and exceptional mechanical stability. QTF is usually modeled as Butterworth-Van Dyke (BVD) equivalent circuit. However, QTF needs to be characterized before using it as a sensor. We devised a relatively simple method for the electrical characterization of QTF using a Dual Phase Lock-in Amplifier. Moreover, the vacuum canister is removed for attaching a sharp tip to it where it has been noted that the Quartz Tuning Fork exhibits a decrease in the Quality Factor mainly due to air resistance in ambient environment. There is no further investigation on the reduction in the Quality Factor of QTF. We carried out a series of experiments in the vacuum chamber and ambient air. We found a decline in the Quality Factor which is attributed to the irreversible damage caused while canister removal and environmental effects. Finally, we fabricated QTF sensor by attaching a sharp Tungsten tip that is electrochemically etched in NaOH solution. The QTF sensors were then checked for the Quality Factor, which was reduced significantly due to extra mass attachment but still was high enough to be used as a force detection sensor.
KEYWORDS:Atomic Force Microscope, Quality Factor, Quartz Tuning Fork, Etching
I. INTRODUCTION
Tuning forks have been broadly utilized from musical instruments to crystal oscillators. Lately, tuning fork crystal oscillators are attracting considerations because of their convincing applications in power and mass sensors [1]. Initially intended for high precision frequency control, quartz tuning forks are now broadly utilized as a part of watches and for other frequency standards [2]. Giessibl exhibited that quartz tuning fork oscillator could be utilized as a sensor in atomic force microscope [3]. Quartz tuning forks (QTFs) are one of the vastly used sensors in science and engineering because of their less internal energy dissipation (high quality factor, Q), good mechanical strength, and widespread accessibility for cheap [4-6]. Commercial QTFs are accessible with an extensive variety of full frequencies, however QTFs with the resonance frequency of 32.768 kHz are all regularly found in Scanning Probe Microscopy (SPM) applications. As micromachined cantilevers used in force microscopy typically have resonant frequencies in the range of 10 to 300 kHz, a 32.768 kHz QTF without key changes in experimental setups can be readily implemented in many SPM applications. Due to the piezoelectric nature of QTFs the excitation and detection of the motion of the electrodes can be accomplished electrically [7]. An as-got quartz tuning fork is enclosed in a vacuum-fixed container for commercial utilize; its quality factor can be as high as 40 000 – 50 000. At the point when utilized as a SPM force sensor under ambient conditions, the metallic canister must be removed and the two prongs are presented to air. To be helpful as a force sensor, a sharp SPM probe tip must be connected to the end of one electrode [8]. The most critical part of the tuning fork sensor is the tip. It needs to be light, short to minimize the decline in resonance frequency of the tuning fork and probable resonances of the tip itself [9], it needs to be electrically connected to allow for detection of the tunnel current and should also be sharp on a mesoscopic scale to minimalize long range forces (electrostatic and van der Waals). The QTF is enclosed in a vacuum canister. Its fundamental frequency remains unchanged due to it being sealed (through the canister) from the effects of the environment. But whenever the canister is removed and the quartz crystal is exposed to the environment, its quality factor recedes. As a result its fundamental frequency changes due to its interaction with the humidity, heat and pressure of the outer environment. For the QTF to be used as a sensor, a Tungsten tip is attached to one of the QTF’s electrode. Electrochemical etching is required to etch Tungsten tips. A 3.2 mm Tungsten wire of diameter 250 µm is dipped in two molar Sodium Hydroxide (NaOH). Stainless steel screw on acts as one electrode while the Tungsten wire as another [10,11].
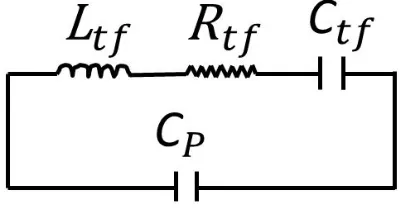
A QTF has been usually modeled as a mechanical resonator that can be defined by the BVD equivalent electrical circuit [12].
Fig 2: Equivalent Butterworth-Van Dyke electrical model for QTF
A simple analysis of the BVD circuit yields the total admittance of the circuit to be where Rtf is the resistance, Ltf is
the inductance, Ctf is the motional capacitance, and Cp is the inevitable parasitic capacitance of the circuit involving a
QTF. Cp depends on the lengths and kinds of cables including other factors used in the measurement setup. The
Thus, if the real (in-phase) and imaginary (out-of-phase) parts of the admittance can be measured, all relevant electrical parameters can be found by curve fitting data to the two above equations.
The canister removal induced permanent damage to the electrodes of the QTF, thereby diminishing the quality factor. It is also imagined that the quality factor also dwindles with the change in the environmental effects. The effects include the rusting of the QTF, the pressure and temperature changes and the humidity.
II. EXPERIMENTALDETAILS
The QTF is similar to a mechanical setup having a damper, spring and mass. It is analogous to an electrical setup of an RLC circuit. It can be modeled as a BVD circuit [14]. The individual components of the BVD circuit are found out to characterize the QTF.
Even though the mechanical constraints are of ultimate interest, electro-mechanical equivalence permits simple translations between the electrical and mechanical parameters. Therefore, for the precise and complete characterization of a QTF it is vital to measure the relevant electrical parameters [15]. It is done by incorporating a custom BVD formula into a software – Igor Pro. the data set is opened in the Igor Pro and our custom formula applied to find out individual values of quality factor, resistance, inductance and frequency. The electrical characterization of a QTF is carried out via an experimental setup that includes, a Lock-In Amplifier, Function Generator, Current Preamplifier and a Data Acquisition setup (a computer running LabVIEW program).
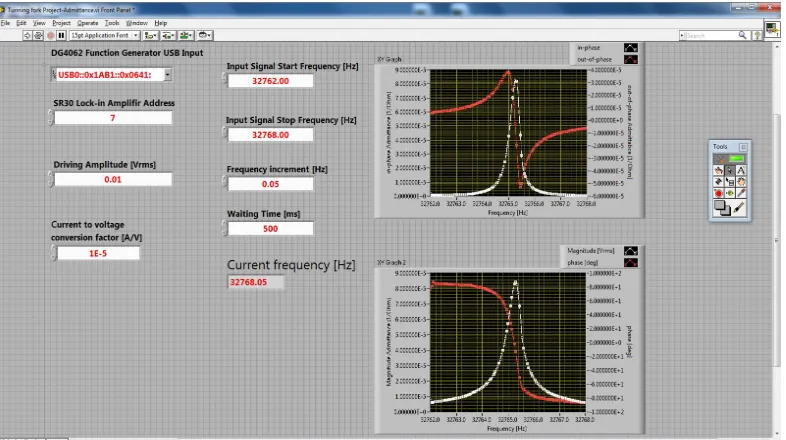
The function generator provides the voltage to the QTF that in turn provides current to the preamplifier. The current provided by the QTF is in micro amps that can’t be processed by the lock-in so the current is fed to a preamplifier that amplifies it into a larger voltage. The lock-in collects the data among the ambient noise and provides it to the data acquisition for recording. This is the interface of the LabVIEW software that was used for the data acquisition part.
Fig 4: LabVIEW program for data acquisition and control
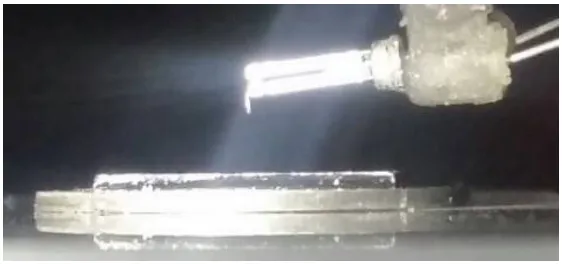
Fig5: Electrochemical etching setup
Tungsten wire suspending from the top of the stand was also held in place by an Alligator clip. The etching was done using an AC Transformer with a rated output voltage of 7.4V. A 3-4 mm length of Tungsten wire was dipped in the NaOH solution and the AC Transformer turned on for the etching process to be done so that the tips could be etched for the QTF. The tip could be seen being etched as effervescence would be observed from the submerged part of Tungsten.
Fig 6: Tungsten tips etched (zoomed-in view)
The QTF was removed from the canister using a narrow beaked pliers. A little tiny drop of hot glue was placed on a prong of the QTF and the tip gently placed on that prong. After a while the hot glue hardened and hence a QTF sensor fabricated. The fabricated QTF sensor was gently placed in a container for safe keeping. A few QTF sensors were fabricated in such manner.
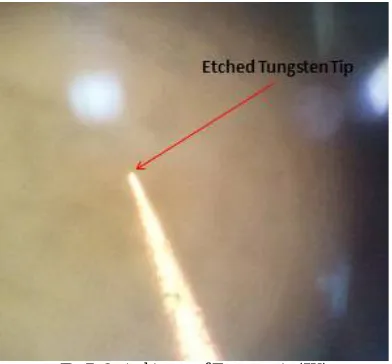
Fig 7: Optical image of Tungsten tip (5X)
The current through a QTF accurately represents the vibration of the QTF electrodes. This current is not easy to measure because of the parasitic capacitance Cp. The Cp is the reason for the irregularity seen in the current.
QTF setup [17]. A suitable quantity of current into the circuit can be deduced by adjusting the variable capacitor till an appropriate current is resulted.
Fig 8: Compensation circuit [18]
A few of the QTFs were damaged while they were being removed from the canister and some in the fabrication process as well.
Fig9: QTF sensors fabricated
Fig 10: SEM images of QTF electrodes’ damage
Before the attachment of the tips, when the QTF is removed from its canister its properties change drastically. The QTF is under vacuum in its chamber. When the chamber is removed, to use it as a sensor, the QTF is immediately subjected to a change in pressure, temperature and lack of vacuum. In the process of removing the QTF from its chamber it is permanently damaged to the slightest in the removing process due to the friction caused between the QTF and its chamber. The QTF is also subjected to air which causes microscopic corrosion on its surface. These cause a dramatic drop in the quality factor of the QTF from when it is in canister. We suspect that in addition to these factors, Environmental Effects are also a huge constituent in the deterioration of the quality factor. To prove our claim a we took a QTF. Found out its quality factor inside a canister. Then we removed its canister and immediately placed it inside a Vacuum Chamber. Vacuum Chamber is a device that guarantees full vacuum. Thereby nullifying the effects of environment, that include; pressure, temperature and humidity.
The QTF was measured for its quality factor, resistance, frequency and inductance. The focal point of our study was to find the change in quality factor. The data set was collected for the QTF with five days interval in between the individual QTF readings. The drop in quality factor was recorded over the course of the experiment. A drop was observed in the Quality Factor readings over time.
Fig 11: Schematic diagram for Electrical Characterization
Data was recorded on the same day that the VC data was recorded for Day 1. The data was collected after five days. Every time the VC data was recorded, on the very same day the data for the ambient environment was also recorded, to point out the difference in data.
The quality factor values indicated a drop than the values recorded for the QTF in Vacuum Chamber. Even though the values of the quality factor are less than that of the data of the Vacuum Chamber but still the steeper drop indicates environmental effects affecting the values of quality factor when in ambient environment.
Therefore, suggesting that although other factors are major in contributing towards the quality factor decrement, the Environmental Effects are also a main contributor.
III.RESULTSANDDISCUSSION
The trait that we are trying to investigate is the Quality Factor Decrement due to the Environmental Effects on the QTF sensor. The environmental effects are applicable on the QTF after it has been extracted from the canister. It encompasses the rusting effect on the QTF, after the canister has been removed.
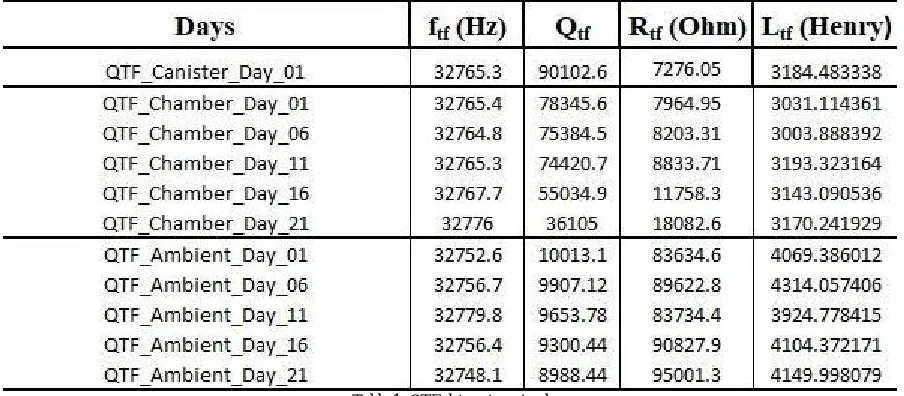
The temperature change that acts on the QTF sensor. And the humidity effect that would also be a contribution towards the quality factor decrement. A QTF was taken and its Quality Factor was measured while being in the canister. The data collected is arranged in a table. The same QTF was placed in a Vacuum Chamber (VC) after its canister was removed. The conditions were constant throughout the experiment. The data collected was between five days interval. We had devised a custom Butterworth Van Dyke formula for Real Values in the Igor Pro software. We loaded the Excel sheet files generated from the Lock-In Amplifier into our custom formula, curve fitted the data with the formula and extracted Frequency (ftf), Quality Factor (Qtf), Resistance (Rtf) and Inductance (Ltf) values for the individual excel
sheets. The four component values were made into a separate excel sheet and the trend was analyzed. The process was carried out for the entire data set. The data that was extracted from the QTF whilst it was in a Vacuum Chamber and the data that was extracted from the QTF whilst being placed in an ambient environment is included in the table.
Table 1: QTF data categorized
Graph 1
Some of the data extracted was taken from the QTF that was placed in an ambient environment. The conditions were not constant. The data collected was between five days interval. This data too indicated a drop in the Quality Factor. All the Environmental Effects were also applicable on the sample QTF. The results have been incorporated in the graph (Graph 2).
Graph 2
It was proven that though both the environments proved to be a factor in decreasing the quality factor of the QTF, the sample QTF placed in the ambient environment that was subjected to all the environmental effects. It proved the possibility of the quality factor decrement due to the environmental effects.
0 20000 40000 60000 80000 100000
0 5 10 15 20 25
Q u al it y Fa ct o r
Number of Days
Quality Factor Decrement (Inside Vacuum
Chamber)
8800 9000 9200 9400 9600 9800 10000 102000 5 10 15 20 25
Q u al it y Fa ct o r
Number of Days
IV. CONCLUSION
The QTF sensors were fabricated by removing them from their canisters, and the electrochemically etched Tungsten tips were attached onto them. The electrical characterization of the QTFs was done by using a lock-in amplifier setup, and the output signal was run through a custom written LabVIEW programing code in the data acquisition section. The paper concludes that along with other factors, the Environmental Effects are indeed a factor into the Quality Factor Decrement. The Humidity plays a role in the drop of the QTF’s quality factor. And so, does the temperature change deteriorate the quality factor of the QTF. The Pressure change also causes the quality factor to decrease as inside the canister the Pressure is different from when it is extracted from its canister. And finally, the quality factor decrement is also a result of the Rusting Effect caused on the surface of the QTF from when it is removed from its canister. The rusting changes the surface finish of the QTF, that adds to the decrement of the quality factor of the QTF. And the irreversible damage done to the QTF during the removal of canister is also a reason to the quality factor being lower than the factory rating.
All these effects are applicable on the QTFs after being removed from the canister. The environmental effects can a have a change in the QTF in addition to the initial change caused by the permanent damage done to the QTF’s electrodes during canister removal.
The paper concludes that along with the damage done to the QTF while the canister removal process proven to affect the quality factor, Environmental Effects too are indeed a reason towards the Quality Factor Decrement.
REFERENCES
[1]. Naveed Ullah, et al., New Physics: SaeMulli. 65(1), 76 (2015).
[2]. F. Massee, PhD Thesis. 123 (2011).
[3]. AndraMandru, PhD Thesis. 1 (2011).
[4]. J.-M. Friedt and E. Carry, Am. J. Phys. 75, 415 (2007).
[5]. K. Karrai and R. D. Grober, Appl. Phys. Lett. 66, 1842 (1995).
[6]. F. J. Giessibl, Appl. Phys. Lett. 73, 3956 (1998).
[7]. A. Castellanos-Gomez, N. Agrait and G. Rubio Bollinger, Nanotechnol. 20, 215502 (2009).
[8]. J. Rychen, et al., Rev. Sci. Instrum. 71, 1695 (2000).
[9]. F. J. Giessibl, Rev. Mod. Phys. 75, 949 (2003).
[10]. Naveed Ullah, et al., New Physics: SaeMulli. 65(1), 76 (2015).
[11]. Y. Qin and R. Reifenberger, Rev. Sci. Instrum. 78, 063704 (2007).
[12]. J. Henderson, Electronic Devices, Concepts, and Applications (Prentice Hall, New Jersey) 357 (1991).
[13]. J. Stirling and G.A. Shaw, Beilstein Journal of Nanotechnology. 4(1), 10 (2013).
[14]. Ibe J.P., et al., J. Vac. Sci.Technol. A8, 3570-3575 (1990).
[15]. Allan J. Melmed, J. Vac. Sci. Technol. B9(2), 601-608 (1991).
[16]. Y. Qin and R. Reifenberger, J. Nanosci. Nanotechnol. 6, 3455 (2006).
[17]. G. Otero, L. Gonzalez and M. Puig-Vidal, Sensors. 12, 4803 (2012).
![Fig 8: Compensation circuit [18]](https://thumb-us.123doks.com/thumbv2/123dok_us/1567017.1192616/7.595.94.379.468.683/fig-compensation-circuit.webp)