Experimental research of the process of
crystallization front propagation from a cooled
vertical side in a horizontal fluid layer
Arseniy V. Mikhaylov1, *, Vitaliy A. Grishkov2, Konstantin Y. Ermolayev3, and Vladimir S. Berdnikov1, 2
1
Novosibirsk State Technical University, Novosibirsk, 630073, K. Marx Ave., 20, Russia
2
Kutateladze Institute of Thermophysics SB RAS, Novosibirsk, 630090, Ak. Lavrentiev Ave., 1, Russia
3Novosibirsk State University, Novosibirsk, 630090, Pirogov St., 2, Russia
Abstract. The experimental research of heptadecane’s crystallization front propagation is carried up on horizontal directed crystallization model. The temperature distributions on free surface are measured during crystallization front propagation process using thermal imager and thermocouples. The time dependence of crystallization front form was investigated using digital video recording.
1 Introduction
One of the basic methods of obtaining single crystals from melts is horizontal directed crystallization (HDC) [1, 2]. Like in other methods, this method is poorly investigated in processes of conjugate heat transfer near the crystallization front [1-5]. These processes determine the rate of crystallization, the shape of the crystallization front, and the temperature fields in the solid. These factors determine the quality of single crystals obtained. It is practically impossible to study hydrodynamics of melts and to measure temperature distributions in high-temperature melts [4 - 6]. Therefore, the basic methods of convective heat transfer processes study are physical and numerical simulation. This is explained by the fact that the thermal unit is closed by multilayer system of screens to reduce heat losses. It is often practically impossible to measure temperature distributions on free surfaces of melts using optical methods. The high-temperature melts are aggressive, as a rule. Real technologies require high purity of the initial substance – melt. Inserting thermocouples is unacceptable because they can melt. Applying protective shells increases the size of the probe and makes it impossible to receive adequate information. The present paper is devoted to the investigation of the crystallization front propagation of the liquid imitating melts in horizontal container using thermal imager and digital video recording. The temperature on the free liquid boundary and on the walls of the container was also measured by micro thermocouples
*
2 Experimental setup
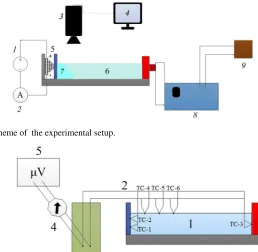
The work was conducted on installation; the scheme of its operation portion is shown on fig. 1. The fluid layer is limited with “hot” and “cold” vertical walls at the end faces of the container. The “hot” wall temperature is kept higher than the temperature of heptadecane crystallization by pumping water from thermostat. The opposite wall is cooled by Peltier-module. After the module is turned on and the wall begins to cool the longitudinal temperature gradient appears. As the temperature comes lower than the temperature of heptadecane crystallization, the crystallization front is formed. The control thermocouples are installed on the vertical walls and along the free surface (fig. 2). The thermocouples are made of nichrome-constantan wire with 0.1 mm in diameter. The temperature fields on the free surface of the liquid are measured by thermal imager. The thermal imaged films are obtained in monotone wall cooling regime. For thermal imaging, the FLIR X6350sc thermal imager was used. It has 640x512 matrix made of mercury cadmium telluride (HgCdTe) and that enables to measure the temperature fields with high spatial resolution. The measurement error does not exceed 1%. Maximum frame rate of the survey can be 300 Hz. The device is controlled with FLIR ResearchIR software. the process of crystallization front propagation is captured by digital camera through the transparent side wall. The video film processing enabled to determine the form of crystallization front during its propagation.
3 Experimental results
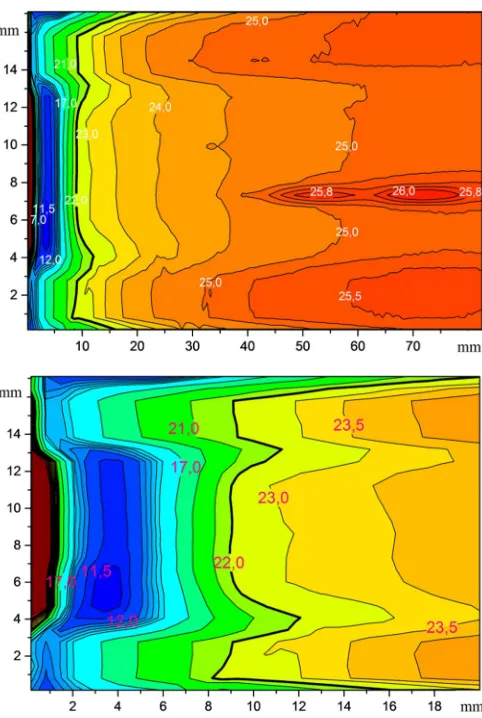
The measurements were taken with thermo electrical module worked in 0.5 A regime with heat sink from module’s backside. The time-temperature dependencies measured with thermocouples placed at free surface of heptadecane melt and at different distances from the “cold” wall are shown at fig. 3. The heated end face wall was kept at constant temperature by pumping water from thermostat with temperature of 25 ºC. The isotherm fields built with computer processing of the thermal imaging film are presented in different scales at fig. 4. These fields were built using the ORIGIN programme. Isotherms with different values are marked with numbers. The position of crystallization front is marked with bold black line. We can see that the crystallization front had moved by 10 mm approximately. The data obtained enable to compare the thermocouple and thermal imaging methods of temperature measurement. Thermal imaging film processing made it possible to build temperature distributions on the free surface as a function of time (fig. 5). The evolution of crystallization front form in time made by digital recording is shown at fig. 6. Here we can clearly observe the effect of the inflow of heated melt in the upper part of the front. In the experiment, the shape of the front is also affected by the presence of a meniscus on the wettable cold wall. The influence of the finite thermal conductivity of the bottom of the cell can also be noticed.
Fig. 1. The scheme of the experimental setup.
Fig. 2. The scheme of the thermocouples measurements
Fig. 3. The temperature values from time obtained from thermocouples placed at: curve 1, 2 – at cooled wall; 3, 4 – at the opposite wall; 5, 6, 7 along the surface at different distances from cooled wall (30 mm, 16 mm, and 3 mm)
0 10 20 30 40 50 60 70 80 90 100
14 16 18 20 22 24
t, min
T, oC
Fig. 4. The isotherm fields on the melt surface and sidewalls of the container
Fig. 5. Temperature distribution along the surface in the center of container, averaged in 2 mm band: 1 – t = 0 min; 2 - t = 3.8 min (beginning of crystallization); 3 – t = 8.2 min; 4 – t = 13.4 min; 5 – t = 27.7 min; 6 – t = 55.2 min; 7 – t = 102.2 min; 8 – front side of face wall.
0 5 10 15 20 25 30
14 16 18 20 22
T, oC
1 2 3 4 5 6 7 8
x, mm
4 Conclusions
The experimental research of non-stationary temperature fields on free surface of heptadecane melt after the cooling of the vertical wall of the container and the initiation of crystallization process on the physical model of crystal growth with HDC method was carried up. The monotone time dependence of temperature fields on free surface was studied with the thermal imager. The thermal imaging film processing enabled to obtain temperature distributions along free surface at different moments of time. The isotherm fields on free surface were built. Time dependencies of temperature in discrete points were obtained with thermocouples. The thermal imaging and thermocouple methods of measurement were compared. The obtained data will be used for planning further experiments as a test of the results of numeral simulation of heptadecane crystallization under the same boundary conditions [4].
This research has been executed within the limits of the project III.18.2.5. Number of the state registration АААА-А17-117022850021-3.
References
1. Muller, G., Crystal Growth from the Melt, (1988).
2. Berdnikov V.S., Zabrodin A.G., Markov V.A., Fluid Mech., Soviet Research, 15, no. 1. P.118-133, (1986).
3. Berdnikov, V.S., Gaponov, V.A., and Kovrizhnykh, L.S., J. Eng. Phys. Thermophys.,
74, no. 4, p. 999- 1006, (2001).
4. Berdnikov V.S., Kislitsyn S.A., Mitin K.A., Bulletin of the Russian Academy of Sciences: Physics, 81, no 10, p. 1251–1256, (2017).
5. Zhang X., Cheng M., Yang S., Huang Y., Journal of Crystal Growth, 463, p. 176-186, (2017).