University of South Carolina
Scholar Commons
Theses and Dissertations
2017
Determining the Population Dynamics and
Reproductive Life History of Commercially
Important Tunas in the Gulf of Mexico
Katrina C. Hounchell
University of South Carolina
Follow this and additional works at:https://scholarcommons.sc.edu/etd Part of theBiology Commons
This Open Access Thesis is brought to you by Scholar Commons. It has been accepted for inclusion in Theses and Dissertations by an authorized
administrator of Scholar Commons. For more information, please [email protected].
Recommended Citation
Hounchell, K. C.(2017).Determining the Population Dynamics and Reproductive Life History of Commercially Important Tunas in the Gulf
D
ETERMINING THE POPULATION DYNAMICS AND REPRODUCTIVE LIFE HISTORYOF COMMERCIALLY IMPORTANT TUNAS IN THE
G
ULF OFM
EXICOby
Katrina C. Hounchell
Bachelor of Science
University of South Carolina, 2016
Submitted in Partial Fulfillment of the Requirements
For the Degree of Master of Science in
Biological Sciences
College of Arts and Sciences
University of South Carolina
2017
Accepted by:
Joseph Quattro, Director of Thesis
Jerry Hilbish, Reader
W. Joe Jones, Reader
ii
iii
ACKNOWLEDGEMENTS
I would like to acknowledge the members of Dr. Quattro’s conservation genetics
laboratory: Mark Roberts, Kathryn Levasseur, Keith Fuller, Katherine Malinski, and
Madison Yost. I would also like to thank my committee members Dr. Jerry Hilbish and
Dr. Joe Jones, who have been excellent mentors throughout my collegiate career. I would
especially like to acknowledge and thank Dr. Joe Quattro, who has been a mentor to me
for the last five years and has provided an environment that opened a world of
possibilities to me. I would also like to acknowledge the Magellan Scholar Program and
the Science Undergraduate Research Fellowship Program for their generous funding of
iv
ABSTRACT
The Gulf of Mexico (GOM) is an important spawning ground for many
commercially important fish species including yellowfin, skipjack, and blackfin tunas. In
particular, it is an essential spawning habitat for Atlantic bluefin tuna, whose stock status
is of great international concern. It is vital to the appropriate conservation management of
these species to determine both the location of their spawning grounds and the genetic
diversity found within them. Fish eggs are a fisheries-independent source of spawning
information that can provide more accurate estimates of spawning sites compared to
larvae. This study describes population diversity and reproductive life histories in
Thunnus and Katsuwonus using fish eggs that were collected during the National Marine
Fisheries Service’s (NMFS) 2011 spring larval survey in the northern Gulf of Mexico.
Of 12,731 eggs surveyed genetically from 121 different sites, 38 Thunnus thynnus, 49
Thunnus albacares, 192 Thunnus atlanticus, and 15 Katsuwonus pelamis were identified.
T.thynnus and K.pelamis had very high haplotypic diversity (h=.995 and h=.946,
respectively), while T.albacares and T.atlanticus had relatively lower haplotypic
diversity (h=.288 and h=.454). Phylogenetic and molecular diversity analyses for each
species revealed that bluefin and skipjack tunas display aggregate spawning at relatively
few sites, while yellowfin and blackfin individuals spawn independently at multiple sites.
All species were found throughout the GOM apart from bluefin tuna which was only
identified along the northern-most edge of the GOM within the continental shelf and
v
TABLE OF CONTENTS
Acknowledgements ... iii
Abstract ... iv
List of Tables ... vi
List of Figures ... vii
Chapter 1: Determining population dynamics and reproductive life history of commercially important tunas in the Gulf of Mexico ...1
1.1 Introduction ...1
1.2 Materials and Methods ...9
1.3 Results ...14
1.4 Discussion and Conclusion ...18
1.5 Tables and Figures ...23
vi
LIST OF TABLES
Table 1.1 Sampling stations, eggs sampled, positive eggs ...21
Table 1.2 Thunnus thynnus haplotypes ...26
Table 1.3 Thunnus albacares haplotypes...27
Table 1.4 Thunnus atlaticus haplotypes...28
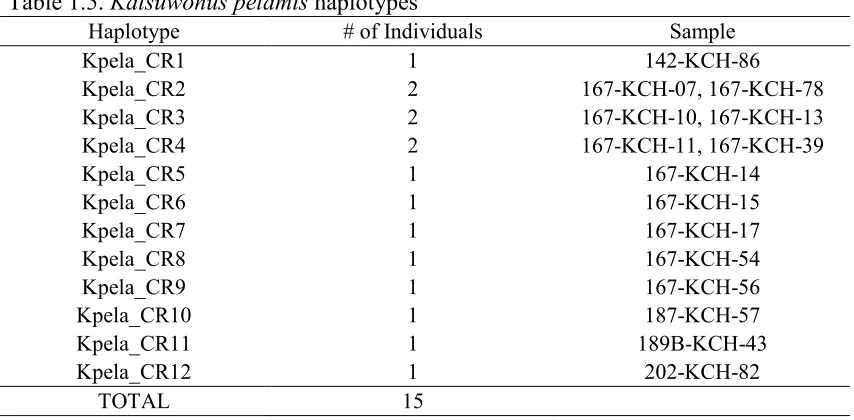
Table 1.5 Katsuwonus pelamis haplotypes ...30
Table 1.6 mtDNA control region polymorphisms in Thunnus thynnus ...31
Table 1.7 Mean statistics for the mtDNA control region of Thunnus and Katsuwonus ....32
Table 1.8 Statistics for the mtDNA control region of Thunnus and Katsuwonus by site ..32
Table 1.9 mtDNA control region polymorphisms in Thunnus albacares ...34
Table 1.10 mtDNA control region polymorphisms in Thunnus atlanticus ...35
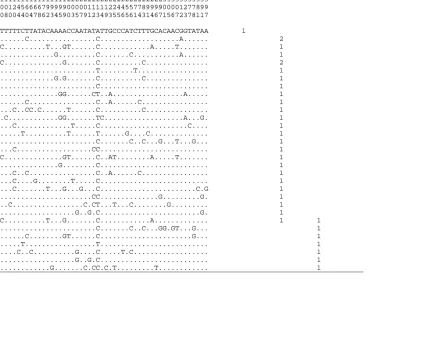
Table 1.11 mtDNA control region polymorphisms in Katsuwonus pelamis ...36
vii
LIST OF FIGURES
Figure 1.1 Spanish neuston net ...38
Figure 1.2 Map of the Gulf of Mexico with collection sites and species found ...38
Figure 1.3 Neighbor joining tree of Thunnus thynnus ...39
Figure 1.4 Neighbor joining tree of Katsuwonus pelamis ...40
Figure 1.5 Neighbor joining tree of Thunnus albacares ...41
Figure 1.6 Neighbor joining tree of Thunnus atlanticus ...42
1
CHAPTER
1
D
ETERMINING THE POPULATION DYNAMICS AND REPRODUCTIVE LIFE HISTORYOF COMMERCIALLY IMPORTANT TUNAS IN THE
G
ULF OFM
EXICO1.1INTRODUCTION
Atlantic bluefin tuna (Thunnus thynnus) are one of the most highly sought after and
valued marine fish and their stock status is of great international concern. This concern has
prompted petitions to list bluefin tuna under CITES appendix I, which would prohibit
international trade, and as an endangered species under the US Endangered Species Act.
Much of the modeling work conducted to determine whether bluefin populations met
CITES or ESA listing criteria suggested either that the stock has been reduced to a small
fraction of historical levels or that the stock could decline to fewer than 500 individuals by
2030, a number that would threaten the existence of the stock and raise the potential for
inbreeding depression and genetic drift. Furthermore, the loss of several migratory
contingents (sensu Hjort 1914, Secor 1999) that once occurred in Norwegian waters and
off the coast of Northern Brazil poses the potential for additional loss of genetic diversity.
Thus, it is critical that material be collected and analyzed to determine the baseline genetic
diversity of the population in its current reduced state. The presence/absence of fertilized
bluefin tuna eggs in ichthyoplankton surveys can be used to identify spawning habitats of
tunas in the Gulf of Mexico (GOM). This method of spawning ground definition is
independent of the tuna fishery and can be used in conjunction with hydrogeographic
2
properties of these presumed spawning locations (e.g., temperature, turbidity,
presence/absence of gyres, etc.) can then be defined. In addition, genetic sequence data of
fertilized eggs can be used to estimate mitochondrial DNA (mtDNA) control region
sequence variation in Thunnus eggs to determine the haplotype diversity in the spawning
population as well as the genetic variation within and between spawning sites in the Gulf
of Mexico.
Investigating the genetic diversity of commercially important tunas in the Gulf of
Mexico will further understanding of spawning aggregations and population dynamics and
provide for more effective species management. The methodology developed in this
project can be applied to any species, allowing researchers to improve management of
many of the species on which world economies rely. For example, in bluefin tuna it is
presently unknown if there is a single spawning population located primarily in the western
Gulf or if there are two separate spawning populations in both the eastern and western Gulf.
Routine ichthyoplankton surveys in the GOM suggest that there is one spawning stock
primarily in the western GOM based on data collected from the National Oceanic and
Atmospheric Administration (NOAA) and National Marine Fisheries Service (NMFS)
joint annual spring larval surveys geared specifically towards collecting bluefin tuna eggs
and larvae (Atlantic Bluefin Tuna Status Review Team 2011). On the other hand, tagging
studies have suggested that there may be two stocks; one in the eastern GOM and one in
the western GOM (Hazen et al. 2016; Wilson et al. 2015). There are different management
strategies that would be most effective for one large population versus two smaller
populations and data from this study will allow managers the ability to choose more
3
1.1.1 LIFE HISTORY
The Gulf of Mexico (GOM) is a shallow, warm sea bordered by Mexico to the
West, the United States to the North and Cuba to the Southeast. It is an important spawning
ground for many commercially important species including flounder (Paralichthys
albigutta; P.lethostigma), sheepshead (Archosargus probatocephalus), and red snapper
(Lutjanus campechanus) (Carter 1986, Collins 1996, and Render 1992). Despite the
importance of the GOM as a spawning ground for commercially valuable fish species, there
is limited understanding about the precise spawning locations, the number of eggs
spawned, and other important metrics that would be useful for fishery managers. It is
particularly important to have a complete understanding of spawning for each fish species
because this information can provide insight into the current and future stock health. The
GOM is the spawning ground for many tunas including: yellowfin (Thunnus albacares),
blackfin (Thunnus atlanticus), and skipjack tunas (Katsuwonus pelamis). The GOM is an
especially important spawning ground for North Atlantic bluefin tuna who spawn
exclusively in the GOM and the Mediterranean (Fromentin and Powers 2005). Because
bluefin tuna are commercially important and only spawn in these two locations, their
population status is heavily monitored. As part of that monitoring effort, the National
Marine Fisheries Service (NMFS) in conjunction with the National Oceanic and
Atmospheric Administration (NOAA) conducts annual spring larval sampling cruises
throughout the GOM (since 1982) to characterize that year’s bluefin tuna breeding
population.
Atlantic bluefin tuna are large, highly migratory pelagic fish that are known to
4
Atlantic BFT). Western Atlantic bluefin tuna spawn primarily from April-May and reach
reproductive maturity between ages 8-12 years (Block et al. 2005; Boustany et al. 2008)
which is much older than eastern Atlantic tuna who are believed to begin spawning at 3-4
years old. Bluefin tuna are multiple batch spawners, producing 5 million eggs (5 yr old
tuna) to 45 million eggs (15-20 yr old tuna) (Fromentin and Powers 2005) and spawning
approximately every 1.02 days (Medina et al. 2002) during breeding season. Their average
fecundity is about 93 oocytes per gram of body mass. Fertilized eggs hatch 24-36 hours
after spawning. The larvae are pelagic and reabsorb their yolk sac within a few days after
hatching (Fromentin and Powers 2005). Bluefin tuna grow relatively rapidly; fish born in
May attain lengths of 30-40 cm by September, growing approximately 1 mm a day (ABFT
Status Review Team 2011).
Yellowfin tuna are a globally distributed, highly migratory species. They inhabit
temperate to tropical waters in the Atlantic, Pacific, and Indian Oceans. Yellowfin tuna
have an average lifespan of six to seven years, reaching reproductive maturity at two years.
They are a highly sought-after fisheries resource and are harvested on both large and small
scales. They are predominantly fished by purse seines and longlines (Itano 2000). Like
bluefin tuna, yellowfin tuna are multiple batch spawners, producing a range of between .97
million and 4.69 million oocytes and spawning about every 1.52 days (Sun et al. 2005).
Blackfin tuna are caught mainly as bycatch in yellowfin tuna fisheries. They are
smaller than yellowfin tuna weighing between 1-5 kg for females and 1.5 to 8.4 kg for
males (compared to yellowfin’s maximum weight of 200kg) (Colette et al. 2011; Schaefer
1998). Relatively little is known about blackfin tuna’s reproductive life history because, as
5
Skipjack tuna are found in tropical and warm waters across the world’s oceans and
are one of the most abundantly fished tunas, constituting approximately 40% of the world’s
annual tuna catch (Ely et al. 2005). Skipjack tuna spawn on average every 1.18 days during
spawning season (Hunter et al 1986). Bluefin, yellowfin, and skipjack tuna all play
important roles in the global fishing economy, and require proper management, especially
an understanding of their reproductive life history and genetic diversity, to ensure long
term sustainability.
1.1.2 EGGS VS. LARVAE
Larval fishes are known to be an important source of fishery-independent data that
are essential to informed management decisions in Thunnus and other commercially
important species (Ingram et al. 2010; Muhling et al. 2010). While larvae provide valuable
fishery data, there are certain limitations associated with their use. For many fish, larvae
can be nearly as difficult to identify conclusively as eggs, making them inaccessible for
use in spawning stock biomass (SSB) calculations. Correct identification is especially
critical for imperiled species like the Atlantic bluefin tuna (Thunnus thynnus). If the
distribution, abundance and relatedness of larval fishes is a rich source of these data, then
certainly similar surveys of eggs have the potential to contribute equally, perhaps more so,
to informed management decisions. The distribution and abundance of the eggs of
commercially important species might, in some cases, provide more valuable information
than larvae. Since many marine fish in the GOM spawn small, predominately spherical
eggs that hatch relatively quickly (usually within 24 hours), eggs are comparatively closer
to the source of spawning than larvae that might be several days to weeks removed from
6
Eggs can more precisely indicate spawning areas because they are completely
planktonic and oftentimes only hours instead of days or weeks away from the initial
spawning event. Therefore, eggs allow for less complicated hindcasting based on location
overlaid on comprehensive physical models. Similarly, rapid DNA-based identification of
fertilized eggs might be useful for ‘adaptive’ sampling, that is, corrections or additions to
sampling schemes, in near-real-time, that target spawning areas of commercially important
species. Finally, fertilized eggs might represent an additional fisheries-independent source
of abundance data with which to inform indices of spawning stock biomass, particularly if
the distribution of eggs and larvae are spatially heterogeneous and their co-occurrence is
uncorrelated. Eggs have not been utilized thus far because as difficult as larvae are to
identify morphologically, eggs are more so.
1.1.3 DNA BARCODING
Accumulating over the past several decades have been molecular genetic surveys
that have contributed to comprehensive fisheries management, and, in many cases, altered
our understanding of the dynamics of marine fish populations (Hauser and Carvalho 2008).
This is especially true for highly migratory species such as bluefin tuna (Thunnus thynnus)
wherein significant amounts of population structure have been determined despite
life-histories conducive to high gene flow (Riccioni et al. 2010, Boustany et al. 2008, Hauser
and Carvalho 2008). However, the estimation of among-population genetic diversity in fish
does not have to address population differentiation directly to have an important impact on
the refinement of fisheries practices. For example, many genetically accessible
population-level parameters are essential components of properly managed fisheries such as whether
over-7
exploitation), the number of contributing individuals (especially females if sperm
limitation is not an issue) to yearly spawning events, and the maintenance of genetic
diversity across annual spawning events. Currently, fisheries themselves supply the
majority of the data for stock assessment, sometimes resulting in biased or inaccurate data.
To avoid bias, management decisions should be supplemented with fishery-independent
approaches such as molecular genetic data and tagging techniques. These
fishery-independent approaches allow for the construction of more comprehensive models for
managing exploited species and populations (Riccioni et al. 2010).
This project uses a molecular genetic approach to quantify bluefin tuna eggs and
cost-effectively characterize the spawning females that contribute annually to the western
Atlantic bluefin tuna population in the northern Gulf of Mexico (GOM). By genetically
analyzing sampled fertilized fish eggs collected during the Spring NMFS larval fish cruise
in May 2011 we can estimate the frequency, abundance and location of fertilized bluefin,
yellowfin, blackfin, and skipjack tuna eggs. We can also estimate the haplotype diversity
of these eggs, which represents the probability that two randomly sampled alleles are
different (Nei 1987).
Surveys of reproductively mature fish in the family Scombridae are known to have
high haplotype diversities. Populations of adult wahoo (Acanthocybium solandri)
demonstrate haplotype diversity ranging from .918 to .999 (Theisen et al. 2008; Garber et
al. 2005). Likewise, Spanish mackerel (Scomberomorus commerson), the common
mackerel (Scomber scombrus), and the chub mackerel (Scomber japonicus) had similarly
high haplotype diversities of .91, .97, and .99 (Sulaiman and Ovenden 2010; Zardoya et al.
8
found to have a haplotype diversity of .993 (Vinas, Alvarado-Bremer, and Carles 2004).
This appears to be especially true in tuna where estimates of population parameters in adult
tunas have been found to have extremely high levels of haplotypic diversity: bigeye tuna
have been found to have haplotype diversities ranging from .998 to .999 (Martinez 2006;
Chiang 2008); yellowfin displayed a haplotype diversity of .997 (Ely et al. 2005); and
bluefin tuna have been found to have a range of haplotypic diversity from .991-.998 (Ely
et al. 2001; Carlsson 2006; Boustany, Reeb, and Block 2008; Carlsson 2004).
Elevated levels of haplotype diversity in adults results in the probability of
randomly sampling two individuals with the same haplotype being very low; in other
words, for bigeye tunas there is a 97% chance that two randomly sampled individuals
would be genetically different (Nei 1987). Diversity in the mtDNA control region of
bluefin, yellowfin, and skipjack tunas is so high that essentially every individual in the
population is unique. Based on this, we can quantify the number of females contributing to
any given sample. If two eggs have identical mtDNA control region haplotypes, then based
on the extremely high haplotype diversity of Scombridae adults, it can be assumed that the
two eggs came from the same female. Alternately, if two eggs have different mtDNA
control region haplotypes, then it can be assumed that they were spawned from different
females. Using this information we can then determine the minimum number of spawning
females for a given sample.
I hypothesize that bluefin spawning is not evenly distributed across the Gulf of
Mexico, and that the largest component of genetic variation in bluefin eggs within years
lies within sampling locations (ie, eggs collected in the same location are the products of
9
majority of the larvae have been found in the western GOM. However, tagging studies
suggest that there are two spawning populations in the western and eastern Gulf.
Alternatively, eggs may be produced in both portions of the Gulf of Mexico, but
preferentially advected into the western portion (Oey, Ezer and Lee 2013).
1.2 MATERIALS AND METHODS
1.2.1 EGG COLLECTION
The NOAA vessel Gordon Gunter collected complex mixtures of eggs from 121
stations in the northern Gulf of Mexico from May 3, 2011 to May 27, 2011. A Spanish
neuston net with a .505mm mesh netting attached to a 1x2 m pipe frame was used to collect
the eggs (Figure 1.1). The net was towed in an oscillating pattern from just below the
surface to a depth of 10m for ten minutes at a speed of two knots (Habtes et al. 2014). A
total of 49,808 eggs were collected and preserved in 95% ethanol prior to DNA extraction.
All eggs utilized in genetic analyses were photographed using a Leica EX4D digital
microscope. A scale was included in each image in order to convert the diameter of the
eggs from pixels to the closest hundredth of a millimeter. Of the 49,808 eggs collected,
9,331 eggs from all 121 stations were extracted via a plate extraction method. Additionally,
in a previous study 3,400 eggs from sixty-eight sampling stations that yielded greater than
fifty eggs were analyzed by pooling fifty eggs into one DNA extraction procedure (Quattro,
10
1.2.2 DNA BARCODING
Pooled Extraction Method
Total DNA was extracted from eggs using Qiagen DNeasy columns following the
manufacturer’s instructions, except that DNA was eluted in a final volume of 50 µl. PCR
reaction volumes (25µl) contained 10 mM Tris-HCl (pH 8.3), 50 mM KCl, 2.5 mM MgCl2,
0.1% Tween 20, 5% DMSO, 200 mM each dNTP, 10 pmol of each primer (either Scombrid
specific or Thunnus specific sets) and one unit of Taq DNA polymerase. Cycling
conditions were: initial denaturation at 94°C for 4 minutes, followed by 40 cycles of a
denaturation at 94°C for 1 minute, an annealing at 48°C for 1 minute, and an extension at
72°C for 1 minute, followed by a final extension of 72°C for 6 minutes. Amplification
success was confirmed by agarose gel electrophoresis. Positive Thunnus amplifications
were confirmed by DNA sequencing using the Big Dye Terminator 3.1 Cycle Sequencing
Ready Reaction Kit (Applied Biosciences) in both the forward and reverse directions using
the respective amplification primers. Cycle sequencing products were analyzed on an
Applied Bioscience 3130 automated sequencer. Sequence trace files were edited manually
using Sequencher (Applied Biosciences) and visually compared to known Thunnus
sequences.
Plate Extraction Method
Total DNA was extracted from individual eggs using a plate extraction method
developed as part of this study. Each egg was placed in a single well within a 96-well PCR
plate. Then, 47.5 µl of lysis buffer (10mM Tris, 10mM EDTA, 10mM NaCl, 0.5%
11
eggs then lysed at 55℃ for at least three hours or until all of the tissue had been lysed (up
to twelve hours). After lysing, 150µl of precipitation buffer (100% EtOH, 5M NaCl stock)
was added to the wells. The samples incubated at room temperature for 30 minutes and
then were centrifuged at 1500g for 45 minutes. The plates were inverted and lightly tapped
to remove the supernatant. 150µl of wash buffer (70% EtOH) was then added to the plates,
which were centrifuged at 1500g for 15 minutes. Once again, the supernatant was decanted
by turning the plates over and lightly tapping. This step occurred three times. After the
final wash, the plates incubated in a thermocycler with the lid off at 37℃ until all of the
ethanol had evaporated. The DNA was then re-suspended in 50µl of molecular grade water.
Amplification
After extraction, amplification via the Polymerase Chain Reaction (PCR) was
performed using the ‘universal’ 16S rRNA primers, 16sar and 16sbr (Palumbi 1996). This
PCR was used as a positive control to ensure that the DNA extraction was successful. To
determine if any of the Thunnus species are present, another PCR was performed using
Thunnus specific primers (Thunnus171F and Thunnus 349R,16S, Quattro unpublished).
Unfortunately, this locus is not a reasonable choice to estimate maternal contribution to the
egg pool because it is unable to unambiguously identify yellowfin versus blackfin tuna.
Additionally, the sequence is not variable enough among individuals to determine maternal
contribution. However, a variety of ‘hypervariable’ primer sets useful for assaying mtDNA
variation in fishes have been published including several for tunas – most sets overlap to a
large extent and therefore are not exclusive. We employed primers used described in Jones
and Quattro (1999 – PRO-LO and TCSBR, dloop)– these primer pairs have been
12
1999), pygmy sunfishes (Quattro et al. 2001), sturgeons (Quattro et al. 2002), and more
recently tunas and billfishes (both larvae and eggs; Quattro, unpublished data). All samples
positive for Thunnus were subsequently amplified and sequenced at the mtDNA control
region in order to differentiate between Thunnus species.
Reaction volumes for all three PCRs (Universal 16S, Thunnus specific 16S, and
dloop) (25µl) contained: 10 mM Tris-HCl (pH 8.3), 50 mM KCl, 2.5 mM MgCl2, 0.1%
Tween 20, 5% DMSO, 200 mM each dNTP, 10 pmol of each primer and one unit of Taq
DNA polymerase. Cycling conditions consisted of an initial denaturation at 94°C for 4
minutes followed by 40 cycles of a denaturation at 94°C for one minute, an annealing at
48°C for one minute, an extension at 72°C for one minute, followed by a final extension
of 72°C for six minutes. Amplification success was confirmed by 1.5% agarose gel
electrophoresis. Amplification products were sequenced using the Big Dye Terminator 3.1
Cycle Sequencing Ready Reaction Kit (Applied Biosciences) in both the forward and
reverse directions using the respective amplification primers. Cycle sequencing products
were then visualized using a commercial service (Functional Biosciences; Madison,
Wisconsin). Sequence trace files were edited manually using Sequencher (v4.1.4; Gene Codes Corp.), exported and parsed into the programs MEGA7 (Molecular Evolutionary
Genetics Analysis version 7.0; Kumar, Stecher, and Tamura 2015),DNASP (Librado and
Rozas 2009) and Arlequin (Excoffier and Lischer 2010) for subsequent phylogenetic and
13
1.2.3 EGG IDENTIFICATION
The software package SAP (Statistical Assignment Package; Munch et al. 2008)
was used to assign taxonomic identity to the samples. SAP assigns samples to a taxonomic
group by querying GenBank, the NCBI online genetic database, for homologues. SAP
returns the 100 most similar sequences from GenBank that have a sequence identity of
greater than 0.90. SAP aligns these sequences using ClustalW2 (Larkin et al. 2007) and
creates phylogenetic trees from the sequences using a Markov chain Monte Carlo
simulation and then uses a Bayesian approach to calculate the probability of assignment to
individual taxonomic categories. Taxonomic assignment is based on probability of
placement of the sample sequence (i.e., individual egg) against homologues within the
resultant trees. Taxonomic assignments with probabilities below 0.95 were considered to
be ambiguous matches and the next most proximal taxonomic category (e.g., family if
genus was ambiguous) was used for identification. Taxonomic assignments, even with
high probabilities, were assumed to be unreliable if sequence identity values between the
queried sample sequence and the most similar homologue were less than 0.95. In such
cases, the sample was assigned the next most proximal taxonomic category.
1.2.4 STATISTICAL ANALYSES
MEGA7 (Molecular Evolutionary Genetics Analysis version 7.0; Kumar, Stecher,
and Tamura 2015) was used to align sequences using Muscle (Edgar 2004) and to create
neighbor joining trees for each species. MEGA files were then imported into DNASP
14
create Arlequin files to compute haplotype diversity, nucleotide diversity, Tajima’s D,
AMOVA, FST, and the number of polymorphic sites.
1.3 RESULTS
Of the 49,808 eggs collected during NMFS’s 2011 Spring larval cruise, a total of
12,731 eggs were surveyed and 12,658 were successfully extracted in this study. 3,400
eggs were extracted by the pooled extraction method and 9,331 eggs were individually
extracted using the plate extraction method. A total of 12,658 eggs were successfully
extracted and amplified resulting in a failure rate of 0.573%. The sequence analyses
revealed that there were 38 bluefin (Thunnus thynnus), 49 yellowfin (Thunnus albacares),
192 blackfin (Thunnus atlanticus), and 15 skipjack (Katsuwonus pelamis) tuna (Table 1.1).
PCR amplifications using the pooled method yielded ten stations with positive
Thunnus specific and Scombrid specific amplifications. DNA sequencing determined that
four of the sampled stations contained at least one bluefin tuna (T. thynnus). Three stations
contained at least one blackfin or yellowfin tuna (T. atlanticus or T. albacares; which
cannot be unambiguously identified using the currently analyzed locus). And one station
contained at least one T. thynnus and at least one T. atlanticus or T. albacares. PCR
amplifications using the plate extraction method yielded thirty-five stations with positive
Thunnus and Katsuwonus specific amplifications. Three stations contained at least one
bluefin tuna (T. thynnus), 14 stations contained at least one yellowfin tuna (T. albacares),
26 stations contained at least one blackfin tuna (T. atlanticus), and five stations contained
15
The geographic location of identified Thunnus eggs was distributed throughout the
northern Gulf of Mexico (Figure 1.2). Bluefin tuna were found in both the eastern and
western portions of the GOM on the continental shelf and slope. Yellowfin tuna were found
throughout the eastern and western GOM, primarily on the continental shelf and slope, but
some were also present in deeper waters off of the slope. Blackfin tuna were found across
the GOM in both the shallower waters of the shelf and deeper waters off the slope. Blackfin
tuna were the most widely distributed of the species sampled. Skipjack tuna were found in
sites on the continental slope in both the eastern and western GOM.
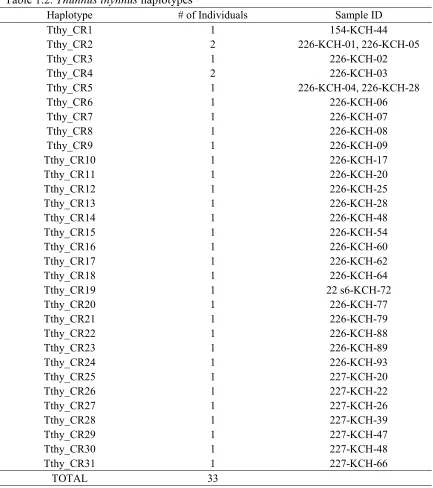
Thirty-one haplotypes were identified for 33 Thunnus thynnus individuals from a
total of three stations. All but two haplotypes (Tthy_CR2 and Tthy_CR4) had a single
individual with the haplotype. Tthy_CR2 and Tthy_CR4 had two individuals each. Site
154 had a single individual, site 226 had twenty-five individuals with 23 haplotypes, and
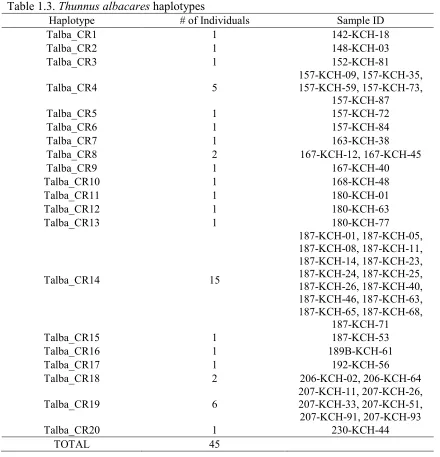
site 227 had seven individuals with seven different haplotypes (Table 1.2). Twenty
haplotypes were identified for 45 Thunnus albacares individuals from 14 different stations.
All haplotypes had a single individual except for Talba_CR4 (5 individuals), Talba_CR8
(2 individuals), Talba_CR14 (15 individuals), Talba_CR18 (2 individuals), and
Talba_CR19 (6 individuals). In most cases, individuals collected from the same site shared
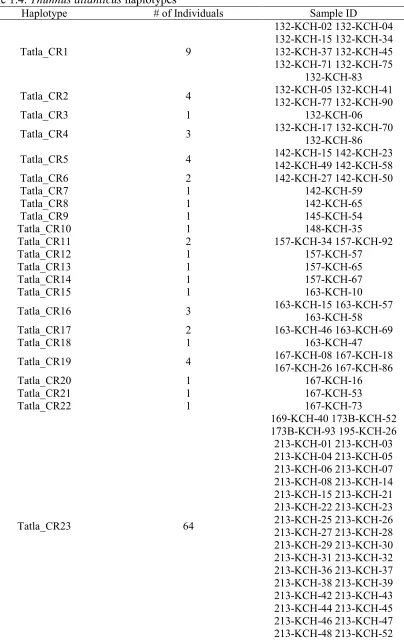
a haplotype (Table 1.3). Sixty-one haplotypes were identified for 188 Thunnus albacares
individuals from a total of 26 stations. Similar to Thunnus albacares, in most cases,
individuals collected from the same site shared a haplotype (Table 1.4). Twelve haplotypes
were identified in 15 Katsuwonus pelamis individuals from a total of five stations. Nine
out of the twelve haplotypes were present in a single individual. Three haplotypes were
16
A total of 405 base pairs (bp) of the nucleotide sequence of the mitochondrial DNA
(mtDNA) control region were determined for 33 bluefin tuna. For all samples, there were
83 polymorphic sites (Table 1.6) that defined 31 haplotypes (h=0.995) and resulted in a
nucleotide diversity ( ) of 2.23% (Table1.7). Haplotypic diversity ranged from a low of
0.993 to a high of 1.00 for individual sites (Table 1.8). A total of 404 bp of the nucleotide
sequence of the mitochondrial DNA (mtDNA) control region were determined for 45
yellowfin tuna. For all samples, there were 75 polymorphic sites (Table 1.9) that defined
20 haplotypes (h=0.288) with a nucleotide diversity ( ) of 1.47% (Table1.7). Haplotypic
diversity for individual sites ranged from 0.125 to 1.00 (Table 1.8). A total of 400 bp of
the nucleotide sequence of the mitochondrial DNA (mtDNA) control region were
determined for 188 blackfin tuna. For all samples, there were 309 polymorphic sites (Table
1.10) that defined 61 haplotypes (h=0.454) and a nucleotide diversity ( ) of 2.26%
(Table1.7). Haplotypic diversity for individual sites ranged from 0.378 to 1.00 (Table 1.8).
A total of 401 bp of the nucleotide sequence of the mitochondrial DNA (mtDNA) control
region was determined for 15 skipjack tuna from five sites. For all samples, there were 71
polymorphic sites (Table 1.11) that defined 12 haplotypes (h=0.946) and a nucleotide
diversity ( ) of 6.41% (Table1.7). Haplotypic diversity was only calculated based on one
site because the other four sites only had a single individual (Table 1.8). Bluefin tuna had
the highest haplotypic diversity followed by skipjack tuna while yellowfin and blackfin
tuna had comparatively lower values of haplotypic diversity. Skipjack tuna had the highest
level of nucleotide diversity being over twice has high as the other three species’.
These patterns of similarities between the species are also reflected in the
17
bluefin tuna and skipjack tuna, while yellowfin and blackfin trees had similar topologies
to each other but not to bluefin tuna and skipjack tuna. The trees for yellowfin and blackfin
tuna contain clades defined primarily by sampling site, with little variation within clades
(Figure 1.5, Figure 1.6). On the other hand, the phylogenetic trees for bluefin tuna and
skipjack tuna contain clades that are not defined primarily by sampling site and contain
considerably higher relative diversity within clade (Figure 1.3, Figure 1.4). When
comparing the haplotypic diversity in the eggs sampled in this study to the haplotypic
diversity of adults sampled in previous studies (Ely et al. 2001, Ely et al. 2005) bluefin
tuna (egg, h=0.995; adult, h=0.997) and skipjack tuna (egg, h= 0.946; adult, h=0.999) had
very high haplotypic diversity at both egg and adult stages (Figure 1.7). However, the
haplotypic diversity of adult yellowfin tuna (h=0.997) is much higher than in eggs
(h=0.289). Previous research has not been conducted on the haplotypic diversity of adult
blackfin tunas, likely because they are not as important commercially and can be hard to
distinguish morphologically from yellowfin tunas. However, based on the similarity of
blackfin and yellowfin tuna it is likely that blackfin tuna may also have a very high
haplotypic diversity in adults compared to the relatively low haplotypic diversity found in
eggs in this study (h=0.454).
An Analysis of Molecular Variance (AMOVA; Excoffier, Smouse, and Quattro
1992) was conducted on bluefin tuna, yellowfin tuna, and blackfin tuna populations to
determine the diversity among versus within populations (sampling sites). An AMOVA
was not run for skipjack tuna because only one site had more than one individual. All
variation in bluefin tuna occurred within populations (100%) (Table 1.12). Yellowfin tuna
18
Blackfin tuna’s variance was distributed more evenly with 51.19% variation among
populations and 48.81% variation within populations (Table 1.14).
1.4 DISCUSSION AND CONCLUSION
The ability to accurately identify eggs of commercially important species is a
critical component of comprehensive fisheries management. This information can be used
to make hindcast predictions about location of spawning grounds, increase our
understanding of reproductive life history, and determine population diversity within
species (Muhling et al. 2011). Despite the myriad of information that eggs can provide,
planktonic surveys of fish eggs are uncommon. This is because eggs are extremely difficult
to identify to species using a purely morphological approach. Fortunately, the advent of
innovative technologies has made it possible to analyze large quantities of eggs in a
relatively rapid and cost-effective manner. To this end, using a plate extraction method,
two-step PCR protocol, and sequencing analyses we have identified the abundance of
Thunnus and Katsuwonus in 12,658 eggs collected from 121 stations in the Gulf of Mexico
during the Spring 2011 NMFS larval fish survey.
Of the 12,658 eggs, there were 38 bluefin (T. thynnus), 49yellowfin (T. albacares),
192 blackfin (T. atlanticus), and 15 skipjack (K. pelamis) present. Overall, there were
2.20% Thunnus and 0.119% Katsuwonus. Bluefin tuna composed 0.3% of the total
population surveyed. These abundance results are consistent with results from the genetic
analysis of eggs from the Gulf of Mexico sampled via CUFES (Continuous Underway Fish
Egg Sampler), in which Thunnus composed a similar percent of the surveyed population
19
The geographic distribution of identified Thunnus eggs is not consistent with the
known spawning biology of tunas. Black and yellowfin tuna are smaller than bluefin and
were believed to spawn in shallower areas; these results are not congruent with this trend
as their eggs were identified in the shallower waters of the continental shelf as well as
deeper waters on and past the slope. Similarly, bluefin tuna tend to be larger and are thought
to spawn in deeper waters (Teo et al. 2007) but in this study, bluefin tuna eggs were found
in the relatively deeper waters of the continental slope, but also in waters on the continental
shelf. Bluefin tuna eggs were found in the western GOM and the frontal zone of the loop
current in the central and eastern GOM. These results are consistent with the results from
prior tagging studies on mature bluefin tuna (Teo et al. 2007). Yellowfin, blackfin, and
skipjack tuna eggs were found to be evenly distributed across the eastern and western Gulf
of Mexico.
Tuna possess a hypervariable mtDNA control region; this region is so variable that
nearly every tuna analyzed at this locus has been genetically unique (Menezes et al.2012;
Wenink et al. 1993). This fact enables us to compare haplotypes of eggs and approximate
how many females are contributing to a given spawning effort. If two eggs have the same
haplotype, then it can be presumed that they derive from the same mother. If two eggs have
different haplotypes, then they have different mothers. Here, haplotype analyses revealed
31 different haplotypes for 33 bluefin tuna from only three sites. This indicates that there
were only two pairs of eggs where each pair was spawned by the same female, while the
rest were all spawned from different females. However, these thirty one individuals all are
likely to have spawned in only three locations. From this we can infer that bluefin tuna
20
tuna showed similar patterns, with twelve haplotypes present for fifteen eggs from five
sites, meaning three sets of eggs shared the same mother, while all other eggs were spawned
from different females. Again, this indicates that females are spawning in aggregations or
are drawn to spawn at the same location. This pattern was more striking in bluefin tuna
than in skipjack possibly due to the patterns of collection because fewer skipjack were
sampled than bluefin overall, but from more sites. Twelve individual eggs were all found
at a single site, with eight different haplotypes. Meaning that eight of the twelve skipjack
tuna females spawning all went to a single site, while the other four females all went to
different sites. Yellowfin and blackfin tuna haplotype analyses support more individualized
spawning patterns. Yellowfin tuna had 20 haplotypes present for 45 eggs from 14 sites,
while blackfin tuna had 61 haplotypes for 188 eggs from 26 sites. For both species, many
eggs with identical haplotypes, indicating a single spawning female, were found at several
sampling sites; indicating that both yellowfin and blackfin tuna spawned more
independently and at a variety of sites than did bluefin and skipjack tunas.
Haplotypic diversity was very high for bluefin tuna (h=0.995) and skipjack tuna
(h=0.946). On the other hand, haplotypic diversity was low for yellowfin tuna (h=0.288)
and blackfin tuna (h=0.454). Haplotype diversity represents the probability that two
randomly sampled alleles are different (Nei 1987). Yellowfin and blackfin tuna had a much
lower haplotypic diversity, meaning that the populations were less diverse than the bluefin
and skipjack tuna populations.
AMOVA estimates population differentiation directly from molecular data
(Excoffier, Smouse, and Quattro 1992). In this study, results from AMOVA analyses
21
sampling sites, while yellowfin and blackfin tuna’s genetic variation existed primarily
among sample sites. High overall variance within populations and low variance among
populations indicates that populations are not homogenous. Alternately, low overall
variance within and high variance among populations would indicate that individual
populations are homogenous, but vary from other populations. This study reveals that
individual bluefin tuna sample sites are not genetically homogenous, while yellowfin and
blackfin tuna populations can be homogenous. The AMOVA results further support that
yellowfin and blackfin tuna spawn independently at multiple sites throughout the GOM,
while bluefin tuna spawn in aggregations at a few sites.
Our results suggest that bluefin tuna spawn in both the eastern and western portions
of the Gulf of Mexico and that, overwhelmingly, genetic variation is concentrated within
sites rather than between, indicating that multiple bluefin tuna females spawn in a given
location. Larvae may be found predominantly in the western GOM due to currents
advecting eggs into the western Gulf where they accumulate due to eddies formed from the
loop current (Muhling, Lamkin, Roffer 2010). This suggests that it is essential to monitor
both eastern and western portions of the GOM. However, because genetic diversity was
found within sites and not among sites, that indicates that there are not two genetically
differentiated spawning populations of bluefin tuna in the eastern vs. western GOM.
This study demonstrates the utility of eggs as a tool for fisheries management. We
successfully genetically analyzed eggs in a rapid and cost-effective manner to estimate
spawning grounds and determine genetic diversity in spawning females. Eggs provide a
more accurate source of spawning ground information than larvae, which are typically used
22
spawning ground locations, they also provide insight into the life history of tunas. For
example, are tunas spawning in aggregations or individually? Our results suggest that
bluefin and skipjack tuna spawn in large aggregations, while yellowfin and blackfin tuna
spawn individually or in small groups. This information is useful to conservation managers
because they can then determine which regions need to be afforded additional protections
during spawning seasons. The methodology developed in this project can easily and
affordably be applied to other commercially important species where reproductive life
histories are poorly understood but where monitoring spawning to calculate spawning stock
23
1.5 TABLES AND FIGURES
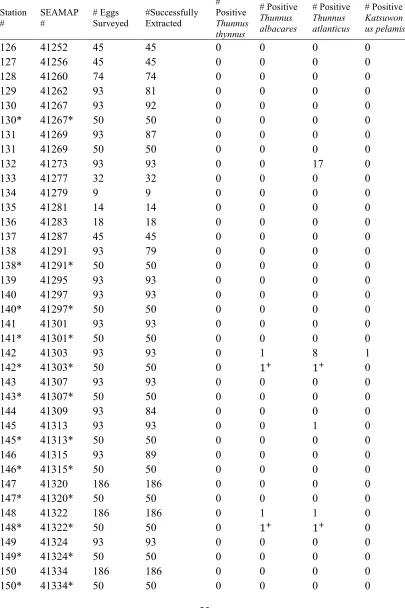
Table 1.1.Sampling stations, counts of eggs sampled via Spanish neuston nets during the Spring 2011 NMFS larval fish cruise, counts of positive Thunnus and
Katsuwonus identified by DNA sequence analysis.
Station # SEAMAP # # Eggs Surveyed #Successfully Extracted # Positive Thunnus thynnus # Positive Thunnus albacares # Positive Thunnus atlanticus # Positive Katsuwon us pelamis
126 41252 45 45 0 0 0 0
127 41256 45 45 0 0 0 0
128 41260 74 74 0 0 0 0
129 41262 93 81 0 0 0 0
130 41267 93 92 0 0 0 0
130* 41267* 50 50 0 0 0 0
131 41269 93 87 0 0 0 0
131 41269 50 50 0 0 0 0
132 41273 93 93 0 0 17 0
133 41277 32 32 0 0 0 0
134 41279 9 9 0 0 0 0
135 41281 14 14 0 0 0 0
136 41283 18 18 0 0 0 0
137 41287 45 45 0 0 0 0
138 41291 93 79 0 0 0 0
138* 41291* 50 50 0 0 0 0
139 41295 93 93 0 0 0 0
140 41297 93 93 0 0 0 0
140* 41297* 50 50 0 0 0 0
141 41301 93 93 0 0 0 0
141* 41301* 50 50 0 0 0 0
142 41303 93 93 0 1 8 1
142* 41303* 50 50 0 1 1 0
143 41307 93 93 0 0 0 0
143* 41307* 50 50 0 0 0 0
144 41309 93 84 0 0 0 0
145 41313 93 93 0 0 1 0
145* 41313* 50 50 0 0 0 0
146 41315 93 89 0 0 0 0
146* 41315* 50 50 0 0 0 0
147 41320 186 186 0 0 0 0
147* 41320* 50 50 0 0 0 0
148 41322 186 186 0 1 1 0
148* 41322* 50 50 0 1 1 0
149 41324 93 93 0 0 0 0
149* 41324* 50 50 0 0 0 0
150 41334 186 186 0 0 0 0
24
151 41336 93 93 0 0 0 0
152 41338 93 93 0 1 0 0
152* 41338* 50 50 0 0 0 0
153 41342 48 48 0 0 0 0
154 41344 48 48 1 0 0 0
155 41347 186 186 0 0 0 0
155 41347 50 50 0 0 0 0
156 41351 186 186 0 0 0 0
156 41351 50 50 0 0 0 0
157 41353 186 186 0 7 5 0
157* 41353* 50 50 0 1 1 0
159 41356 186 186 0 0 0 0
159 41356 50 50 0 0 0 0
161 41361 93 93 0 0 0 0
161* 41361* 50 50 1* 0 0 0
162 41363 93 93 0 0 0 0
163 41368 93 93 0 1 7 0
163* 41368* 50 50 0 0 0 0
164 41369 48 48 0 0 0 0
165 41374 93 93 0 0 0 0
165* 41374* 50 50 0 0 0 0
166 41380 10 10 0 0 0 0
167 41385 93 93 0 3 7 11
167* 41385* 50 50 0 0 0 0
168 41386 93 93 0 1 0 0
168* 41386* 50 50 1* 0 0 0
169 41391 93 90 0 0 2 0
169* 41391* 50 50 1* 0 0 0
170 41395 93 93 0 0 1 0
170* 41395* 50 50 0 0 0 0
171 41397 93 93 0 0 0 0
171* 41397* 50 50 0 0 0 0
172 41401 93 93 0 0 0 0
172* 41401* 50 50 0 0 0 0
173A 41403 93 93 0 0 0 0
173A
* 41403* 50 50 1* 1 1 0
173B 41409 93 93 0 0 4 0
173B* 41409* 50 50 1* 0 0 0
173C 41410 69 67 0 0 0 0
173C* 41410* 50 50 0 0 0 0
173D 41411 93 93 0 0 2 0
173D
* 41411* 50 50 0 0 0 0
25
173E* 41412* 50 50 0 0 0 0
174 41416 93 93 0 0 0 0
174* 41416* 50 50 0 0 0 0
175 41418 93 93 0 0 0 0
175* 41418* 50 50 0 0 0 0
176 41422 93 93 0 0 0 0
176* 41422* 50 50 0 0 0 0
177 41424 93 93 0 0 0 0
177* 41424* 50 50 0 0 0 0
178 41428 93 93 0 0 0 0
178* 41428* 50 50 0 0 0 0
179 41430 93 91 0 0 0 0
179* 41430* 50 50 0 0 0 0
180 41434 93 93 0 3 8 0
180* 41434* 50 50 0 0 0 0
181 41436 93 93 0 0 0 0
181* 41436* 50 50 0 0 0 0
182 41440 93 93 0 0 0 0
182* 41440* 50 50 0 0 0 0
183 41442 93 92 0 0 0 0
184 41446 93 93 0 0 1 0
184* 41446* 50 50 0 0 0 0
185A 41448 38 38 0 0 0 0
185B 41449 29 29 0 0 0 0
185C 41450 25 25 0 0 0 0
185D 41451 24 24 0 0 0 0
185E 41452 50 50 0 0 0 0
186 41456 93 93 0 0 0 0
187 41458 93 93 0 16 0 1
187* 41458* 50 50 0 0 0 0
188 41462 93 93 0 0 0 0
188* 41462* 50 50 0 0 0 0
189A 41464 93 93 0 0 0 0
189A
* 41464* 50 50 0 0 0 0
189B 41465 93 93 0 1 6 1
189B* 41465* 50 50 0 0 0 0
189C 41466 21 21 0 0 0 0
189C* 41466* 50 50 0 0 0 0
189D 41467 93 93 0 0 2 0
189E 41468 48 48 0 0 4 0
189F 41469 93 93 0 0 0 0
189F* 41469* 50 50 0 0 0 0
26 190A
* 41471* 50 50 0 0 0 0
190C 41473 21 21 0 0 0 0
190D 41474 57 57 0 0 0 0
190D
* 41474* 50 50 0 0 0 0
190E 41475 45 45 0 0 3 0
190E* 41475* 50 50 0 0 0 0
191 41479 22 22 0 0 0 0
192 41481 93 93 0 1 8 0
192* 41481* 50 50 0 0 0 0
193 41485 32 30 0 0 1 0
194 41487 50 50 0 0 0 0
194* 41487* 50 50 0 0 0 0
195 41491 29 28 0 0 1 0
196 41493 93 93 0 0 0 0
196* 41493* 50 50 0 0 0 0
197A 41497 49 49 0 0 10 0
197B 41499 45 45 0 0 0 0
199 41503 21 21 0 0 0 0
200 41505 45 45 0 0 0 0
201 41509 93 93 0 0 17 0
201* 41509* 50 50 0 0 0 0
202 41516 93 93 0 0 10 1
203 41525 93 93 0 0 0 0
203* 41525* 50 50 0 0 0 0
204 41532 93 91 0 0 0 0
204* 41532* 50 50 0 0 0 0
205 41536 22 22 0 0 0 0
206 41537 93 93 0 2 0 0
206* 41537* 50 50 0 0 0 0
207 41539 93 93 0 6 0 0
207* 41539* 50 50 0 0 0 0
208 41540 93 93 0 0 1 0
209 41541 31 31 0 0 0 0
210 41545 6 6 0 0 0 0
211 41547 34 34 0 0 0 0
212 41551 38 38 0 0 0 0
213 41553 93 93 0 0 60 0
214 41557 48 48 0 0 0 0
215 41559 45 45 0 0 0 0
216 41563 12 12 0 0 0 0
217 41565 27 27 0 0 0 0
218 41567 45 45 0 0 0 0
27
220 41575 60 60 0 0 0 0
221 41577 45 45 0 0 0 0
222 41581 93 93 0 0 0 0
222* 41581* 50 50 0 0 0 0
223 41585 93 90 0 0 0 0
224 41586 93 93 0 0 0 0
224* 41586* 50 50 0 0 0 0
225 41592 93 92 0 0 0 0
225* 41592* 50 50 0 0 0 0
226 41593 93 93 24 0 0 0
226* 41593* 50 50 0 0 0 0
227 41597 93 93 8 0 0 0
227* 41597* 50 50 0 0 0 0
228 41598 93 90 0 0 0 0
228* 41598* 50 50 0 0 0 0
229 41604 93 89 0 0 0 0
229* 41604* 50 50 0 0 0 0
230 41608 93 92 0 1 0 0
230* 41608* 50 50 0 0 0 0
231 41609 93 93 0 0 0 0
231* 41609* 50 50 0 0 0 0
28
Table 1.2. Thunnus thynnus haplotypes
Haplotype # of Individuals Sample ID
Tthy_CR1 1 154-KCH-44
Tthy_CR2 2 226-KCH-01, 226-KCH-05
Tthy_CR3 1 226-KCH-02
Tthy_CR4 2 226-KCH-03
Tthy_CR5 1 226-KCH-04, 226-KCH-28
Tthy_CR6 1 226-KCH-06
Tthy_CR7 1 226-KCH-07
Tthy_CR8 1 226-KCH-08
Tthy_CR9 1 226-KCH-09
Tthy_CR10 1 226-KCH-17
Tthy_CR11 1 226-KCH-20
Tthy_CR12 1 226-KCH-25
Tthy_CR13 1 226-KCH-28
Tthy_CR14 1 226-KCH-48
Tthy_CR15 1 226-KCH-54
Tthy_CR16 1 226-KCH-60
Tthy_CR17 1 226-KCH-62
Tthy_CR18 1 226-KCH-64
Tthy_CR19 1 22 s6-KCH-72
Tthy_CR20 1 226-KCH-77
Tthy_CR21 1 226-KCH-79
Tthy_CR22 1 226-KCH-88
Tthy_CR23 1 226-KCH-89
Tthy_CR24 1 226-KCH-93
Tthy_CR25 1 227-KCH-20
Tthy_CR26 1 227-KCH-22
Tthy_CR27 1 227-KCH-26
Tthy_CR28 1 227-KCH-39
Tthy_CR29 1 227-KCH-47
Tthy_CR30 1 227-KCH-48
Tthy_CR31 1 227-KCH-66
29
Table 1.3. Thunnus albacares haplotypes
Haplotype # of Individuals Sample ID
Talba_CR1 1 142-KCH-18
Talba_CR2 1 148-KCH-03
Talba_CR3 1 152-KCH-81
Talba_CR4 5
157-KCH-09, 157-KCH-35, 157-KCH-59, 157-KCH-73,
157-KCH-87
Talba_CR5 1 157-KCH-72
Talba_CR6 1 157-KCH-84
Talba_CR7 1 163-KCH-38
Talba_CR8 2 167-KCH-12, 167-KCH-45
Talba_CR9 1 167-KCH-40
Talba_CR10 1 168-KCH-48
Talba_CR11 1 180-KCH-01
Talba_CR12 1 180-KCH-63
Talba_CR13 1 180-KCH-77
Talba_CR14 15
187-KCH-01, 187-KCH-05, 187-KCH-08, 187-KCH-11, 187-KCH-14, 187-KCH-23, 187-KCH-24, 187-KCH-25, 187-KCH-26, 187-KCH-40, 187-KCH-46, 187-KCH-63, 187-KCH-65, 187-KCH-68, 187-KCH-71
Talba_CR15 1 187-KCH-53
Talba_CR16 1 189B-KCH-61
Talba_CR17 1 192-KCH-56
Talba_CR18 2 206-KCH-02, 206-KCH-64
Talba_CR19 6
207-KCH-11, 207-KCH-26, 207-KCH-33, 207-KCH-51, 207-KCH-91, 207-KCH-93
Talba_CR20 1 230-KCH-44
30
Table 1.4. Thunnus atlanticus haplotypes
Haplotype # of Individuals Sample ID
Tatla_CR1 9
132-KCH-02 132-KCH-04 132-KCH-15 132-KCH-34 132-KCH-37 132-KCH-45 132-KCH-71 132-KCH-75
132-KCH-83
Tatla_CR2 4 132-KCH-05 132-KCH-41
132-KCH-77 132-KCH-90
Tatla_CR3 1 132-KCH-06
Tatla_CR4 3 132-KCH-17 132-KCH-70
132-KCH-86
Tatla_CR5 4 142-KCH-15 142-KCH-23
142-KCH-49 142-KCH-58
Tatla_CR6 2 142-KCH-27 142-KCH-50
Tatla_CR7 1 142-KCH-59
Tatla_CR8 1 142-KCH-65
Tatla_CR9 1 145-KCH-54
Tatla_CR10 1 148-KCH-35
Tatla_CR11 2 157-KCH-34 157-KCH-92
Tatla_CR12 1 157-KCH-57
Tatla_CR13 1 157-KCH-65
Tatla_CR14 1 157-KCH-67
Tatla_CR15 1 163-KCH-10
Tatla_CR16 3 163-KCH-15 163-KCH-57
163-KCH-58
Tatla_CR17 2 163-KCH-46 163-KCH-69
Tatla_CR18 1 163-KCH-47
Tatla_CR19 4 167-KCH-08 167-KCH-18
167-KCH-26 167-KCH-86
Tatla_CR20 1 167-KCH-16
Tatla_CR21 1 167-KCH-53
Tatla_CR22 1 167-KCH-73
Tatla_CR23 64
31 213-KCH-53 213-KCH-54 213-KCH-55 213-KCH-58 213-KCH-61 213-KCH-62 213-KCH-67 213-KCH-68 213-KCH-69 213-KCH-70 213-KCH-74 213-KCH-75 213-KCH-76 213-KCH-77 213-KCH-78 213-KCH-81 213-KCH-82 213-KCH-83 213-KCH-84 213-KCH-85 213-KCH-86 213-KCH-87 213-KCH-88 213-KCH-89 213-KCH-90 213-KCH-91 213-KCH-92 213-KCH-93
Tatla_CR24 1 169-KCH-44
Tatla_CR25 1 170-KCH-23
Tatla_CR26 2 50
173B-KCH-73
Tatla_CR27 1 173D-KCH-03
Tatla_CR28 1 173D-KCH-04
Tatla_CR29 2 50
173B-KCH-73
Tatla_CR30 1 180-KCH-31
Tatla_CR31 1 180-KCH-51
Tatla_CR32 1 180-KCH-59
Tatla_CR33 1 180-KCH-67
Tatla_CR34 1 180-KCH-75
Tatla_CR35 1 180-KCH-93
Tatla_CR36 1 184-KCH-84
Tatla_CR37 2 19
189B-KCH-69
Tatla_CR38 1 189B-KCH-34
Tatla_CR39 2 50
189B-KCH-53
Tatla_CR40 1 189B-KCH-64
Tatla_CR41 1 189D-KCH-39
Tatla_CR42 1 189D-KCH-59
Tatla_CR43 2 14
189E-KCH-36]
Tatla_CR44 2 16
189E-KCH-37]
Tatla_CR45 1 190E-KCH-78
Tatla_CR46 1 190E-KCH-82
Tatla_CR47 1 190E-KCH-87
Tatla_CR48 1 192-KCH-02
Tatla_CR49 1 192-KCH-06
Tatla_CR50 6
192-KCH-22 192-KCH-46 192-KCH-48 192-KCH-51 192-KCH-66 192-KCH-88
32
Tatla_CR52 3 09
197A-KCH-26 197A-KCH-33
Tatla_CR53 6
19 KCH-20 KCH-22
197A-KCH-25 197A-KCH-30 197A-KCH-35
Tatla_CR54 1 197A-KCH-23
Tatla_CR55 10
201-KCH-06 201-KCH-14 201-KCH-21 201-KCH-24 201-KCH-26 201-KCH-27 201-KCH-34 201-KCH-67 201-KCH-70 201-KCH-76
Tatla_CR56 7
201-KCH-31 201-KCH-46 201-KCH-50 201-KCH-59 201-KCH-84 201-KCH-89
201-KCH-90
Tatla_CR57 8
202-KCH-07 202-KCH-16 202-KCH-43 202-KCH-46 202-KCH-53 202-KCH-59 202-KCH-70 202-KCH-76
Tatla_CR58 1 202-KCH-54
Tatla_CR59 1 202-KCH-67
Tatla_CR60 1 208-KCH-60
Tatla_CR61 1 219-KCH-33
TOTAL 188
Table 1.5. Katsuwonus pelamis haplotypes
Haplotype # of Individuals Sample
Kpela_CR1 1 142-KCH-86
Kpela_CR2 2 167-KCH-07, 167-KCH-78
Kpela_CR3 2 167-KCH-10, 167-KCH-13
Kpela_CR4 2 167-KCH-11, 167-KCH-39
Kpela_CR5 1 167-KCH-14
Kpela_CR6 1 167-KCH-15
Kpela_CR7 1 167-KCH-17
Kpela_CR8 1 167-KCH-54
Kpela_CR9 1 167-KCH-56
Kpela_CR10 1 187-KCH-57
Kpela_CR11 1 189B-KCH-43
Kpela_CR12 1 202-KCH-82
3
3
Table 1.6. Mitochondrial DNA control region haplotypes of bluefin tuna (Thunnus thynnus) observed in this study. Dots indicate identity to the reference sequence (haplotype Tthy_1) and dashes indicate insertion/deletion events. For clarity, only variable sites are shown; numbered positions are relative to haplotype Tthy_1.
Haplotype Position Site 154 226 227 11111111111111112222222222222222222222233333333333
22346889900124566667999990000011111224455778999900001277899 26313120108004404786234590357912349355656143146715672378117
Tthy_1 C-GCATTAGTTTTTCTTATACAAAACCAATATATTGCCCATCTTTGCACAACGGTATAA 1
Tthy_2 .T...C...C...C...A... 2 Tthy_3 ...C...T...GT...C...A...T... 1 Tthy_4 ...T...G...C...C...A... 1 Tthy_5 ...C...G...C...C... 2 Tthy_6 ...T...T... 1 Tthy_7 ...G.G...C...C... 1 Tthy_8 ...A...C... 1 Tthy _9 ...GG...CT..A...A... 1 Tthy _10 ...C...C..A...C... 1 Tthy _11 ...C..CC.C...T...C...C... 1 Tthy _12 ...C...GG...TC...A...G. 1 Tthy _13 ...G....C...T...C...C.... 1 Tthy _14 ...T...T...T...G....C... 1 Tthy _15 ...C...C...C..C...G...T...G... 1 Tthy _16 ...C...CC... 1 Tthy _17 ...C...GT...C..AT...A...T... 1 Tthy _18 ...G...C... 1 Tthy _19 ...C..C...C..A...C... 1 Tthy _20 ....G..G....C....G...T...C... 1 Tthy _21 ...C...T...G...G...C...C.G 1 Tthy _22 T...A...CC...G...G. 1 Tthy _23 ...C...C.CT...T...C...G... 1 Tthy _24 ...G..G.C...G. 1
3
4
Table 1.7. Summary of the mean statistics for the mtDNA control region (dloop) of Thunnus thynnus, Thunnus albacares, Thunnus atlanticus, and Katsuwonus pelamis.
Species N # Haplotypes h # polymorphic
sites FST Tajima's D
Thunnus thynnus 33 31 0.995 83 0.022 -0.017 -1.441
Thunnus albacares 45 20 0.288 75 0.015 0.752 -0.416
Thunnus atlanticus 188 61 0.454 309 0.026 0.512 0.477
Katsuwonus pelamis 15 12 0.946 71 0.064 -- 0.317
N, Number of sequences; h, haplotypic diversity; , nucleotide diversity
3
5
Table 1.8.Summary of the statistics for the mtDNA control region (dloop) of Thunnus thynnus, Thunnus albacares, Thunnus atlanticus, and Katsuwonus pelamis.
Species Site N # Haplotypes h # polymorphic sites Tajima's
D
Thunnus thynnus 226 25 23 0.993 (±0.0134) 0.020 (±0.0105) 51 -1.584
227 7 7 1.00 (±0.0764) 0.025 (±0.0149) 32 -1.298
Thunnus albacares 157 7 3 0.524 (±0.2086) 0.024 (±0.0145) 25 -0.219
167 3 2 0.667 (±0.3143) 0.030 (±0.0232) 18 0
180 3 3 1.00 (±0.02322) 0.030 (±0.0232) 18 0
187 16 2 0.125 (±0.1064) 0.004 (±0.0030) 14 -2.276
206 2 1 0 0 0 0
207 6 1 0 0 0 0
Thunnus atlanticus 132 17 4 0.669 (±0.0913) 0.029 (±0.0153) 30 1.185
142 9 5 0.806 (±0.1196) 0.020 (±0.0118) 21 0.245
157 5 4 0.900 (±0.1610) 0.025 (±0.0159) 20 0.154
163 7 4 0.810 (±0.1298) 0.026 (±0.0156) 24 0.366
167 7 4 0.714 (±0.1809) 0.021 (±0.0128) 22 0.250
213 64 1 0 0 0 0
173B 4 2 0.667 (±0.2041) 0.020 (±0.0141) 12 2.233
173D 2 2 1.00 (±0.500) 0.035 (±0.0363) 14 0
180 6 6 1.00 (±0.0962) 0.032 (±0.0193) 33 -0.761
189B 6 4 0.867 (±0.1291) 0.026 (±0.0161) 23 0.245
189D 2 2 1.00 (±0.500) 0.038 (±0.0387) 15 0
189E 4 2 0.667 (±0.2041) 0.020 (±0.0141) 12 2.233
190E 3 3 1.00 (±0.2722) 0.023 (±0.0185) 14 0
192 8 3 0.464 (±0.200) 0.019 (±0.0110) 23 -0.827
197A 10 3 0.600 (±0.1305) 0.013 (±0.00779) 11 1.511
201 17 2 0.515 (±0.0592) 0.023 (±0.0126) 18 2.902
202 10 3 0.378 (±0.1813) 0.011 (±0.0068) 17 -1.119
Katsuwonus pelamis 167 11 8 0.946 (±0.0535) 0.064 (±0.0346) 71 0.317
3
6
Table 1.9. Mitochondrial DNA control region haplotypes of yellowfin tuna (Thunnus albacares) observed in this study. Dots indicate identity to the reference sequence (haplotype Talba_1) and dashes indicate insertion/deletion events. For clarity, only variable sites are shown; numbered positions are relative to haplotype Talba_1.
Haplotype Position Site
1 1 1 1 1 1 1 1 1 1 1 2 2 2 4 4 5 5 6 6 6 8 8 8 9 0 0 3 2 8 2 7 3 7 8 0 7 9 2 6 7 0
111111111111111122222222222222222222222222333333333333333
268888899123456667779999900001112234445555677789999000234566779999
520123909965383789046234502591230143450356001353679026221101570245
Talba_1 CACTCTCGTTTTCGTCCATGTAAATCTCCATCAAGCCCCAACATTTTAGTAACCGATTTGAAAATT 1 Talba_2 ...C... 1
Talba_3 ...AA...A..C...CG...TT...G.T...GA... 1
Talba_4 ...A.C....C...G...TT....C....A...T...G..C 5
Talba_5 T....A.A...C.A...G....T...G...T.C...CCC...GTT.C...G..C. 1
Talba_6 T....A...C.A...C.G...C....T.TTC...CC.A..C.GTTAC...G..C. 1
Talba_7 T....A...C.A...G....T..C...TTTC...CC...GTT.C...G..C. 1
Talba_8 .GT...G....CT.CT...A...CT....G....TT.C...GA...C...C. 2
Talba_9 ...A.T.C...T...TG....TTG.T...A...T... 1
Talba_10 ...A.T.C...T...TG....TTG.T...A...T...GG.... 1
Talba_11 ...C...T.C...G...TTG..G...A...T... 1
Talba_12 ...A.C....C...C...G...TT....C....A...T...GGCC 1
Talba_13 ...C..A...T.CT...A.C...TT...A... 1
Talba_14 ....T...C...T...C...GA..TTG...A...T... 15
Talba_15 ...T...C...G...T...C... 1
Talba_16 ...C...T.C...T...C.A...C...G...C 1
Talba_17 T.A..A...C.AG....GG...T..C...TTT...CC.C....GTT.C...G..C. 1
Talba_18 ...A...AC.A...T....T...TTC...CC...T.C...G..C. 2
Talba_19 T....A.A...C.A...G....T...G...T.C...CC...GTT.C...G..C. 6
3
7
Table 1.10. Mitochondrial DNA control region haplotypes of blackfin tuna (Thunnus atlanticus) observed in this study. Dots indicate identity to the reference sequence (haplotype Tatla_1) and dashes indicate insertion/deletion events. For clarity, only variable sites are shown; numbered positions are relative to haplotype Tatla_1.
Haplotype Position Site
1 1 1 1 1 1 1 1 1 1 1 1 1 1 1 1 1 1 1 1 2 2 2 2 2 3 4 4 4 5 6 6 6 7 7 7 8 8 8 8 8 9 9 9 9 0 0 0 1 1 2 2 5 8 7 3 7 9 0 3 3 0 4 9 9 9 0 2 3 7 1 2 8 3 9 B D B D E E A
111111111111111111111222222222222222222222222222222222333333333333333
1234567888999013456666777899999999000000001112222233445555678899999000000225778999
9120090012027795383789069312345789013457890120168904570123721601467013478362781156
Tatla_1 TCACAATCTCGCTCTTCACCCATTAACAGACTATCTAACCTCAACAATAGAGTCTAAA-TTCTCGAAAACACTGTCCATATC 9 Tatla_2 ...G.A...C....A.T...G.T.T..T....A...A....-..TCTA...GT.T...TT... 4
Tatla_3 ..G...A...G.A...CG...A.T...G.T.T...GA...A....-C.TC.A....T...TT..G.. 1
Tatla_4 .T...C...C..G...A.T...GT....A...-..T..A....T...TT... 3
Tatla_5 ...G.A...T.A.T..CT....T.T.G...AG..A....-..TCTA...TT... 4
Tatla_6 ...G.A...A.TC...T.T..T.G..A...AC..G-..TCTA....T.T...TT... 2
Tatla_7 ...G.A...C....A.T...T.T...A...A....-..TCTA...GT.T...TT... 1
Tatla_8 ...G.A...A.T...T.GT....A...A....-...CTA....T.T...TT... 1
Tatla_9 ...G.A...A.T...T...A...A..G.-..TC.A..GGT...TT.C... 1
Tatla_10 ...G.A...GA.T...T.T.GT....A..CA.-..-..TC.A....T...TT... 1
Tatla_11 ...G.AT...A.T...TGGT....A...A....-..TCTA....T.T...TT... 2
Tatla_12 ...G.A...T..C...T.T...A...-..A..A..G.T...TT...C. 1
Tatla_13 ...A...G.A..C..G..A.T...T..TG...A...A....-..T..A....T...TT... 1
Tatla_14 ...T...G.A...C....A.T...TT.T..T....A...A....-..TCTA....T.T...TT... 1
Tatla_15 ...G...T...T....T....A....C...-..T.TA....T....CTT..G.. 1
Tatla_16 ...A...T...T...G...A...T....-..T..A.G..T...TT....T 3
Tatla_17 ...A...G.A...A.T...AC...T.T...G...A...-..TC.AG...T...TT... 2
Tatla_18 ...G.A...G..A.T...T.T.G...A...A....-..TC.A..G.T...A.T...GC. 1
Tatla_19 ...G.A...A.T...T.T.G...A...A....-...CTA....T.T...TT... 4
Tatla_20 ...G.A...G..T.GC...TCT.GT.G..A...-..A..A..G.T...TT...C. 1
Tatla_21 ...T...AGTA...A.T..C...T.T..T....A...-..A..A..G.T...TT...C. 1
Tatla_22 ...G.A...T.A.T..C...TCT.G...A...A.-..-...C.A...TT....T 1
Tatla_23 ...G.A...A.T..C...T.T.GT....A...A.-..-..TC.A...TT... 1 53
Tatla_24 ...GTA...T.A.T..CT....T.T.G...AG..A....-..TC.A...TT..G.. 1
Tatla_25 ...G.A...T..C...TCT...A...G....-..A..A..G.T...TT...C. 1
Tatla_26 ...G.A...A.T..C...T...GT....A...A.-..-..TC.A...TT... 2