Note. This article will be published in a forthcoming issue of the
International Journal of Sports Physiology and Performance. The
article appears here in its accepted, peer-reviewed form, as it was
provided by the submitting author. It has not been copyedited,
proofread, or formatted by the publisher.
Section: Original Investigation
Article Title: The Fit Matters: Influence of Accelerometer Fitting and Training Drill Demands on Load Measures in Rugby League Players
Authors: Blake D. McLean,1,2 Cloe Cummins,3 Greta Conlan 2,4 Grant Duthie5 and Aaron J.
Coutts6
Affiliations: 1Performance Science Department, Oklahoma City Thunder, Oklahoma City,
OK. 2School of Exercise Science, Australian Catholic University, Melbourne, Australia.
3School of Science and Technology, University of New England, Armidale, NSW, Australia.
4Physical Performance Department, Wests Tigers Rugby League Football Club, Sydney,
Australia. 5School of Exercise Science, Australian Catholic University, Strathfield, Australia.
6Sport & Exercise Discipline Group, University of Technology Sydney, Sydney, Australia.
Journal: International Journal of Sports Physiology and Performance
Acceptance Date: February 4, 2018
©2018 Human Kinetics, Inc.
Title: The fit matters: influence of accelerometer fitting and training drill demands on load
measures in rugby league players
Submission type: Original investigation
Authors: Blake D. McLean,1,2 Cloe Cummins,3 Greta Conlan 2,4 Grant Duthie5 and Aaron J.
Coutts6
(1) Performance Science Department, Oklahoma City Thunder, Oklahoma City, USA
(2) School of Exercise Science, Australian Catholic University, Melbourne, Australia
(3) School of Science and Technology, University of New England, Armidale, NSW,
Australia
(4) Physical Performance Department, Wests Tigers Rugby League Football Club, Sydney,
Australia
(5) School of Exercise Science, Australian Catholic University, Strathfield, Australia
(6) Sport & Exercise Discipline Group, University of Technology Sydney, Sydney, Australia
Running head: Influence of accelerometer fitting on load measures
Corresponding author: Blake McLean
Address: 9600 N Oklahoma Ave Oklahoma City
Oklahoma, USA, 73114 Telephone: +1 405 215 4488
E-mail: [email protected]
Abstract word count: 252
Text only word count: 3,909
Number of figures and tables: 6
This manuscript has been read and approved by all the listed co-authors and the authors declare no potential conflicts of interest
Abstract
PURPOSE: Determine the relationship between drill type and accelerometer-derived loads
during various team sport activities, and examine the influence of unit fitting on these loads.
METHODS: Sixteen rugby league players were fitted with microtechnology devices in either
manufacturer vests or playing jerseys before completing standardised running, agility and
tackling drills. Two-dimensional (2D) and three-dimensional (3D) accelerometer loads
(BodyLoadTM) per km were compared across drills and fittings (i.e. vest and jersey).
RESULTS: When fitted in a vest, 2D BodyLoadTM was higher during tackling (21.5±14.8
AU/km) compared with running (9.5±2.5 AU/km) and agility (10.3±2.7 AU/km). Jersey fitting
resulted in more than two-fold higher BodyLoadTM during running (2D 9.5±2.7 vs 29.3±14.8
AU/km; 3D 48.5±14.8 vs 111.5±45.4) and agility (2D 10.3±2.7 vs 21.0±8.1 AU/km; 3D
40.4±13.6 vs 77.7±26.8 AU/km), compared with a vest fitting. Jersey fitting also produced
higher BodyLoadTM during tackling drills (2D = 21.5±14.8 vs 27.8±18.6 AU/km; 3D =
42.0±21.4 vs 63.2±33.1 AU/km). CONCLUSIONS: This study provides evidence supporting
the construct validity of 2D BodyLoadTM for assessing collision/tackling load in rugby league
training drills. Conversely, the large values obtained from 3D BodyLoadTM (which includes
the vertical load vector) appear to mask small increases in load during tackling drills, rendering
3D BodyLoadTM insensitive to changes in contact load. Unit fitting has a large influence on
accumulated accelerometer loads during all drills, which is likely related to greater incidental
unit movement when units are fitted in jerseys. Therefore, it is recommended that athletes wear
microtechnology units in manufacturer provided vests to provide valid and reliable
information.
Introduction
Global Positioning Systems (GPS), that are embedded into microtechnology devices,
have previously been shown to be reliable for measuring the activity profiles of field-based
team sport athletes.1 In addition to GPS data, these microtechnology devices contain
accelerometers which provide information on the three-dimensional (3D) forces applied to the
device. Accelerometer-derived loads have been shown to display acceptable inter-unit
reliability (CV = 1.9%) during team sport matches2 and moderate to high test-retest reliability
(CV = 5.9%) during treadmill running activities, with stronger reliability displayed at faster
running speeds.3 Furthermore, very strong to nearly perfect within-individual correlations have
been shown for accelerometer loads and average heart rate (R = 0.98) and VO2 (R = 0.92)
during treadmill running.3 As such, it has been suggested that accelerometers can provide an
overall external load measure in team sports by quantifying accelerations, decelerations,
changes in direction and impacts.4 Currently there is a lack of research examining
accelerometer-derived load measures across a range of different collision-based sport
activities.
The use of microtechnology devices in the quantification of team-sport activities has
increased recently,5,6 however, much of the research focus has been directed towards
GPS-derived variables (e.g. distance, high-speed running, accelerations, and decelerations). While
these measures are useful for quantifying gross locomotor activities, other technical
movements such as tackling, changes of direction and getting up and down from the ground
occur with limited player displacement and may not be quantified by GPS technology, although
these actions may also be energetically demanding. Accelerometers may provide additional
information on these smaller movements, which are not detected from GPS velocity. However,
any microtechnology (i.e. GPS and/or accelerometer) variable is limited to measuring
movement, and is therefore incapable of quantifying work when the body is stationary or not
moving (i.e. static work such as isometric contractions). Despite the seemingly insurmountable
limitation of microtechnology not being able to measure static work, some quantification of
collision/contact demands is particularly important for practitioners working in rugby league,
as these athletes may be involved in up to one collision per minute during match play and an
average of 20 collisions per training session.7
While the majority of commercially available microtechnology devices contain GPS
technology, most also include accelerometers, which usually sample at a frequency of 100 Hz.
The accelerometers contained in these commercial devices have been suggested as a valid tool
to quantify gravitational forces (g) resulting from accelerations, decelerations, changes of
direction and impacts.4,8 Indeed, previous research has shown strong correlations between
session rating of perceived exertion loads and accelerometer-derived training loads per minute
(r = 0.57) in professional rugby league players.4 Others have described a significant relationship
between total distance covered and accumulated accelerometer load (R2 = 0.90) in Australian
Football,9 suggesting that accumulated accelerometer load may be an alternate measure of
overall external work in team sports. However, to date no studies have specifically examined
accelerometer loads during different collision sport training modalities (e.g. running/agility vs.
match simulation and tackling drills).
Accelerometer-derived loads are often calculated using a summation of load vectors in
three dimensions [mediolateral (x), anteroposterior (y), and vertical (z)].2 During
jogging/running activities, the vertical component of this load calculation accounts for 50-60%
of the overall 3D load.3 Therefore, it is likely that 3D loads are strongly influenced by the
distance covered during team sport training/matches. Conversely, the mediolateral and
anteroposterior vectors account for only 20-25% each of the 3D load calculated during
jogging/running.3 Pilot data collected from our laboratory suggests that load accumulated in
the mediolateral and anteroposterior vectors increases greatly during training drills that involve
large amounts of contact (e.g. tackles, ground contacts) and change of direction. Further
understanding of how accelerometers (particularly in the absence of gyroscope data) may be
used to quantify collision load, including the magnitude of impacts and accumulation of total
load (opposed to collision counts), may provide an additional tool for the quantification of
collision demands in team sport. The differences between accumulated accelerometer loads,
including the contribution of x, y and z vectors, during different team sport activities is
currently not clearly understood.
Due to the high sample rate of accelerometer-derived data, the fitting of
microtechnology units may impact the accuracy of data obtained. Indeed, poorly fitted units
may increase incidental unit movement, resulting in increased variability and decreased
sensitivity of accelerometer-derived variables. Previous studies that have reported on the
reliability of accelerometer load measures during laboratory3 or field2 settings have all fitted
units within customised vests, which are tightly fitted to the athletes to minimise incidental unit
movement and enhance reliability. Similar fitted vests are provided by manufacturers with
microtechnology units and are commonly worn by team sport athletes during training activities.
However, many teams/athletes now also use custom built pockets in playing and/or training
uniforms,10 which are inserted during the manufacturing process. When using such pockets,
the fit of the microtechnology unit is dependent on the fit of the training/playing uniform, which
may vary depending on materials, apparel manufacturer, sizing specifications and athlete
preferences regarding fitting size.
The aims of this study were to: 1) determine the relationship between drill type (i.e.
physical output) and accelerometer loads [two-dimensional (2D) and 3D] during various team
sport activities, and 2) examine the influence of unit fitting (custom vest vs. playing jumper)
on accelerometer-derived loads during team sport activity.
Methods
Participants
Sixteen rugby league players [19.7 ± 0.8 y (mean ± standard deviation (SD)), 101 ± 11
kg, 187 ± 7 cm] from one club, competing in the Australian National Youth Competition, were
recruited to participate in this study. Participants completed various running and team-sport
activities whilst fitted with microtechnology devices (High Performance Unit, Firmware
V1.2.27, GPSports, Canberra, Australia) capable of collecting GPS data at 5 Hz (linear
interpolation used to output data at 15 Hz).11 These devices are also capable of collecting
accelerometer data in three vectors (x, y and z) at 100 Hz, with a peak gravitational acceleration
(g) of up to 16 g within each vector. Players were fitted with devices between the scapulae in
either custom designed vests (vest), supplied by the microtechnology manufacturer (GPSports,
Canberra, Australia), or pockets built into the playing jerseys (jersey) by the club’s apparel
manufacturer (ISC Sports, Roseberry, Australia). All participants were informed of the possible
risks of involvement in the study, gave voluntary written consent and the study was approved
by a university human ethics review panel.
Experimental Procedures
A non-randomised crossover experimental design was used in which participants were
first fitted with the microtechnology device in a vest before completing four minutes of three
different standardised team sport activities; running and agility (randomised order) followed
by tackling (see below for details). During a 15-minute recovery period, players were then
re-fitted with the same device in a jersey before again completing three four-minute blocks of the
same team-sport specific activities.
Vest and jersey fitting
As unit fitting may influence accelerometer loads, vest and jersey fittings were carefully
controlled for each participant. The microtechnology manufacturer does not provide
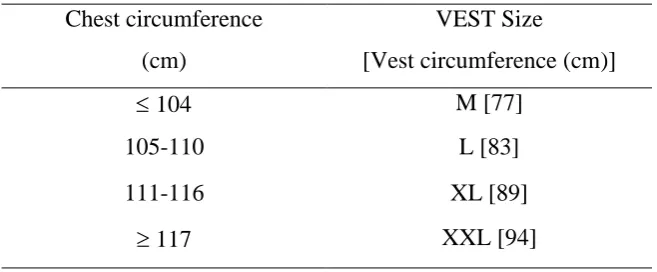
recommendations on vest fitting size, therefore pilot testing was conducted to determine chest
circumference that produced a tight fit (i.e. all areas of the vest were in contact with the skin
and no visible loose areas) for all participants; this sizing can be found in Table 1. Manufacturer
(GPSports, Canberra, Australia) provided vests were made of a neoprene and Lycra® blend,
with a neoprene padded device pocket. Since multiple factors may influence jersey fit (e.g.
chest circumference, shoulder width, torso length) in rugby league players, each participant
was individually fitted into a jersey size by the manufacturer (ISC Sports, Roseberry,
Australia). The goal of these individual manufacturer fitting was to provide a jersey fit that was
as tightly fitted as possible without restricting movement. This manufacturer and fitting process
is used across many professional rugby league clubs in Australia and internationally.12
Manufacturer fitted jersey sizes were closely matched to vest sizes, with 13 of the 16
participants wearing the same jersey and vest size (e.g. participants wearing a ‘large’ vest also
wore a ‘large’ jersey). Of the three participants whose jersey and vest size did not match, two
wore a smaller jersey and one participant a larger jersey. The individual pockets that devices
were housed in were specifically designed for GPSports units in both conditions (jersey and
vest). The jersey ‘pocket’ was an additional piece of neoprene sewn into the jersey, which fitted
very tightly around the GPSports unit.
Team sport activities
Team sport activities were designed for participants to cover 240 m during a
four-minute period. This speed (60 m∙min-1) is lower than previously reported in rugby league
match-play [85- 111 m∙min-1].13 However, the tackling drill involved a large number of
collisions (six per min) compared with collisions previously reported in rugby league
match-play,13 thereby increasing the non-running based activity. All drills were completed on a natural
grass rugby league field with players wearing playing footwear. Between each team sport
activity, players rested for approximately five minutes (always > four minutes), before
beginning the next activity.
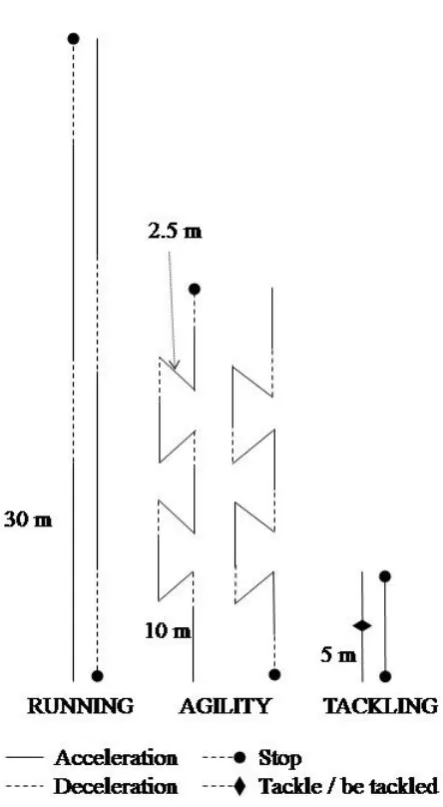
Running: players completed four 60 m straight line runs, with each repetition starting
at one-minute intervals. Each run involved a 20 m acceleration, 10 m deceleration, 20
m acceleration and 10 m deceleration (see Figure 1). Participants were instructed to
accelerate maximally during 20 m accelerations, and perform a controlled sub-maximal
deceleration during deceleration zones (marked by cones and lines on the field).
Agility: a generic team sport agility protocol was completed involving regular change
of direction, acceleration and decelerations, at one-minute intervals. During each agility
run (starting each minute), participants covered 60 m in total, with 8 changes of
direction (see Figure 1). Participants were instructed to complete the agility circuit as
fast as possible on each repetition.
Tackling: players completed 12 tackles and were tackled 12 times during a four-minute
period. For each tackle players were required to accelerate forwards 5 m, tackle/be
tackled to the ground before standing and retreating 5 m to the start position (see Figure
1). Tackles were completed at 10 s intervals throughout the four-minute period.
Following the testing sessions, data collected by the microtechnology devices were
analysed using manufacturer provided software (TeamAMS, Version R1 2015.10C, GPSports,
Canberra, Australia), for determination of total distance (m), distance travelled during high
speed running (>20 km∙h-1), peak speed (km∙h-1), number of accelerations (>1.5 m∙s-2), number
of decelerations (<-2.0 m∙s-2), 3D accelerometer load (i.e. BodyLoadTM) and 2D BodyLoadTM.
BodyLoadTM was calculated by the manufacturers software (TeamAMS, Version R1
2015.10C, GPSports, Canberra, Australia) and represents the sum of overall acceleration
vectors in the x + y (2D) and x + y + z (3D) planes. GPSports accelerometers have previously
been shown to underestimate absolute static and dynamic accelerations by ~30%,14 suggesting
these accelerometers should not be used to measure the absolute magnitude of accelerations
(work completed with GPSports SPI-ProX II, with the capability to measure peak accelerations
up to 8 g in each vector15). However, the same work14 showed that these devices have excellent
intra- and inter-accelerometer reliability, as well as reliable relative increases in peak
acceleration across different frequency oscillations in laboratory setting. This suggests that
accelerometers in GPSports SPI-ProX II devices can be used as a reliable tool to measure
different magnitude accelerations, while the absolute magnitude of these accelerations is likely
underestimated by ~30%. It is possible that absolute accelerations measured by the GPSports
HPU devices (which are capable of detecting accelerations up to 16 g in each vector) differ,
however there is currently no similar validation information available using this device. To
adjust for small differences in distance travelled between trials (i.e. participant travelling off
set path during testing), all BodyLoadTM data were divided by distance (i.e. BodyLoadTM per
km).
Statistical analysis
A magnitude-based statistical approach16 was used to detect small effects of practical
importance. Data were log-transformed to account for non-uniformity error. The magnitude of
changes were assessed in relation to the smallest worthwhile change (SWC), set to a small
effect size (d = 0.2 x the between-participant standard deviation). Raw values were reported as
the mean ± standard deviation while differences are expressed a Cohens d effect size ± 90%
confidence limits. A difference was deemed ‘substantial’ if there was >75% likelihood of the
difference exceeding the SWC.17 Effects where the 90% confidence interval simultaneously
overlapped the substantially positive and negative thresholds were deemed ‘unclear’.
Results
GPS data: GPS-derived data are summarised in Table 2. Total distance was
substantially higher during tackling drills compared with running and agility drills. During
running participants completed 194 13 m above 20 km∙h-1, while no distance was covered in
this high-speed running category for either agility or tackling drills. Maximum speeds and
average acceleration were substantially different between each drill (see Table 2), and
substantially more accelerations and decelerations were completed during agility and tackling
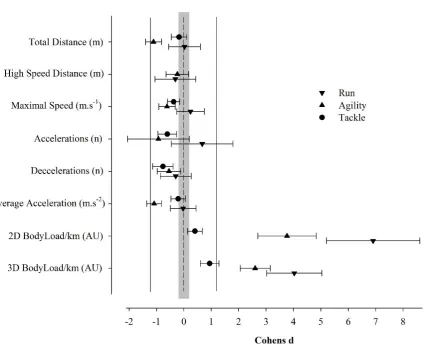
when compared with running. Standardised differences (Cohens d) in GPS-derived variables,
between vest and jersey conditions, are displayed in Figure 2.
Accelerometer data in vest: The comparison of 2D BodyLoadTM per km to 3D
BodyLoadTM per km (i.e. 2D BodyLoadTM per km / 3D BodyLoadTM per km, which represents
the contribution of the anteroposterior and mediolateral loads to the overall 3D load) is shown
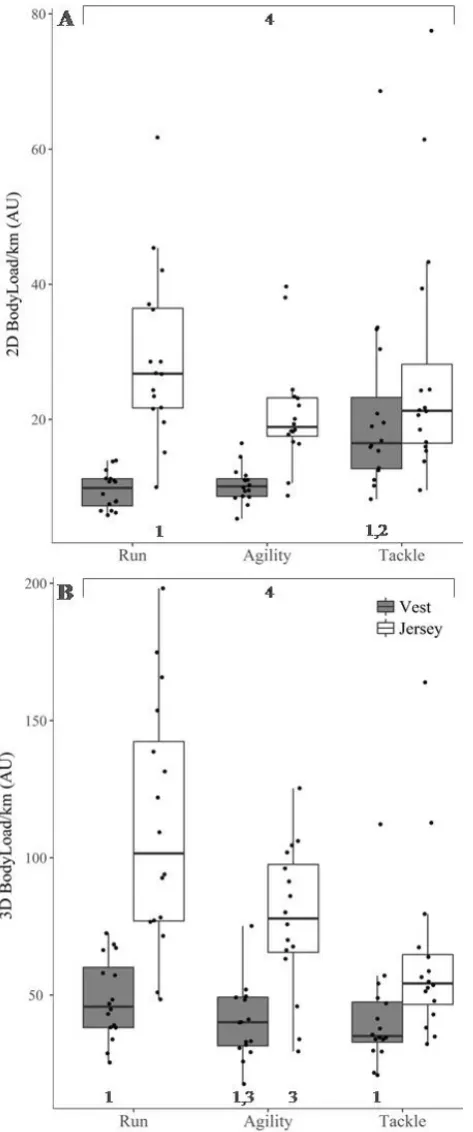
in Table 3. When microtechnology units were fitted in a vest, 2D BodyLoadTM per km was
higher during tackling (21.5 ± 14.8 AU/km) when compared with both running (9.5 ± 2.5
AU/km; d = 2.26 ± 0.92) and agility (10.3 ± 2.7 AU/km; d = 1.97 ± 1.00; see Figure 3).
Three-dimensional BodyLoadTM per km was substantially higher in running when compared with
agility (d = 0.57 ± 0.27) and tackling (d = 0.55 ± 0.64) when the unit was fitted in the vest.
Accelerometer data in jersey: Fitting the unit in a jersey resulted in both 2D
BodyLoadTM per km [running (vest = 9.5 ± 2.7 AU/km, jersey = 29.3 ± 14.8 AU/km; d = 3.48
± 0.45), agility (vest = 10.3 ± 2.7 AU/km, jersey = 21.0 ± 8.1 AU/km; d = 2.40 ± 0.44), tackling
(vest = 21.5 ± 14.8 AU/km, jersey = 27.8 ± 18.6 AU/km; d = 0.44 ± 0.23)], and 3D BodyLoadTM
per km [running (vest = 48.5 ± 14.8 AU/km, jersey = 111.5 ± 45.4 AU/km; d = 2.38 ± 0.33),
agility (vest = 40.4 ± 13.6 AU/km, jersey = 77.7 ± 26.8 AU/km; d = 1.77 ± 0.27), tackling (vest
= 42.0 ± 21.4 AU/km, jersey = 63.2 ± 33.1 AU/km; d = 0.95 ± 0.27)] being substantially higher
across all drills compared with a vest fitted unit. When fitted in a jersey, 2D BodyLoadTM per
km was also substantially higher during running drills (29.3 ± 14.8 AU/km), when compared
with agility (21.0 ± 8.1 AU/km; d = 0.68 ± 0.27). In the jersey fitting, running (111.5 ± 45.4
AU/km; d = 1.28 ± 0.47) and agility (77.7 ± 26.8 AU/km; d = 0.51 ± 0.41) drills produced
substantially higher 3D BodyLoad’sTM per km compared to tackling (63.2 ± 33.1 AU/km).
Additionally, 3D BodyLoadTM per km was substantially higher during running when compared
with agility (d = 0.77 ± 0.30).
Discussion
The main finding of the current investigation was that, when the microtechnology
device is tightly fitted in a vest, 2D BodyLoadTM is substantially higher during
collision/tackling drills compared with running only drills. Additionally, when units are fitted
into a playing jersey, 2D BodyLoadTM increases more than two-fold during running/agility
drills (smaller increase during tackling drills), with a concomitant increase in the variability of
this measure. This increased load and variability, paired with a lesser increase in 2D
BodyLoadTM during tackling drills, diminishes the ability of 2D BodyLoadTM to differentiate
running/agility and tackling drills. In contrast to the increases in accelerometer-derived load,
large changes were not observed in GPS-derived variables between vest and jersey fittings.
Furthermore, 3D BodyLoadTM is unable to differentiate between running/agility and tackling
drills. This is likely due to a large contribution of accelerometer load in the vertical axis (~80%
during straight line running), which could mask any small load increases in the anteroposterior
and mediolateral axes, that may occur during tackling drills.
It has previously been shown that 3D accelerometer loads are strongly influenced by
total distance travelled during locomotor activities (due to the influence of vertical forces
applied during foot strike).3 We hypothesised that 2D BodyLoad’sTM may provide information
independent of total distance in overall load accumulation, and therefore, be more sensitive in
detecting accelerations/decelerations and impacts/collisions in rugby league drills. However,
the present data shows that 2D load is similar during straight line running and agility drills (see
Figure 3A), when fitted in a vest, and this measure therefore appears insensitive to
accelerations, decelerations and changes of direction, in this specific context. In contrast, there
was an approximate two-fold increase in 2D BodyLoadTM per km (vest fitted) during tackling
drills, suggesting that this may be a more appropriate measure of impacts/collision load. It
should be noted that running speeds were quite high during straight line running in this study
(~80% of total distance >20 km∙h-1) and previous work has shown that greater accelerometer
loads are accumulated in all three dimensions at higher running speeds.3 Conversely, during
the agility condition, no high speed running (>20 km∙h-1) was completed. Therefore, further
investigation is required to determine if 2D BodyLoadTM may be sensitive to changes in
direction, accelerations and decelerations, but also increases during high speed running. Future
work to elucidate the relationship between BodyLoadTM in speed matched straight line running
and agility activities will further enhance understanding of the factors contributing to the
accumulation of BodyLoadTM during team sport activities.
Incidental unit movement, which is likely influenced by the positioning and fitting of
the unit, may also have an impact on accelerometer-derived training loads. The most common
position for unit fitting in team sport athletes is in the centre of the upper back, slightly superior
to the scapula.3 This positioning allows the unit to move with the athletes torso, without being
inhibitive of rugby league match-play, and accelerometer-derived loads have shown very
strong reliability when tightly fitted in custom designed vests in this position.2 Since the use of
microtechnology devices have become more common practice across sporting teams, apparel
manufacturers have begun to build customised pockets into playing uniforms, presumably in
an attempt to reduce the amount of equipment needed and increase player comfort while
wearing these devices. However, due to the high sampling rate and sensitivity of the
accelerometers in these devices, incidental movement (which is likely influenced by unit
fitting) may have a large impact on accelerometer-derived loads. The present results show that
2D and 3D BodyLoadTM increases across all drill types when fitted in a jersey compared with
a vest. While 2D BodyLoadTM clearly discriminated between running/agility and tackling drills
while fitted in a vest, when units were fitted in a jersey the differences in 2D BodyLoad’sTM
between drills was less apparent. These differences are likely due to a greater increase in
incidental unit movement during running and agility drills, compared with tackling drills in
the jersey fitting. This work shows that alternate unit fitting (i.e. vest vs jersey) can lead to a
two-fold increase in accelerometer loads. Therefore, considering the influence of unit fitting in
these type of analyses is likely critical to accurate interpretation of the data. Whilst unit fitting
had a large influence on accelerometer loads, only very small or no differences were seen in
derived variables (see Figure 2). Furthermore, any small differences observed in
GPS-derived variables were lower in the jersey condition compared with the vest (opposed to large
increases in accelerometer load with jersey fittings), which may be due to a small fatigue related
order effect of completing the jersey trial after the vest trial (discussed further below). These
results would suggest that unit fitting (vest vs jersey) has minimal impact on the quality of
GPS-derived data.
Several limitations should be considered when interpreting the current results. Firstly,
for the BodyLoadTM analysis there was no variation between straight-line running speeds
across trials. During the running drill in the current study, participants were instructed to
maximally accelerate for 20 m, decelerate for 10 m before repeating this to complete a 60 m
run. This protocol produced high running speeds, which are somewhat infrequent during rugby
league match-play. Conversely, no high-speed running (above 20 km∙h-1) was completed
during the agility condition in the present study. Since greater accelerometer loads are
accumulated at higher running speeds,3 different results may have been obtained if running
speeds were matched between straight line running and agility drills. The design of the tackling
drill should also be considered when interpreting the current findings. The density of collisions
(i.e. six per minute) in our protocol was quite a high comparison data reported in rugby league
match-play.13 It is possible that the frequency of collisions in this experimental design created
more chance for a difference in 2D BodyLoadTM between tackling and running/agility drills.
There is also the possibility of an order effect occurring within this study; due to
logistical challenges during data collection, the order of wearing a vest or jersey was not
randomised (i.e. all participants first completed the protocol wearing a vest). This means there
may have been residual fatigue during the second (jersey) trial. However, due to the small
volume of work and long rest periods between activities (approximately 5 minutes) and
conditions (approximately 15 minutes), accumulated fatigue would likely be minimal. Whilst
some residual fatigue may be present in this study, as evidenced by very small reductions in
some GPS-derived variables (see Figure 2), any reductions in intensity should reduce
accelerometer load. As accelerometer loads are highest during the second condition, we are
confident that residual fatigue did not confound the finding that higher accelerometer loads are
accumulated when wearing the microtechnology device in a jersey.
Practical Applications
The present results show that 2D BodyLoadTM increases with the addition of
tackling/collisions in rugby league specific drills (in the case that devices are worn in a tightly
fitted, manufacturer provided vest, but not in a playing jersey). Therefore, practitioners can use
this variable to quantify contact loads in team sport athletes. This measure of external load may
be particularly important for specific rugby league players who complete less overall distance
and high-speed running, but may be involved in more collisions/tackles (e.g. front row
forwards). This study also shows large increases in accelerometer-derived loads when
microtechnology units are fitted into playing jerseys, whilst GPS-derived variables do not
appear sensitive to unit fitting. As this increase in load is not related to changes in the physical
demands of the sport, rather an increase in incidental unit movement due to a looser fit,
practitioners should interpret accelerometer data collected within jersey fittings with caution.
Indeed, if this data is going to be used to inform decision-making, it is suggested that athletes
wear microtechnology units in manufacturer provided vests, or other tightly fitted garments,
throughout both training and matches.
Conclusions
The present results show that 2D BodyLoadTM is able to detect accumulated
collision/tackling load in rugby league training drills. In contrast, large contributions of the
vertical load vector in 3D BodyLoadTM appears to mask any small increases in load in the
mediolateral and anteroposterior vectors during tackling drills, rendering 3D BodyLoadTM
insensitive to changes in the contact load of training drills. Additionally, unit fitting is shown
to have a large influence on accumulated accelerometer loads during running, agility and
tackling drills, which appears to be related to greater incidental unit movement when units are
fitted in playing jerseys.
References
1. Johnston RJ, Watsford ML, Kelly SJ, Pine MJ, Spurrs RW. Validity and interunit
reliability of 10 Hz and 15 Hz GPS units for assessing athlete movement demands. J
Strength Cond Res. 2014;28(6):1649-1655.
2. Boyd LJ, Ball K, Aughey RJ. The reliability of MinimaxX accelerometers for
measuring physical activity in Australian football. Int J Sports Physiol Perform.
2011;6(3):311-321.
3. Barrett S, Midgley A, Lovell R. PlayerLoad™: reliability, convergent validity, and
influence of unit position during treadmill running. Int J Sports Physiol Perform.
2014;9:945-952.
4. Lovell T, Sirotic A, Impellizzeri F, Coutts A. Factors affecting perception of effort
(session Rating of Perceived Exertion) during rugby league training. Int J Sports
Physiol Perform. 2013;8:62-69.
5. Cummins C, Orr R, O’Connor H, West C. Global positioning systems (GPS) and
microtechnology sensors in team sports: a systematic review. Sports Med.
2013;43(10):1025-1042.
6. Malone JJ, Lovell R, Varley MC, Coutts AJ. Unpacking the black box: applications and
considerations for using GPS devices in sport. Int J Sports Physiol Perform. 2016:1-30.
7. Gabbett T, Jenkins D, Abernethy B. Physical collisions and injury during professional
rugby league skills training. J Sci Med Sport. 2010;13(6):578-583.
8. Gabbett TJ, Jenkins DG, Abernethy B. Physical collisions and injury in professional
rugby league match-play. J Sci Med Sport. 2011;14(3):210-215.
9. Aughey RJ. Applications of GPS technologies to field sports. Int J Sports Physiol
Perform. 2011;6(3):295-310.
10. Coutts AJ, Kempton T, Sullivan C, Bilsborough J, Cordy J, Rampinini E. Metabolic
power and energetic costs of professional Australian Football match-play. J Sci Med
Sport. 2014.
11. Twist C, Worsfold P. The science of rugby. Routledge; 2014.
12. ISCSports. 2016; http://www.iscsport.com/whos-wearing/teams. Accessed 5th
November 2016, 2016.
13. Kempton T, Sirotic AC, Cameron M, Coutts AJ. Match-related fatigue reduces physical
and technical performance during elite rugby league match-play: a case study. J Sports
Sci. 2013;31(16):1770-1780.
14. Kelly SJ, Murphy AJ, Watsford ML, Austin D, Rennie M. Reliability and validity of
sports accelerometers during static and dynamic testing. Int J Sports Physiol Perform.
2015;10(1):106-111.
15. Cummins C, Orr R. Analysis of physical collisions in elite national rugby league match
play. International journal of sports physiology and performance. 2015;10(6):732-739.
16. Hopkins WG, Marshall SW, Batterham AM, Hanin J. Progressive statistics for studies
in sports medicine and exercise science. Med Sci Sports Exerc. 2009;41(1):3-13.
17. Batterham AM, Hopkins WG. Making meaningful inferences about magnitudes. Int J
Sports Physiol Perform. 2006;1(1):50-57.
Figure 1. Schematic of the team sport activities. Running and agility drills were completed four times, while the tackling drill was completed 24 times (12 tackles, 12 times being tackled) within a four-minute period
Figure 2. Standardised differences (Cohens d) in GPS and accelerometer variables between vest and jersey conditions (positive Cohens d reflects higher numbers in jersey condition). Note: High speed distance not shown for tackling as there was zero high speed distance in this drill.
Figure 3. 2D (A) and 3D (B) BodyLoadTM, expressed per km, during different drill types
(running, agility and tackling) wearing a vest or jersey. 1Denotes substantially higher than
agility; 2denotes substantially higher than running; 3denotes substantially higher than tackling;
4denotes jersey values substantially higher than vest values in all drill types.
Table 1. Chest circumference and vest sizing’s.
Chest circumference
(cm)
VEST Size
[Vest circumference (cm)]
104 M [77]
105-110 L [83]
111-116 XL [89]
117 XXL [94]
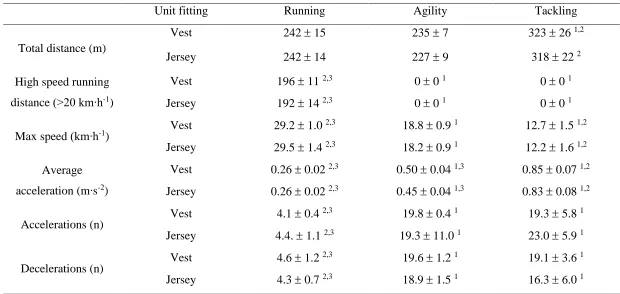
Table 2. GPS variables during different drills and unit fittings. Data presented are mean ± SD.
Unit fitting Running Agility Tackling
Total distance (m)
Vest 242 15 235 7 323 26 1,2
Jersey 242 14 227 9 318 22 2
High speed running
distance (>20 km∙h-1)
Vest 196 11 2,3 0 0 1 0 0 1
Jersey 192 14 2,3 0 0 1 0 0 1
Max speed (km∙h-1) Vest 29.2 1.0
2,3 18.8 0.9 1 12.7 1.5 1,2
Jersey 29.5 1.4 2,3 18.2 0.9 1 12.2 1.6 1,2
Average
acceleration (m∙s-2)
Vest 0.26 0.02 2,3 0.50 0.04 1,3 0.85 0.07 1,2
Jersey 0.26 0.02 2,3 0.45 0.04 1,3 0.83 0.08 1,2
Accelerations (n) Vest 4.1 0.4
2,3 19.8 0.4 1 19.3 5.8 1
Jersey 4.4. 1.1 2,3 19.3 11.0 1 23.0 5.9 1
Decelerations (n) Vest 4.6 1.2
2,3 19.6 1.2 1 19.1 3.6 1
Jersey 4.3 0.7 2,3 18.9 1.5 1 16.3 6.0 1
1substantially different from running; 2 substantially different from agility; 3 substantially different from tackling.
Note – all statistical comparisons made in same unit fitting.
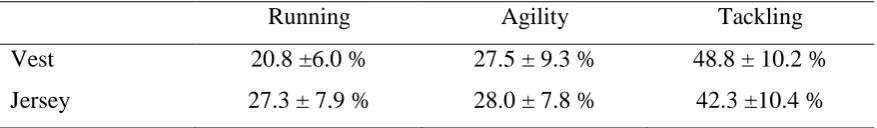
Table 3. Percent 2D BodyLoadTM per km in comparison to 3D BodyLoadTM per km. Data presented are mean ± SD.
Running Agility Tackling
Vest 20.8 ±6.0 % 27.5 ± 9.3 % 48.8 ± 10.2 %
Jersey 27.3 ± 7.9 % 28.0 ± 7.8 % 42.3 ±10.4 %