1
Changes in nutrient profiling and antioxidant activities of different fish soups, before and 1
after simulated gastrointestinal digestion 2
Gaonan Zhang a, Shujian Zheng b, Yuqi Feng b, Guo Shen a, Shanbai Xiong a, c, Hongying Du a, c * 3
4
a College of Food Science and Technology, Huazhong Agricultural University, Wuhan, Hubei 5
Province 430070, P.R. China 6
b
Key Laboratory of Analytical Chemistry for Biology and Medicine of the Ministry of Education, 7
Department of Chemistry, Wuhan University, Wuhan, Hubei Province 430070, P.R. China 8
c National R & D Branch Center for Conventional Freshwater Fish Processing, Wuhan, Hubei 9
Province 430070, P.R. China 10
11
12
* To whom correspondence should be addressed: Hongying Du: [email protected] 13
Abstract 16
Different kinds of freshwater fish soups show a diverse range of health functions, due to their 17
different nutritional substances and corresponding bioactivities. Crucian carp soup and snakehead 18
soup have different dietotherapy functions, crucian carp soup is suitable for lactating women and 19
snakehead soup is suitable for postoperative patients. In the current study, the changes of nutrient 20
profiles in the different fish soups, such as chemical composition, free amino acids, mineral and 21
fatty acid contents, were investigated. The antioxidant activities of the fish soups were evaluated 22
by using the DPPH radical scavenging activity, the ferrous ion chelating activity, the hydroxyl 23
radical-scavenging activity and the reducing power effect. In order to learn the theoretical basis of 24
the potential role fish soup plays in diet therapy functions after being digested by the human body, 25
the nutrient profiling and bioactivities of the fish soup samples after simulated gastrointestinal 26
digestion were also explored. The intensive profiles of nutritional composition and antioxidant 27
activities of these two kinds of fish soups were expected to partly provide the theoretical basis of 28
therapeutic effects. 29
30
Keywords nutrient profiling; simulated gastrointestinal digestion; antioxidant activity; fish soup 31
Introduction 33
Soup is a liquid food that is cooked with different ingredients such as meat, vegetables, and 34
beans in hot water until the flavor is extracted. The broth usually has strong flavors, and becomes 35
a principal source of energy-yielding dietary fluids. Usually, soup has different properties and 36
nutrients based on the different materials used during the cooking procedure, including chicken [1], 37
beef [2], pork [3], and fish [4], etc. It plays an essential role in physical growth, maintenance of 38
normal bodily functions, and good health. In addition, drinking soup could increase satiety and 39
lower the incidence of obesity by helping people keep fit [5]. Therefore, various soups have 40
become more and more important for people who consume them frequently, especially nutritious 41
and healthy soups. 42
Freshwater fish is rich in nutrition, and it is a source of high-quality proteins, minerals [6] 43
and essential fatty acids, particularly polyunsaturated fatty acids - docosahexaenoic acid (DHA, 44
C22:6n3) and eicosapentaenoic acid (EPA, C20:5n3), which are good for one’s health [7-9] and 45
preventing many coronary artery diseases [7]. Therefore, freshwater fish have the potential to 46
become raw materials for a health preserving soup. 47
Snakehead (Channa argus) and crucian carp (Carassius auratus) are two kinds of popular 48
freshwater fish in Hubei province (China) for health-care soup ingredients. Snakehead soup is 49
nutritious, and it is commonly used during adjuvant therapy for people with a weak body and a 50
poor nutritional situation, especially for the healing of wounds and burns [10]. Snakehead soup 51
may help muscle growth, blood regeneration, post-operative pain reduction, improve 52
microcirculation and so on. Crucian carp soup has an attractive milky white color and a great taste, 53
it can invigorate the spleen and prompt milk secretion. This suggests that it’s consumption is 54
determine the different dietotherapy functions; therefore the investigation of nutrient components 56
may provide relevant information. 57
Furthermore, the biological activity of food is further enhanced by the release of bioactive 58
compounds and peptides during the digestive procedure, thermal pre-treatment, microbial 59
fermentation or other technological processing [12]. Studies of the pharmacological effects of fish 60
peptides or the other metabolites hydrolyzed by digestion, no matter in-vitro and in-vivo, have 61
revealed their different functions, such as antihypertensive, immunomodulatory, antioxidant, 62
antitumor, and antimicrobial activities [13]. Antioxidant activities as a representative biological 63
activity were closely to related to the function of the food, it is commonly used to assess or 64
explain the effect of adjuvant therapy of food, even for fish or fish products [14]. 65
In this study, the intensive profiles of nutritional compositions of these two homemade fish 66
soups (crucian carp soup and snakehead soup) showed different therapeutic effects. They were 67
investigated systematically, including the chemical components, free amino acid, fatty acids, and 68
mineral contents. In addition, the antioxidant activities of the fish soups, before and after 69
simulated gastrointestinal digestion, were explored by 1,1-diphenyl-2-picrylhydrazyl (DPPH) 70
radical-scavenging activity, hydroxyl radical-scavenging activity, ferrous ion chelating activity and 71
reducing power. This study could provide the theoretical basis of diet composition and properties 72
for understanding the reason of various medicinal tonic functions of different nourishing soups. 73
74
Materials and Methods 75
Materials and reagents 76
purchased from a local market in Huazhong Agricultural University, Hubei, China. Each specimen 78
was gutted and cleaned. All chemicals used in this work were analytical grade. 79
Preparation of fish soup samples 80
According to the method of Tang [15], the handled fish was cooked at a suitable 81
mince/solution ratio of 1:4 (w/v) adopting stew soup with Induction Cooker (RT2134, Midea, 82
China) for 1.5 h. At the beginning the power was set 500W to simmer the soup for 20 min, then 83
the power was kept at 300W and the soup maintained boiling. 84
Simulated gastrointestinal digestion 85
A two-step process was used to simulate the gastric and intestinal digestion of fish soup 86
using the in-vitro enzymatic digestion protocol described in Lin et al. [16] with slight modification. 87
The pH of the samples was adjusted to 2.0 with 1 M HCl,then pepsin was added (4%, w/w, 88
protein basis). The mixture was incubated at 37 °C for 2 h in a shaking water bath. Subsequently, 89
the pH value was adjusted back to 5.3 with 0.9 M NaHCO3 and further to 7.5 with 1 M NaOH. 90
Then pancreatin was added (5%, w/w, protein basis) and the mixture was further incubated at 91
37 °C for 2.5 h. After incubation, the test tubes were kept in a boiling water bath for 10 min to 92
inactivate the enzyme. 93
For analyzing the antioxidant activities during the process of digestion, the samples were 94
collected at different time intervals (0h, 0.5h, 1.0h, 1.5h, 2.0h, 2.5h, 3.0h, 3.5h, 4.0h, 4.5h) during 95
in-vitro gastrointestinal digestion. All samples were adjusted to pH 7.0 and treated with 10% 96
trichloroacetic acid (TCA) and centrifuged at 12000 rpm for 20 min. After centrifugation, the 97
supernatant (protein hydrolysate) was stored at -20 °C for further usage. 98
The proximate composition was performed on samples using the standard methods (AOAC 100
1996). The moisture content of samples was determined by drying samples in an oven at 105°C 101
for 16–18 h (AOAC Method 950.46). The total protein was determined by the Kjeldahl method 102
(AOAC Method 940.25). During the analysis, an automated distillation unit (Bűchi 339, 103
Switzerland) was utilized, and the factor of 6.25 was used to convert the nitrogen content into the 104
protein content. Ash was determined by the incineration of samples in a muffle furnace at 550°C 105
for 18 h (AOAC Method 938.08). The extraction of total fat was performed according to the 106
method of Folch et al [17]. 107
Mineral element analysis 108
Sample preparation and determination of the mineral contents were according to Jiang et al 109
[18]. The soup sample (20g) was weighed and placed into a crucible, and then carbonized at 110
250 °C on an electrothermal plate until the sample was fully black. The crucibles with samples 111
were dry-ashed by heating them in a muffle furnace at 550 °C (about 10−12h). Then the sample 112
was incinerated, a white residue was obtained, which was carefully transferred into a 50 mL 113
volumetric flask, dissolved with 5mL of 6 M HCl and then diluted to 50 mL with water. The 114
mineral contents (K, Ca, Na, Mg, Fe, Zn) of the fish soups were detected by Atomic Absorption 115
Spectrophotometer (TAS-990F, Fairburn, Shanghai, China). 116
Free amino acid analysis 117
Free amino acids (FAA) were extracted from the fish soups according to Tanimoto’s 118
method[19] with minor modifications. The fish samples were mixed in the same volume of 119
sulfosalicylic acid and the mixture were centrifuged at 3000r/min for 15 min, then the supernatant 120
and the supernatant was transferred to the round bottom flask. The rotary evaporator was used, 122
10mL distilled water was added, and this was repeated several times to completely remove TCA. 123
In the end, the extracted solution was mixed with 0.02 M HCl and the pH value was adjusted to 124
2.0. The prepared samples were analyzed using L-8900 Amino Acid Analyzer (Hitachi, Tokyo, 125
Japan). 126
Fatty acid analysis 127
Fatty acid methyl esters (FAMEs) were prepared according to the method presented by Bligh 128
and Dyer [20] with slight modifications. The detailed steps were as follows: the sample (~5 mL) 129
was mixed with 30 mL chloroform-methanol (2:1, v/v) and was homogenized at 8000 rpm for 20s 130
twice using T18 digital Ultra-turrax (IKA, German). Then the mixture was put under stationary 131
conditions for 1h, and then filtered after adding 0.2 times the volume of physiological saline. The 132
suspension was centrifuged (3000 rpm, 15 min), and the upper liquid was removed and the 133
remaining liquid was concentrated using nitrogen purging. Afterwards, 14% BF3-methanol reagent 134
(2 mL) was added, and the mixture was kept at 60°C for 60 min. After cooling, 2 mL of hexane 135
was added and the mixture was shaken for about 15s. The hexane solution of methyl-esters at the 136
top was extracted and transferred into a tube to preserve at -20 °C. 137
A gas chromatography-mass spectrometer (QP2010,Shimadzu, Kyoto, Japan) equipped with 138
a 30 m column (Rtx-5MS column 30 m × 0.25 mm × 0.25 μm column) was used. The GC 139
conditions were set as follows: the oven temperature was initially set at 40 °C for 2 min and then 140
increased to 100 °C at 10 °C/min. The temperature was then increased to 290 °C at 5 °C/min and 141
held for 10 min. Split injection was conducted with a split ratio of 100: 1, the flow-rate 1 mL/min; 142
were as follows: Ionization mode, EI+; electron energy, 70 eV; full scan acquisition mode; mass 144
range, 45-450 amu. 145
Measurement of antioxidant activity 146
DPPH (1,1-Diphenyl-2-picrylhydrazyl) radical-scavenging activity 147
The DPPH scavenging activities of samples were measured as previously described with 148
slight modifications [21]. In the current study, a 4.0 mL sample was mixed with 1.0 mL 149
DPPH· solution (0.1 mM in 99.7% methanol). The mixture was shaken and left for 30 min at 150
room temperature, and the absorbance of the resulting solution was measured at 517 nm using 151
UV-1750 spectrophotometer (Shimadzu, Kyoto, Japan). Ethanol instead of DPPH was used as the 152
blank, while distilled water was used for the control. The DPPH radical scavenging activity was 153
calculated with the following equation: 154
DPPH scavenging activity (%) = [1- (A sample- A blank )/ A control]×100 (1) 155
where A sample, A blank and A control are the absorbance of sample, blank and control, respectively. 156
Hydroxyl radical-scavenging activity 157
The hydroxyl radical scavenging assay was carried out according to the method described 158
previously [22] with some modifications. A reaction mixture solution containing 159
1,10-phenanthroline (0.75mM, 1mL), FeSO4 (0.75mM, 1mL) and phosphate buffer (pH 7.4, 2mL) 160
was mixed with a 2mL sample (2mL distilled water was used as the control). H2O2 (1mL, 0.12%) 161
was added to the mixture and incubated at 37°C for 60 min, and the absorbance was measured at 162
536 nm.The results were determined using the following equation: 163
Hydroxyl radical scavenging activity (%) = [(As- A1 )/ (A0- A1 )]×100 (2) 164
water instead of sample); and A0 is the absorbance of the blank solution containing 166
1,10-phenanthroline and FeSO4. 167
Chelating activity of Fe2+ 168
The chelation activity on Fe2+ was measured based on the following method. An aliquot of 169
1.0 mL of sample was mixed with 3.7 mL of distilled water, 0.1 mL of 2 mM FeCl2 and 0.2 mL of 170
5 mM ferrozine. The mixture reacted for 20 min at room temperature. Then the absorbance was 171
measured at 562 nm. The distilled water was used as the control, while the distilled water instead 172
of FeCl2 and ferrozine was used for the blank. The chelating activity was calculated as follows: 173
Metal ion chelating activity (%) = [A control - (A sample- A blank ) ]/ A control×100 (3) 174
where A sample, A blank and A control are the absorbance of sample, blank and control, respectively. 175
Reducing power 176
The reducing power was measured by using a modified version of Oyaizu’s method [23]. 2 177
mL sample and 2 mL phosphate buffer (0.2 M, pH 6.6) were mixed with 2 mL 1% K3Fe(CN)6. 178
The mixture was incubated at 50 °C for 20 min and mixed with 2 mL 10% TCA, followed by 179
centrifugation at 3000 rpm for 10 min. Then, 2 mL of the supernatant was drawn and mixed with 2 180
mL distilled water, followed by the addition of 0.4 mL of 0.1% FeCl3. After 10 min of incubation 181
at room temperature, the absorbance of the resulting Prussian blue solution was read at 700 nm. 182
Statistical analysis 183
All experiments were taken in triplicate, and all analyses were also conducted in triplicate. 184
Data was expressed as the mean ± standard deviation (SD). Statistical analysis was performed 185
with MS Excel (Microsoft Windows 2010) and SAS version 9.2 (SAS Institute Inc., Cary, NC, 186
level (p<0.05). 188
189
Results and Discussion 190
Proximate chemical composition 191
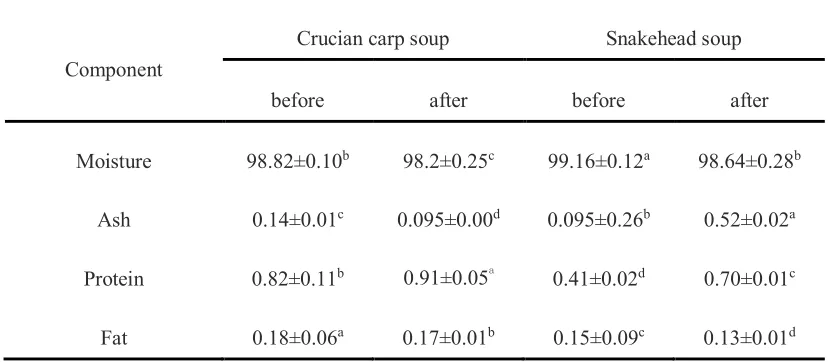
The chemical compositions of the crucian carp soup and snakehead soup were shown in 192
Table 1. The results showed that water was the major component in both freshwater fish soups 193
before and after simulated gastrointestinal digestion due to the soup materials issue. There was 194
almost no difference in water, ash and fat contents that were observed in both of the fish soups, 195
except the protein content. In the beginning, the crucian carp soup had twice the soluble protein 196
content compared to the snakehead soup, however, the protein content of the snakehead soup had 197
a large increase after in-vitro gastrointestinal digestion. The protein content increased from 0.82%, 198
0.41% to 0.91%, 0.70% for the crucian carp soup and the snakehead soup, respectively. 199
Furthermore, the fat content of both fish soups represented a slight decrease after simulated 200
gastrointestinal digestion, the reason was pancreatin is a digestive enzyme which helped the 201
digestion of fat, ultimately leading to a decrease of the content of total fat[24]. 202
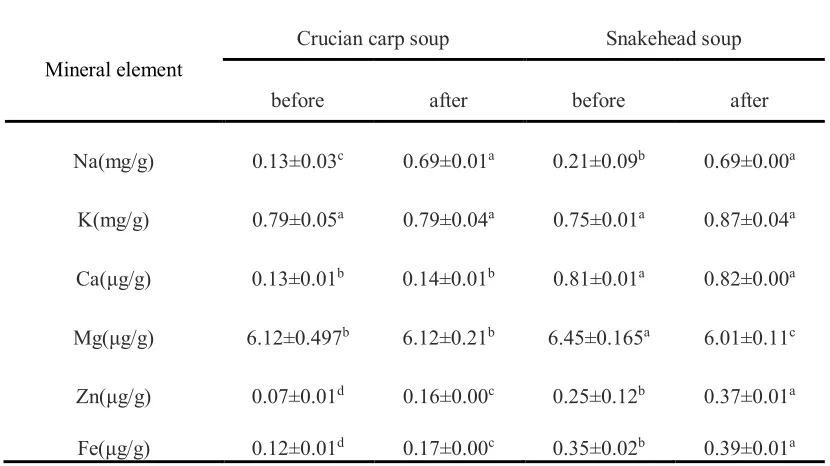
Mineral elements analysis 203
The mineral element contents of the crucian carp soup and snakehead soup before and after 204
in-vitro digestion were collected in Table 2. From the mineral element analysis, the results of 205
major minerals (Na, K, Ca,) and trace minerals (Mg Zn, Fe) indicated that there were high 206
concentrations of K and Mg in both fish soups. Comparing the different fish species, the 207
snakehead soup appears to have a higher mineral content, especially for Ca, Zn and Fe. Usually, 208
indirect effects on the synthesis of nucleic acids, proteins and the immune process [25]. Research 210
shows that Fe is involved in hematopoiesis, which is an important component of heme iron in 211
erythrocyte, and easily leads to anemia and other symptoms [26]. Zn deficiency can cause 212
metabolic dysfunction, decrease immune function, cause infection by bacteria, viruses and fungi 213
and growth retardation, premature and poor wound healing [27, 28]. These reasons may be why 214
Snakehead soup is suitable for patients after surgery during the time their wound is healing. After 215
the process of digestion, the contents of Na, Zn and Fe were significantly increased (p<0.05). 216
During the pancreatin digestion, NaHCO3 and NaOH were used to adjust pH, which perhaps was 217
the major reason leading to the increase of Na. Protein degradation was lower than that of 218
snakehead soup (6.28mg/100mL) promoted by chelating metal groups exposure, thus the content 219
values of Zn and Fe went up. 220
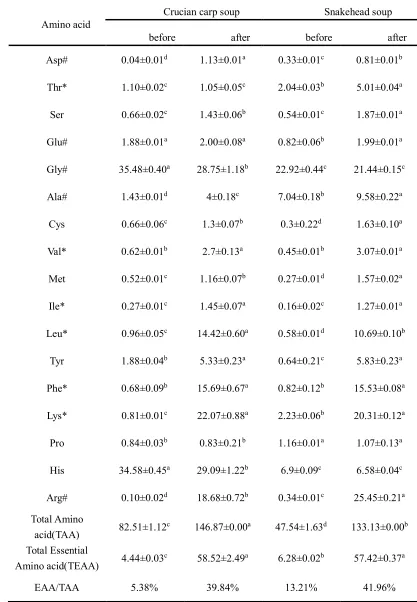
Free Amino acids contents 221
The mean values (with their standard errors) of the amino acids were set out in Table 3, 222
including amino acid (AA) compositions, the concentrations of total amino acids (TAA), total 223
essential amino acids (TEAA) and flavor amino acids for all kinds of fish soup. This was done 224
regardless of the status of the fish soup samples, being before and after digestion processing. 225
From Table 3, it can be seen that the content of flavor amino acids for both fish soups were 226
different, in particular the contents of Asp, Glu, Gly, Ala and Arg in the crucian carp soup was 227
successively 0.4mg, 1.88mg, 35.48mg, 1.43mg and 0.1mg in each 100mL fish soup, but for the 228
snakehead soup it was 0.33mg, 0.82mg, 22.92mg, 7.04mg and 0.34mg, respectively. Flavor amino 229
acids, which belong to the (umami)-taste active amino acids, have been considered as one of the 230
carp soup (38.93mg/100mL) were higher than that of snakehead soup (31.45 mg/100mL), that is 232
the reason that crucian carp soup has a more attractive taste than snakehead soup. 233
The content of essential amino acids and non-essential amino acids TAA of crucian carp soup 234
(82.51mg/100mL) were much higher than that of snakehead soup (47.54mg/100mL) (P<0.05), 235
while the TEAA of crucian carp soup (4.44mg/100mL) was lower than that of snakehead soup 236
(6.28mg/100mL) (P<0.05). After in-vitro gastrointestinal digestion, the variation tendency of most 237
TAA and EAA contained in the two kinds of soups sharply increased (P<0.05) except His, Gly, 238
Thr and Glu in the crucian carp soup. In the gastrointestinal tract, the soluble proteins degraded 239
into small peptides and free amino acids under the action of pepsin and pancreatin, which are 240
more beneficial to human absorption. The data obtained for the contents of EAA showed that the 241
content of Thr in the crucian carp soup (5.01mg/100mL) was four times larger compared to the 242
snakehead soup (1.05mg/100mL) after digestion. Thr is involved in a variety of human 243
metabolism functions known as second or third restricted amino acids [30]. The contents of Val, 244
Ile and Leu in the crucian carp soup were higher than that of snakehead soup whether it was 245
digested or not. The Leu, Ile and Val compose the Branched-Chain Amino Acids (BCAAs) which 246
have special physiological functions, such as strengthening immunity [31]. That means crucian 247
carp soup has more potential abilities to enhance immunity than snakehead soup. 248
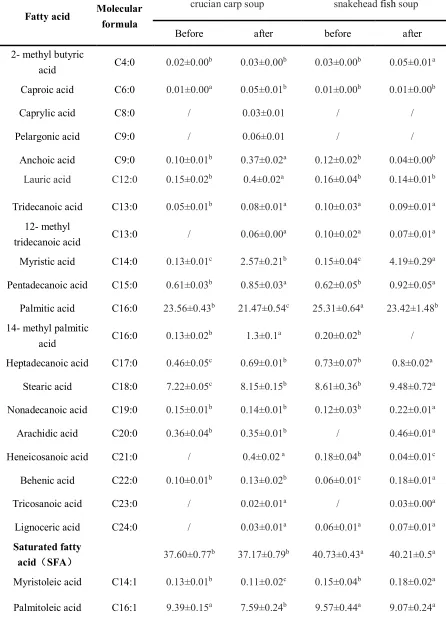
Fatty acids profile 249
Fatty acids profiles(% weight of methyl esters), the sum of total saturated fatty acids(SFA), 250
unsaturated fatty acids (UFA), monounsaturated fatty acids (MUFA) and polyunsaturated fatty 251
acids (PUFA) inherent in the crucian carp soup and the snakehead soup before and after digestion 252
seven PUFAs, were characterized in the different kinds of original fish soup samples. 254
Twenty-three of them were detected in the crucian carp soup, except Caprylic acid, Pelargonic 255
acid, 12- methyl tridecanoic acid, Heneicosanoic acid, Tricosanoic acid, Lignoceric acid, Nervonic 256
acid, Linoleic acid and Cis-11,14-Eicosadienoic acid. Twenty-six fatty acids were detected in the 257
snakehead soup except for Caprylic acid, Pelargonic acid, Arachidic acid, Tricosanoic acid, 258
Cis-8,11,14-Eicosatrienoic acid and Cis-11,14-Eicosadienoic acid. After simulated gastrointestinal 259
digestion, six fatty acids, which were not monitored in the original crucian carp soup, appeared. 260
However, two fatty acids 14- methyl palmitic acid and Lignoceric acid disappeared in the 261
snakehead soup. Comparing the fatty acid profiles of fish soup samples before and after simulated 262
gastrointestinal digestion, the sum of SFA and UFA showed almost no change in general, the 263
content of MUFA increased a little bit, the content PUFA went down a lot. The content of UFA 264
for the crucian carp soup and the snakehead soup were 62.26% and 59.35%, respectively. The two 265
major fatty acids were oleic acid and palmitic acid, accounting for 44.08%, 23.56%, 38.42% and 266
25.31% of the total fatty acids in the crucian carp soup and the snakehead soup, respectively. 267
Usually, oleic acid has the capability of lowering the content of total cholesterol and low-density 268
lipoprotein cholesterol, so it has the reputation of ‘safe fatty acid’ [32]. Palmitic acid is one of the 269
most important dietary fatty acids, which plays a crucial role in the cellular biological functions. It 270
is equipped with functions to provide energy for humans or transmitting into other fatty acids 271
through metabolism[33]. Snakehead soup contained EPA 3.02% and DHA 5.59% equal to 8.61% 272
of the total fatty acids, which was higher than that of crucian carp soup 5.36%. Eicosapentaenoic 273
acid (EPA) is an important and necessary nutritional element which can increase cell viability and 274
of the nervous and visual systems and also for its deficiency during gestation, lactation and early 276
stages of life[35]. In addition, nervonic acid was found in snakehead soup before and after 277
digestion, but it was not detected in crucian carp soup. Generally, nervonic acid is a major 278
long-chain MUFA which was found in the white matter of mammalian brains, it plays an 279
important role in the treatment of psychotic disorders and neurological development[36]. 280
Therefore, snakehead soup may have a better capability in accelerating cell growth and dramatic 281
impacts on brain functions and mental health compared to crucian carp soup. 282
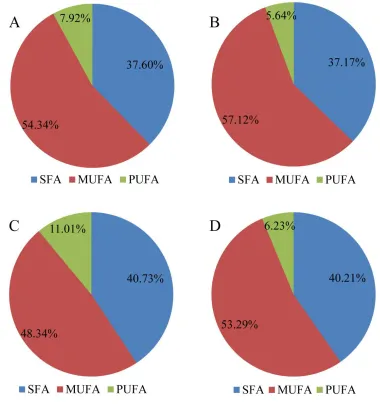
In order to investigate the contribution of fatty acids contained in SFA, MUFA and PUFA in 283
different fish soup samples, the distribution plot of different fatty acid types was shown in Fig. 1. 284
On the whole, fatty acids existed in both of the freshwater fish soups and rose after simulated 285
gastrointestinal digestion. More specifically, there were 14 SFA (37.6%), 4 MUFA (54.34%) and 5 286
PUFA (7.92%) detected in crucian carp soup. However, after digestion, 20 SFA (37.17%), 5 287
MUFA (57.12%) and 6 PUFA (5.64%) were found in crucian carp soup. For snakehead soup, there 288
were 16 SFA (40.73%), 5 MUFA (48.34%) and 5 PUFA (11.01%) identified, after 289
pepsin-pancreatin digestion, there were 17 SFA (40.21%), 5 MUFA (53.29%) and 5 PUFA (6.23%). 290
It is clear to see that the changes of fatty acids contained in the SFA and MUFA increased but the 291
trend of PUFA types decreased. The reason may be that long-chain polyunsaturated fatty acids 292
were cut off and converted to short-chain monounsaturated fatty acids and saturated fatty acids 293
after digestion. Based on Table 4, the highest content of saturated fatty acids was palmitic acid 294
which reached 25.13% and 23.59% for crucian carp soup and snakehead soup, respectively. 295
Antioxidant activities 296
DPPH was a wildly used stable free radical scavenger or hydrogen donor for assessing 298
antioxidant activities of bioactive compounds and food itself [37]. In this study, The DPPH free 299
radical scavenging activity of two kinds of freshwater fish soups with time during in-vivo 300
digestion are shown in Fig. 2. Before in-vitro digestion, the DPPH· radical scavenging activity of 301
snakehead soup was about 75.24%, which was higher than that of crucian carp soup (65.31%) that 302
means the fish soup had DPPH radical-scavenging activity to some extent without any digestion 303
processing. The reason may be some bioactive compounds existed in the fish soup, which 304
contained hydrophobic groups and it as easy to capture the DPPH radical. During pepsin digestion, 305
the DPPH radical scavenging activity showed a significant increasing trend in both fish soups, 306
crucian carp soup and snakehead soup; they separately rose by 32% and 21%. Such results may 307
be attributed to higher exposure to hydrophobic amino acid residues in the peptide chains, which 308
can increase antioxidative properties when some soluble proteins existed in the fish soup, were 309
further hydrolyzed by the peptin. However, from Fig. 2 it was clear to see that both of fish soup 310
samples exhibited dramatic decreases in DPPH radical scavenging activities during pancreatin 311
digestion (P<0.05). During the pancreatin digestion stage, the original soluble peptides contained 312
in fish soup were thoroughly hydrolyzed into shorter peptides (three peptides or four peptides) and 313
even amino acids, which had strong hydrophilicity to decrease the DPPH free radical trapping 314
capability, this phenomenon is agreed on in former research [38].. 315
Hydroxyl radical-scavenging activity 316
Oxidation and metabolism continuously produce various reactive oxygen radicals in the 317
process of an organism's life activities. However, the hydroxyl radical has a high toxicity to the 318
major reasons for aging [39]. Therefore, the hydroxyl radical scavenging capacity is usually used 320
to measure the antioxidant activity of the product. As illustrated in Fig. 3, there was no significant 321
difference in the hydroxyl radical scavenging activity between crucian carp soup and snakehead 322
soup during in-vitro simulating gastrointestinal digestion. Generally, the ability of the hydroxyl 323
radical scavenging activity showed in both fish soups kept rising during digestion, although the 324
hydroxyl radical scavenging activity of the snakehead soup was higher than that of crucian carp 325
soup. After finishing the simulated Gastrointestinal digestion, the value of the hydroxyl radical 326
scavenging activity reached 3.6 and 2.7 times versus the original values for crucian carp and 327
snakehead soup, respectively. The reason may be more peptides were generated in fish soups 328
during the simulated gastrointestinal digestion process, this lead to more effective hydrogen or 329
electron donors to capture hydroxyl radical, which supported former published work [40]. 330
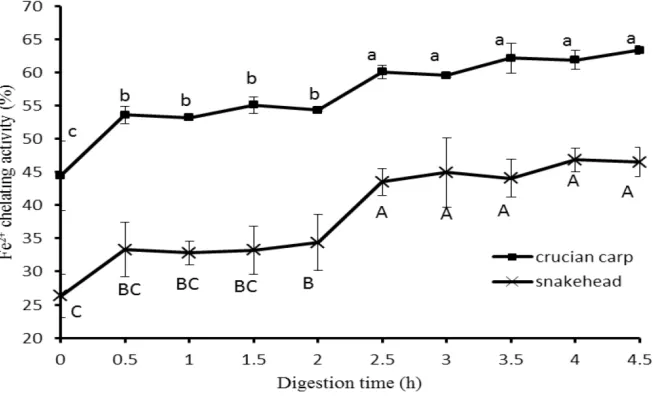
Ferrous ion chelating activity 331
Fe2+ chelation might render important antioxidative effects by impeding metal catalyzed 332
oxidation[41]. Therefore, Fe2+ chelating activity was also measured in this study to assess the free 333
radical scavenging activity of fish soup samples comprehensively. The Fe2+ chelating activity of 334
the two kinds of freshwater fish soups during in-vivo digestion was shown in Fig. 4. It can be seen 335
that there was a significant change to the metal chelating activity of the two kinds of fish soups (P 336
<0.05) within the first half hour of the digestion procedure. For crucian carp soup, the Fe2+ 337
chelating activity rose to 53.58 ± 1.33% from 44.43 ± 5.2% (20% increase) in the pepsin stage, 338
and went up to 60.05 ± 1.04% from 54.3 ± 0.11% (11% increase) in the pancreatin stage. For 339
snakehead soup, the value of metal chelating activity increased from 26.32±3.3% to 33.29±4.07% 340
pancreatin stage. It could be inferred that during the whole digestion, more free amino acids were 342
released, so more metal chelating groups exposed or generated to bind Fe2+, which lead to the 343
increase of the antioxidant activity of fish soup. 344
Reducing power 345
The reducing power activity, which may serve as a significant reflection of antioxidant 346
activity, was determined using a modified Fe (III) to Fe (II) reduction assay; the yellow color of 347
the test solution changes to various shades of green and blue depending on the reducing power of 348
the samples. The presence of antioxidants in the samples causes the reduction of the Fe3+/ 349
Ferricyanide complex to the ferrous form. Therefore, Fe2+ can be monitored by measuring of the 350
formation of Perls Prussian blue at 700 nm [42]. The reducing power of the two kinds of fish 351
soups was shown in Fig. 5, it was very clear that the reducing power of crucian carp soup is much 352
stronger than that of snakehead soup, whether it was processed by simulated gastrointestinal 353
digestion or not. Particularly, reducing power of both fish soups increased within the first hour (P 354
<0.05), then it kept the invariant mode from one hour to two hours during the pepsin digestion 355
step. In the simulated intestinal digestion step, there appeared to be a dramatic increase in 356
reducing power within half an hour after 2h of the whole digestion time. After that, the reducing 357
power of fish soups seemed to stay stable for the remaining time. Generally, the tendency of 358
reducing power in these two kinds of fish soups was consistent with the result of the Fe2+ 359
chelating activity. 360
361
Conclusion 362
unique profiles of chemical components, nutrient compositions and bioactivities. In this study, the 364
nutritional compositions and antioxidant activities of two kinds of freshwater fish soup (crucian 365
carp soup and snakehead soup) with different Dietotherapy functions were investigated. In order 366
to explore their intensive nutritional profiling, the nutritional composition changes of the fish soup 367
samples after simulated gastrointestinal digestion (pepsin and pancreatin hydrolysis) were also 368
considered. It can be concluded that the content of the total free amino acids of crucian carp soup 369
(82.51 mg/100mL) were higher than that of snakehead soup (47.54 mg/100mL) (P < 0.05), 370
especially for the flavor or umami amino acids content, the dominant amino acids were Glutamine 371
and Glycine. After simulated gastrointestinal digestion, the number of fatty acids existed in both 372
fish soups increased, the number of saturated fatty acids, unsaturated fatty acids and 373
polyunsaturated fatty acids were 20, 5, 6 and 17, 5, 5, for the crucian carp soup and the snakehead 374
soup, respectively. However, snakehead soup had more mineral contents especially for Ca 375
(0.81μg/g), Fe (0.35μg/g) and Zn (0.25μg/mg) than that of the crucian carp soup Ca (0.13μg/g), Fe 376
(0.12μg/g) and Zn (0.07μg/mg). Minerals usually play a key role in biological processes and 377
metabolism and are considered as nutrient minerals related to specific health benefits [43], so 378
snakehead soup may have unique therapeutic use in dietary supplements. Furthermore, crucian 379
carp soup showed a better antioxidant capacity compared to snakehead soup in the hydroxyl 380
radical-scavenging activity, ferrous ion chelating activity and reducing power. 381
382
Ethics 383
All animal (fish) procedures were performed in accordance with the Guidelines for Care and Use 384
the Animal Care and Use Committee of Huazhong Agricultural University. 386
387
Data Availability 388
All data associated with this paper are available in the supplementary materials. 389
Authors' Contributions 390
H.D. was involved in study design, data analysis and writing the manuscript; G.Z. performed all 391
the experiments, including the sample preparation, data analysis and writing the manuscript; Y.F. 392
and S.X were participated in data analysis, S.Z. did the gas chromatography-mass spectrometer 393
experiment, and G.S. prepared the samples. All authors gave final approval for publication. 394
Funding 395
The work was supported by National Natural Science Foundation of China (No. 31501495), 396
Fundamental Research Funds for the Central Universities (No. 2014QC015). 397
Acknowledgement 398
The authors would like to express their gratitude to Mr. Bruno Hamish Unger (University of Otago, 399
New Zealand) for the proofreading. 400
401
References 402
1. Nishimura, T.; Goto, S.; Miura, K.; Takakura, Y.; Egusa, A. S.; Wakabayashi, H., Umami 403
compounds enhance the intensity of retronasal sensation of aromas from model chicken 404
soups. Food Chem. 2016, 196, 577-83. 405
2. Jung, D. W.; Hong, J. H.; Kim, K. O., Sensory characteristics and consumer acceptability of beef 406
soup with added glutathione and/or MSG. J. Food Sci. 2010, 75, (1), S36-42. 407
3. Zhao, J.; Wang, M.; Xie, J.; Zhao, M.; Hou, L.; Liang, J.; Wang, S.; Cheng, J., Volatile flavor 408
constituents in the pork broth of black-pig. Food Chem. 2017, 226, 51-60. 409
4. Li, J.-L.; Tu, Z.-C.; Zhang, L.; Lin, D.-R.; Sha, X.-M.; Zeng, K.; Wang, H.; Pang, J.-J.; Tang, P.-P., 410
Characterization of Volatile Compounds in Grass Carp (Ctenopharyngodon idellus) Soup 411
e12995. 413
5. Bertrais, S.; Galan, P.; Renault, N.; Zarebska, M.; Preziosi, P.; Hercberg, S., Consumption of 414
soup and nutritional intake in French adults: consequences for nutritional status. Journal of 415
human nutrition and dietetics : the official journal of the British Dietetic Association 2001, 14, 416
(2), 121-8. 417
6. Zaman, M.; Naser, M. N.; Abdullah, A. T. M.; Khan, N., Nutrient contents of some popular 418
freshwater and marine fish species of Bangladesh. Bangladesh Journal of Zoology 2015, 42, 419
(2), 251. 420
7. Das, U. N., Nutritional factors in the prevention and management of coronary artery disease 421
and heart failure. Nutrition 2015, 31, (2), 283-91. 422
8. Chaudhary, R.; Saadin, K.; Bliden, K. P.; Harris, W. S.; Dinh, B.; Sharma, T.; Tantry, U. S.; Gurbel, 423
P. A., Risk factors associated with plasma omega-3 fatty acid levels in patients with suspected 424
coronary artery disease. Prostaglandins Leukot. Essent. Fatty Acids 2016, 113, 40-45. 425
9. Borow, K. M.; Nelson, J. R.; Mason, R. P., Biologic plausibility, cellular effects, and molecular 426
mechanisms of eicosapentaenoic acid (EPA) in atherosclerosis. Atherosclerosis 2015, 242, (1), 427
357-66. 428
10. Munir, M. B.; Hashim, R.; Abdul Manaf, M. S.; Nor, S. A., Dietary Prebiotics and Probiotics 429
Influence the Growth Performance, Feed Utilisation, and Body Indices of Snakehead (Channa 430
striata) Fingerlings. Trop Life Sci Res 2016, 27, (2), 111-25. 431
11. Xia, Q. Q.; Hui-Qing, X. U., Cooking Technology of Thick Crucian Carp Soup and Its Nutritional 432
Analysis. Cuisine Journal of Yangzhou University 2005, 3, 24-26. 433
12. Leeb, E.; Kulozik, U.; Cheison, S., Thermal pre-treatment of β-Lactoglobulin as a tool to steer 434
enzymatic hydrolysis and control the release of peptides. Procedia Food Science 2011, 1, 435
(Supplement C), 1540-1546. 436
13. Halim, N. R. A.; Yusof, H. M.; Sarbon, N. M., Functional and bioactive properties of fish 437
protein hydolysates and peptides: A comprehensive review. Trends Food Sci. Technol. 2016, 438
51, (Supplement C), 24-33. 439
14. Chalamaiah, M.; Dinesh, k. B.; Hemalatha, R.; Jyothirmayi, T., Fish protein hydrolysates: 440
Proximate composition, amino acid composition, antioxidant activities and applications: A 441
review. Food Chem. 2012, 135, (4), 3020-3038. 442
15. Tang, X. Y.; Chen, J.; Li, G. G.; Zhu, L. J.; Dai, Y. F., Effect of processing conditions on th 443
enutrition value of fish soup. Science and Technology of Food Industry 2008, (10), 248-251. 444
16. Zheng, L.; Ren, J.; Su, G.; Yang, B.; Zhao, M., Comparison of in vitro digestion characteristics 445
and antioxidant activity of hot- and cold-pressed peanut meals. Food Chem. 2013, 141, (4), 446
4246-52. 447
17. Folch, J.; Lees, M.; Sloane Stanley, G. H., A simple method for the isolation and purification of 448
total lipides from animal tissues. J. Biol. Chem. 1957, 226, (1), 497-509. 449
18. Jiang, S. L.; Wu, J. G.; Feng, Y.; Yang, X. E.; Shi, C. H., Correlation analysis of mineral element 450
contents and quality traits in milled rice (Oryza stavia L.). J. Agric. Food Chem. 2007, 55, (23), 451
9608-13. 452
19. Tanimoto, S.; Kawakami, K.; Morimoto, S., Changes in the Free Amino Acid Content of the 453
Shucked Oyster Crassostrea gigas Stored in Salt Water at 3. Fisheries & Aquatic Science 2013, 454
16, (2), 63-69. 455
Biochem. Physiol. 1959, 37, (8), 911-7. 457
21. Zhang, T.; Li, Y.; Miao, M.; Jiang, B., Purification and characterisation of a new antioxidant 458
peptide from chickpea (Cicer arietium L.) protein hydrolysates. Food Chem. 2011, 128, (1), 459
28-33. 460
22. Li, Y.; Jiang, B.; Zhang, T.; Mu, W.; Liu, J., Antioxidant and free radical-scavenging activities of 461
chickpea protein hydrolysate (CPH). Food Chem. 2008, 106, (2), 444-450. 462
23. Oyaizu, M., Studies on Products of Browning Reaction Antioxidative Activities of Products of 463
Browning Reaction Prepared from Glucosamine. The Japanese Journal of Nutrition and 464
Dietetics 1986, 44, (6), 307-315. 465
24. Selle, W. A., The effect of enteric-coated pancreatin on fat and protein digestion of 466
depancreatized dogs. J. Nutr. 1937, 13, (1), 15-28. 467
25. Sandstead, H. H.; Henriksen, L. K.; Greger, J. L.; Prasad, A. S.; Good, R. A., Zinc nutriture in the 468
elderly in relation to taste acuity, immune response, and wound healing. Am. J. Clin. Nutr. 469
1982, 36, (5 Suppl), 1046-59.
470
26. Rivas, A.; Pena-Rivas, L.; Ortega, E.; Lopez-Martinez, C.; Olea-Serrano, F.; Lorenzo, M. L., 471
Mineral element contents in commercially valuable fish species in Spain. 472
ScientificWorldJournal 2014, 2014, 949364. 473
27. Lansdown, A. B.; Mirastschijski, U.; Stubbs, N.; Scanlon, E.; Agren, M. S., Zinc in wound 474
healing: theoretical, experimental, and clinical aspects. Wound Repair Regen. 2007, 15, (1), 475
2-16. 476
28. Jia, P.; Zhang, W.; Liu, Q., Lake fisheries in China: Challenges and opportunities. Fisheries 477
Research 2013, 140, (1), 66-72. 478
29. Thong, H. T.; Liebert, F., Amino acid requirement of growing pigs depending on amino acid 479
efficiency and level of protein deposition. 2nd communication: threonine. Arch Anim Nutr 480
2004, 58, (2), 157-68.
481
30. Wakshlag, J. J.; Kallfelz, F. A.; Wakshlag, R. R.; Davenport, G. M., The effects of branched-chain 482
amino acids on canine neoplastic cell proliferation and death. J. Nutr. 2006, 136, (7 Suppl), 483
2007S-2010S. 484
31. Wood, J. D.; Richardson, R. I.; Nute, G. R.; Fisher, A. V.; Campo, M. M.; Kasapidou, E.; Sheard, P. 485
R.; Enser, M., Effects of fatty acids on meat quality: a review. Meat Sci 2004, 66, (1), 21-32. 486
32. Liu, Y.; Wang, Z.; Li, H.; Liang, M.; Yang, L., In vitro antioxidant activity of rice protein affected 487
by alkaline degree and gastrointestinal protease digestion. J. Sci. Food Agric. 2016, 96, (15), 488
4940-4950. 489
33. Karna, S.; Lim, W. B.; Ji, S. K.; Sang, W. K.; Bae, K. H.; Min, S. C.; Oh, H. K.; Kim, O. S.; Hong, R. 490
C.; Kim, O. J., C16-Saturated Fatty Acid Induced Autophagy in A549 Cells through 491
Topoisomerase I Inhibition. Food & Nutrition Sciences 2012, 3, (9), 1220-1227. 492
34. Kou, W.; Luchtman, D.; Song, C., Eicosapentaenoic acid (EPA) increases cell viability and 493
expression of neurotrophin receptors in retinoic acid and brain-derived neurotrophic factor 494
differentiated SH-SY5Y cells. Eur. J. Nutr. 2008, 47, (2), 104-113. 495
35. Delplanque, B.; Du, Q.; Leruyet, P.; Agnani, G.; Pages, N.; Gripois, D.; Ould-Hamouda, H.; 496
Carayon, P.; Martin, J. C., Brain docosahexaenoic acid (DHA) levels of young rats are related to 497
alpha-linolenic acid (ALA) levels and fat matrix of the diet: Impact of dairy fat. OCL - 498
Oleagineux Corps Gras Lipides 2011, 18, (6), 293-296. 499
production by microalgae and other microorganisms. Appl. Microbiol. Biotechnol. 2018, (9), 501
1-9. 502
37. Ahmad, N.; Fazal, H.; Abbasi, B. H.; Anwar, S.; Basir, A., DPPH free radical scavenging activity 503
and phenotypic difference in hepatoprotective plant (Silybum marianum L.). Toxicology & 504
Industrial Health 2013, 29, (5), 460-467. 505
38. Sachindra, N. M.; Bhaskar, N., In vitro antioxidant activity of liquor from fermented shrimp 506
biowaste. Bioresour. Technol. 2008, 99, (18), 9013-6. 507
39. Freitas, A. A.; de Magalhães, J. P., A review and appraisal of the DNA damage theory of ageing. 508
Mutat. Res. - Rev. Mut. Res. 2011, 728, (1-2), 12-22. 509
40. Qian, Z. J.; Jung, W. K.; Byun, H. G.; Kim, S. K., Protective effect of an antioxidative peptide 510
purified from gastrointestinal digests of oyster, Crassostrea gigas against free radical induced 511
DNA damage. Bioresour. Technol. 2008, 99, (9), 3365-71. 512
41. IlhamiGulcin; Zafertel, A.; EkremKirecci, Antioxidant, Antimicrobial, Antifungal, and 513
Antiradical Activities of Cyclotrichium Niveum (BOISS.) Manden and Scheng. Int. J. Food Prop. 514
2008, 11, (2), 450-471.
515
42. Ferreira, I. C. F. R.; Baptista, P.; Vilas-Boas, M.; Barros, L., Free-radical scavenging capacity and 516
reducing power of wild edible mushrooms from northeast Portugal: Individual cap and stipe 517
activity. Food Chem. 2007, 100, (4), 1511-1516. 518
43. Koyyalamudi, S. R.; Jeong, S.-C.; Manavalan, S.; Vysetti, B.; Pang, G., Micronutrient mineral 519
content of the fruiting bodies of Australian cultivated Agaricus bisporus white button 520
mushrooms. Journal of Food Composition and Analysis 2013, 31, (1), 109-114. 521
Table 1 Proximate chemical compositions of different fish soup samples before and after 523
simulated gastrointestinal digestion (g/100g) (mean ± SD) 524
Component
Crucian carp soup Snakehead soup
before after before after
Moisture 98.82±0.10b 98.2±0.25c 99.16±0.12a 98.64±0.28b
Ash 0.14±0.01c 0.095±0.00d 0.095±0.26b 0.52±0.02a
Protein 0.82±0.11b 0.91±0.05a 0.41±0.02d 0.70±0.01c
Fat 0.18±0.06a 0.17±0.01b 0.15±0.09c 0.13±0.01d
Note: Different lowercase letters in the same line indicate significant difference (p<0.05). 525
Table 2 Mineral contents of different fish soup samples before and after simulated gastrointestinal 528
digestion (mean ± SD) 529
Mineral element
Crucian carp soup Snakehead soup
before after before after
Na(mg/g) 0.13±0.03c 0.69±0.01a 0.21±0.09b 0.69±0.00a
K(mg/g) 0.79±0.05a 0.79±0.04a 0.75±0.01a 0.87±0.04a
Ca(μg/g) 0.13±0.01b 0.14±0.01b 0.81±0.01a 0.82±0.00a
Mg(μg/g) 6.12±0.497b 6.12±0.21b 6.45±0.165a 6.01±0.11c
Zn(μg/g) 0.07±0.01d 0.16±0.00c 0.25±0.12b 0.37±0.01a
Fe(μg/g) 0.12±0.01d 0.17±0.00c 0.35±0.02b 0.39±0.01a
Note: Different lowercase letters in the same line indicate significant difference (p<0.05). 530
Table 3 Free amino acid compositions of different fish soup samples before and after simulated 533
gastrointestinal digestion (mg/100mL) (mean ± SD) 534
Amino acid
Crucian carp soup Snakehead soup
before after before after
Asp# 0.04±0.01d 1.13±0.01a 0.33±0.01c 0.81±0.01b
Thr* 1.10±0.02c 1.05±0.05c 2.04±0.03b 5.01±0.04a
Ser 0.66±0.02c 1.43±0.06b 0.54±0.01c 1.87±0.01a
Glu# 1.88±0.01a 2.00±0.08a 0.82±0.06b 1.99±0.01a
Gly# 35.48±0.40a 28.75±1.18b 22.92±0.44c 21.44±0.15c
Ala# 1.43±0.01d 4±0.18c 7.04±0.18b 9.58±0.22a
Cys 0.66±0.06c 1.3±0.07b 0.3±0.22d 1.63±0.10a
Val* 0.62±0.01b 2.7±0.13a 0.45±0.01b 3.07±0.01a
Met 0.52±0.01c 1.16±0.07b 0.27±0.01d 1.57±0.02a
Ile* 0.27±0.01c 1.45±0.07a 0.16±0.02c 1.27±0.01a
Leu* 0.96±0.05c 14.42±0.60a 0.58±0.01d 10.69±0.10b
Tyr 1.88±0.04b 5.33±0.23a 0.64±0.21c 5.83±0.23a
Phe* 0.68±0.09b 15.69±0.67a 0.82±0.12b 15.53±0.08a
Lys* 0.81±0.01c 22.07±0.88a 2.23±0.06b 20.31±0.12a
Pro 0.84±0.03b 0.83±0.21b 1.16±0.01a 1.07±0.13a
His 34.58±0.45a 29.09±1.22b 6.9±0.09c 6.58±0.04c
Arg# 0.10±0.02d 18.68±0.72b 0.34±0.01c 25.45±0.21a
Total Amino
acid(TAA) 82.51±1.12 c
146.87±0.00a 47.54±1.63d 133.13±0.00b Total Essential
Amino acid(TEAA) 4.44±0.03
c 58.52±2.49a 6.28±0.02b 57.42±0.37a
EAA/TAA 5.38% 39.84% 13.21% 41.96%
Note: Different lowercase letters in the same line indicate significant difference (p<0.05). * 535
Essential amino acid. # Flavor amino acid. 536
Table 4 Fatty acid compositions of different fish soup samples before and after simulated 538
gastrointestinal digestion (relation percentage/% ) (mean ± SD) 539
Fatty acid Molecular formula
crucian carp soup snakehead fish soup
Before after before after
2- methyl butyric
acid C4:0 0.02±0.00
b 0.03±0.00b 0.03±0.00b 0.05±0.01a
Caproic acid C6:0 0.01±0.00a 0.05±0.01b 0.01±0.00b 0.01±0.00b
Caprylic acid C8:0 / 0.03±0.01 / /
Pelargonic acid C9:0 / 0.06±0.01 / /
Anchoic acid C9:0 0.10±0.01b 0.37±0.02a 0.12±0.02b 0.04±0.00b
Lauric acid C12:0 0.15±0.02b 0.4±0.02a 0.16±0.04b 0.14±0.01b
Tridecanoic acid C13:0 0.05±0.01b 0.08±0.01a 0.10±0.03a 0.09±0.01a
12- methyl
tridecanoic acid C13:0 / 0.06±0.00
a
0.10±0.02a 0.07±0.01a
Myristic acid C14:0 0.13±0.01c 2.57±0.21b 0.15±0.04c 4.19±0.29a
Pentadecanoic acid C15:0 0.61±0.03b 0.85±0.03a 0.62±0.05b 0.92±0.05a
Palmitic acid C16:0 23.56±0.43b 21.47±0.54c 25.31±0.64a 23.42±1.48b
14- methyl palmitic
acid C16:0 0.13±0.02
b 1.3±0.1a 0.20±0.02b /
Heptadecanoic acid C17:0 0.46±0.05c 0.69±0.01b 0.73±0.07b 0.8±0.02a
Stearic acid C18:0 7.22±0.05c 8.15±0.15b 8.61±0.36b 9.48±0.72a
Nonadecanoic acid C19:0 0.15±0.01b 0.14±0.01b 0.12±0.03b 0.22±0.01a
Arachidic acid C20:0 0.36±0.04b 0.35±0.01b / 0.46±0.01a
Heneicosanoic acid C21:0 / 0.4±0.02 a 0.18±0.04b 0.04±0.01c
Behenic acid C22:0 0.10±0.01b 0.13±0.02b 0.06±0.01c 0.18±0.01a
Tricosanoic acid C23:0 / 0.02±0.01a / 0.03±0.00a
Lignoceric acid C24:0 / 0.03±0.01a 0.06±0.01a 0.07±0.01a
Saturated fatty
acid(SFA) 37.60±0.77
b 37.17±0.79b 40.73±0.43a 40.21±0.5a
Myristoleic acid C14:1 0.13±0.01b 0.11±0.02c 0.15±0.04b 0.18±0.02a
540
Oleic acid C18:1n9 44.08±0.08b 48.42±1.22a 38.42±0.33c 42.81±0.57b
Erucic acid C22:1 0.62±0.03b 0.98±0.06a 0.14±0.02c 1.15±0.07a
Nervonic acid C24:1 / 0.01±0.00b 0.07±0.02a 0.08±0.02a
Monounsaturated
fatty acid(MUFA) 54.34±0.22
b
57.12±1.07a 48.34±0.83c 53.29±0.31b
Linoleic acid C18:2n6 / 0.42±0.03a 0.14±0.03b 0.06±0.01c
Arachidonic acid C20:4n6 1.52±0.03a 1.25±0.08b 1.83±0.10a 1.11±0.14b
Cis-5,8,11,14,17-Ei
cosapentaenoic acid C20:5n3 2.04±0.06
b
1.26±0.06c 3.02±0.09a 1.61±0.19c
Cis-8,11,14-Eicosat
rienoic acid C20:3 0.45±0.03
a
0.66±0.09a / /
Linolenic acid C18:3 0.61±0.01a 0.73±0.01a 0.21±0.03b /
Cis-11,14-Eicosadie
noic acid C20:2 / / / 0.03±0.00
Docosahexenoic
acid C22:6n3 3.30±0.03
b 1.33±0.12c 5.80±0.27a 3.41±0.22b
Polyunsaturated
fatty acids (PUFA) 7.92±0.12
b 5.64±0.08d 11.01±0.12a 6.23±0.23c
Unsaturated fatty
acid (UFA) 62.26±0.34
541
Note: SFA: Saturated fatty acid; MUFA: Monounsaturated fatty acid; PUFA: Polyunsaturated 542
fatty acids. 543
Fig. 1 Distribution plots of fatty acid species determined by fish soup samples (A, B, C, D was 544
crucian carp and snakehead soup before and after simulated gastrointestinal digestion, 545
respectively). 546
548
Note: different letters mean significant differences between samples (p<0.05). 549
Fig. 2 DPPH· radical scavenging activity of crucian carp soup and snakehead soup during 550
simulated gastrointestinal digestion 551
553
Note: different letters mean significant differences between samples (p<0.05). 554
Fig. 3 Hydroxyl radical-scavenging activity of crucian carp soup and snakehead soup during 555
557
Note: different letters mean significant differences between samples (p<0.05). 558
Fig. 4 Ferrous ion chelating activity of crucian carp soup and snakehead soup during simulated 559
gastrointestinal digestion process 560
562
Note: different letters mean significant differences between samples (p<0.05). 563
Fig. 5 Reducing power of crucian carp soup and snakehead soup during simulated gastrointestinal 564
digestion process 565