International Journal of Emerging Technology and Advanced Engineering
Website: www.ijetae.com (ISSN 2250-2459,ISO 9001:2008 Certified Journal, Volume 5, Issue 12, December 2015)
9
Amalgamated Optimal Load Shedding using Cuckoo Search
with Levy Flight Algorithm for Frequency and Voltage Stability
Improvement
Mwaniki C
1, Muriithi C. M
2, Abungu N. O
3, Nyakoe G. N
41,4Department of Electrical & Electronic Engineering, Jomo Kenyyatta University of Agriculture and Technology, Kenya. 2
Department of Electrical & Electronic Engineering, Technical University of Kenya, Kenya. 3Department of Electrical & Electronic Engineering, University of Nairobi, Kenya
Abstract— Load shedding schemes proposed in literature so far use voltage and frequency parameters separately. The individual consideration of these indices may not be reliable or effective, and may even lead to the over load-shedding problems. This paper proposes Cuckoo search with Levy flights (CSwLF) based algorithm that considers both the frequency and voltage parameters for solving the optimal load shedding problem. The amount of load shedding at each bus is determined by applying CSwLF to solve a nonlinear optimization problem formulated in the optimal power flow framework. The performance of the proposed CSwLF based method is tested on the operating conditions of IEEE 14-bus test system
Keywords— Metaheuristic algorithm, Voltage stability Frequency stability, cuckoo search, Levy flights.
I. INTRODUCTION
Power system stability is the ability of an electric power system, for a given initial operating condition, to regain a state of operating equilibrium after being subjected to a physical disturbance, with most system variables bounded so that practically the entire system remains intact.
Power system stability is essentially a single problem; however, the various forms of instabilities that a power system may undergo cannot be properly understood and effectively dealt with by treating it as such. Because of high dimensionality and complexity of stability problems, it helps to make simplifying assumptions to analyze specific types of problems using an appropriate degree of detail of system representation and appropriate analytical techniques. Analysis of stability, including identifying key factors that contribute to instability and devising methods of improving stable operation, is greatly facilitated by classification of stability into appropriate categories [1].
Voltage stability refers to the ability of a power system to maintain steady voltages at all buses in the system after being subjected to a disturbance from a given initial operating condition.
It depends on the ability to maintain or restore equilibrium between reactive load demand and reactive load supply from the power system. Instability that may result occurs in the form of a progressive fall or rise of voltages of some buses. A possible outcome of voltage instability is loss of load in an area, or tripping of transmission lines and other elements by their protective systems leading to cascading outages. Loss of synchronism of some generators may result from these outages or from operating conditions that violate field current limit [2], [3], [4], [5].
Frequency stability refers to the ability of a power system to maintain steady frequency following a severe system upset resulting in a significant imbalance between active power generation and active power load. It depends on the ability to maintain/restore equilibrium between system generation and load, with minimum unintentional loss of load. Instability that may result occurs in the form of sustained frequency swings leading to tripping of generating units and/or loads[2],[3],[4][5].
Rotor angle stability refers to the ability of synchronous machines of an interconnected power system to remain in synchronism after being subjected to a disturbance. It depends on the ability to maintain/restore equilibrium between electromagnetic torque and mechanical torque of each synchronous machine in the system. Instability that may result occurs in the form of increasing angular swings of some generators leading to their loss of synchronism with other generators [2], [3], [4], [5].
International Journal of Emerging Technology and Advanced Engineering
Website: www.ijetae.com (ISSN 2250-2459,ISO 9001:2008 Certified Journal, Volume 5, Issue 12, December 2015)
10
However, distinguishing between different forms is important for understanding the underlying causes of the problem in order to develop appropriate design and operating procedures. While classification of power system stability is an effective and convenient means to deal with the complexities of the problem, the overall stability of the system should always be kept in mind. Solutions to stability problems of one category should not be at the expense of another. It is essential to look at all aspects of the stability phenomenon, and at each aspect from more than one viewpoint. In this research work three aspects of system stability namely under-frequency, under-voltage and generator rescheduling was
II. CUCKOO SEARCH ALGORITHM WITH LEVY FLIGHTS
A few metaheuritic optimization techniques have been proposed to solve load shedding problem. These includes Genetic Algorithm (GA) and Particle swarm optimisation (PSO) [5],[6]. A new metaheuristic search algorithm, called cuckoo search (CS), based on cuckoo bird’s behavior has been developed by Yang and Deb [7]. However, the new stochastic search method, (CS), has not been applied to steady and dynamic state load shedding problem yet. This paper aims at establishing the applicability of this algorithm into load shedding.
The CS is derived from the bleeding behavior of some cuckoo species of laying their eggs in the nests of host birds. Female cuckoos from some species of can imitate the patterns of the eggs of a few chosen host birds. This decreases the possibility of the eggs being abandoned and, therefore, increases their re-productivity [8]. If host birds discover the eggs are not their own, they will either throw them away or simply abandon their nests and build new ones, elsewhere. Parasitic cuckoo chooses a nest where the host bird just laid its own eggs and since the cuckoo eggs hatch slightly earlier than their host eggs, the first instinct action of the first cuckoo chick hatched is to evict the host eggs. This behaviour results in increasing the cuckoo chick’s share of food provided by its host bird. In addition, Moreover, cuckoo chick can imitate the call of host chicks to gain access to more feeding opportunity [9],[10].
The Cuckoo Search models such breeding behavior. Yang and Deb discovered that the performance of the CS can be improved by using Lévy Flights instead of simple random walk. The variance of Levy flight increases exponentially as compared with random walk whose variance increases linearly. Therefore the convergence is faster with where step size is generated using Levy flights. Levy flights are more efficient in exploring unknown large scale search space [11], [12].
A solution is represented by an egg in the nest. A new solution is represented by a cuckoo egg. The CS endeavors to replace not-so-good solutions in the nests by the new and potentially better solutions represented by cuckoo’s eggs. In the simplest form, each nest has one egg. The CS is based on three rules:
• Each cuckoo randomly lays one egg at a time in a nest; • The best nest with high quality of eggs (solutions) will
carry over to the next generations;
• The number of available host nests is fixed, and a host can discover an alien egg with probability . In this case, the host bird can either throw the egg away or abandon the nest to build a completely new nest in a new location [12]. The last assumption can be approximated by a fraction pa of the n nests being replaced by new nests, having new random solutions. Based on the above-mentioned rules, the basic steps of the CS can be summarized as the pseudo code, as follows [12],[13].
Levy flights are random walk whose step length is drawn from the Levy distribution, often in terms of simple power-law formula.
( ) ( )
When generating new solutions ( ) for the ith cuckoo, the following Lévy flight is performed
( ) ( ) ( ) ( )
where is the step size.
The product means entry-wise multiplications [12]. The generation of random numbers with Levy Flights consists of two steps: the choice of random direction which should be drawn from uniform distribution and generation of steps which obey Levy distribution. The generation of these steps is achieved using Mantegna algorithm for a symmetric Levy distribution. Here symmetric that the steps can be positive and negative. [13]. In Mantegna’s algorithm, the step length s can be calculated by
| | ( )
International Journal of Emerging Technology and Advanced Engineering
Website: www.ijetae.com (ISSN 2250-2459,ISO 9001:2008 Certified Journal, Volume 5, Issue 12, December 2015)
11
In the application of the CS in load shedding, a nest has one egg. Therefore a nest or an egg represent a solution. One given solution comprises of the loads to be shed from each and every bus in the system. The number of available possible solutions was represented by the number of host nests available which was fixed. The initial solution was determined randomly with normal distribution. Its fitness was determined considering the equality and inequality constraints of the system. The best initial fitness is then carried over to the next set of solutions generated using CSwith levy flight. The fitness of the solutions is determined and the best solution is found. The worst solutions are discarded and replaced with new ones and the fitness of the new set is again determined. The best solution is again found. The fitness of this best solution is checked to see whether it is within the acceptable tolerance. If it’s not, the process starts over again
III. PROBLEM FORMULATION
During the UFLS, the following consideration need to be done:
Facilities which are essential from a safety standpoint are not shed.
The amount of load to be shed from the buses should correspond to the importance of that bus.
The total amount of load shed should be the minimum possible, but sufficient to avoid the minimum allowable frequency or voltage being overcome. This scenario is therefore formulated as an optimization problem with nonlinear constraints as follows:
∑ [ ( ) ( ) ] ( )
This equation can be written as
∑[ ]
( )
Where
Equality Constraints
∑ ( )
( )
∑ ( )
( )
Where:
and are active and reactive power generations at the
ith bus.
and , are system bus voltages magnitudes and phase angles.
and are bus admittance matrix elements
Assuming that the increasing or decreasing of the active power generation of all generators was limited to 20% of their current generation, then:
( )
( )
Assuming that all the buses have the same importance factor of 1, then:
(11)
( )
IV. METHODOLOGY
The IEEE 14-bus system was selected for the study. The data for the system is readily available. The power flow analysis was first carried out using the Newton Raphson power flow technique to establish the loading levels of various transmission lines in the system. The main idea in this step is establish the heavily loaded line whose loss is likely to affect the performance of the entire system. This analysis was carried out using Power system Analysis Toolbox (PSAT). PSAT is a Matlab toolbox for static and dynamic analysis and control of electric power systems
International Journal of Emerging Technology and Advanced Engineering
Website: www.ijetae.com (ISSN 2250-2459,ISO 9001:2008 Certified Journal, Volume 5, Issue 12, December 2015)
12
In addition, the post contingency system active and reactive power levels were captured at the appropriate time and passed to the Cuckoo Search with Levy Flight algorithm to determine how much load need to be shed considering various constraints. The algorithm was designed such that both active and reactive loads were considered for load shedding since system voltage is closely coupled to reactive power while system frequency is closely coupled to active power[14],[15],[16]. Therefore by shedding both active and reactive loads, the system voltage and frequency may be brought back to allowable levels.
After the algorithm determines the optimal load that need to be shed, the load shedding is simulated through opening of circuit breakers associated with every bus that is candidate to the load shedding. The voltages and frequencies of the most critical buses were then plotted against time. This process was carried out for different importance factors of the buses.
V. RESULTS ANALYSIS
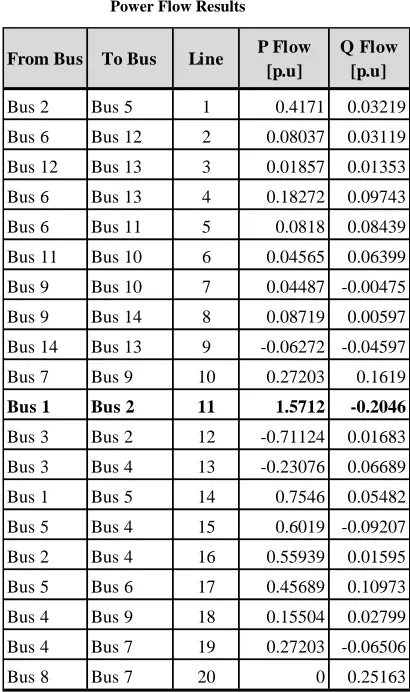
Table I shows the results obtained from power flow. Line 11 connected between Bus 1 and Bus 2 was the most heavily loaded line and its loss would be significant to the performance and equilibrium of the system. It’s for this reason that this line was chosen for investigation.
[image:4.612.355.560.145.491.2]After the loss of the transmission, the voltage and frequency drop at different rates with the voltage reaching the minimum allowable value faster than the frequency. The voltage reaches the minimum value of 0.95p.u at 10.375s while the frequency reaches the minimum value of 0.994p.u at 16.75s. This is shown in Figure 1 and Figure 2
Table I Power Flow Results
Bus 2 Bus 5 1 0.4171 0.03219
Bus 6 Bus 12 2 0.08037 0.03119
Bus 12 Bus 13 3 0.01857 0.01353
Bus 6 Bus 13 4 0.18272 0.09743
Bus 6 Bus 11 5 0.0818 0.08439
Bus 11 Bus 10 6 0.04565 0.06399 Bus 9 Bus 10 7 0.04487 -0.00475
Bus 9 Bus 14 8 0.08719 0.00597
Bus 14 Bus 13 9 -0.06272 -0.04597
Bus 7 Bus 9 10 0.27203 0.1619
Bus 1 Bus 2 11 1.5712 -0.2046
Bus 3 Bus 2 12 -0.71124 0.01683 Bus 3 Bus 4 13 -0.23076 0.06689
Bus 1 Bus 5 14 0.7546 0.05482
Bus 5 Bus 4 15 0.6019 -0.09207
Bus 2 Bus 4 16 0.55939 0.01595
Bus 5 Bus 6 17 0.45689 0.10973
Bus 4 Bus 9 18 0.15504 0.02799
Bus 4 Bus 7 19 0.27203 -0.06506
Bus 8 Bus 7 20 0 0.25163
From Bus To Bus Line P Flow [p.u]
International Journal of Emerging Technology and Advanced Engineering
Website: www.ijetae.com (ISSN 2250-2459,ISO 9001:2008 Certified Journal, Volume 5, Issue 12, December 2015)
13
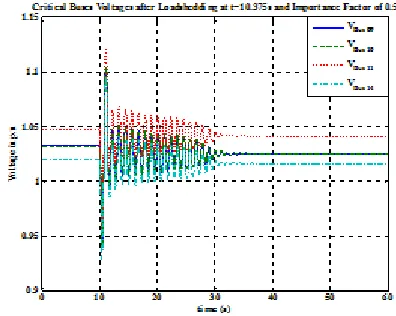
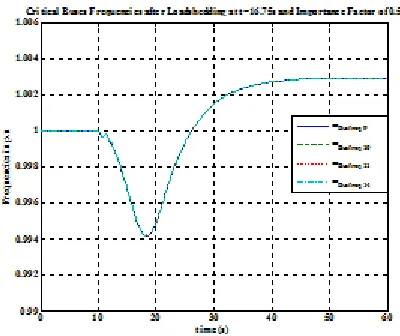
Since the rate of voltage drop was higher than frequency drop and the minimum allowable voltage occurred much earlier than the minimum allowable frequency value, under- voltage parameter was used to trigger the loadshedding at t= 10.375s. Figure 3 and Figure 4 shows the frequencies of the critical buses when loadshedding was carried out at t=10.375s. Although the frequencies rose after the loadshedding, the values were maintained within acceptable limits of ±0.006p.u. Figure5 and Figure 6 shows the voltages of the critical buses when loadshedding was carried out at t=10.375s. The figures indicates that the voltage oscillations died out with loadshedding.
[image:5.612.340.541.141.302.2]Figure 1 Critical Buses Frequencies without Loadshedding
Figure 2 Critical Buses Voltages without Loadshedding
[image:5.612.75.268.278.442.2]Figure 3 Critical Buses Frequencies after Loadshedding at t=10.375s and importance factor of 0.5
Figure 4 Critical Buses Frequencies after Loadshedding at t=10.375s and importance factor of 0.3
[image:5.612.340.543.339.495.2] [image:5.612.72.267.473.638.2] [image:5.612.341.539.532.690.2]International Journal of Emerging Technology and Advanced Engineering
Website: www.ijetae.com (ISSN 2250-2459,ISO 9001:2008 Certified Journal, Volume 5, Issue 12, December 2015)
[image:6.612.340.541.140.299.2]14
Figure 6 Critical Buses Voltages after Loadshedding at t=10.375s andimportance factor of 0.3
Figure 7 and Figure 8 shows the frequencies of the critical buses when loadshedding was carried out at t=16.75s. The figures shows that the frequencies were restored to values within the acceptable range.
Figure 7 Critical Buses Frequencies after Loadshedding at t=16.75s and importance factor of 0.5
[image:6.612.71.266.140.299.2]Figure 8 Critical Buses Frequencies after Loadshedding at t=16.75s and importance factor of 0.3
Figure 9 Critical Buses Voltages after Loadshedding at t=16.75s and importance factor of 0.5
[image:6.612.344.539.330.502.2] [image:6.612.66.266.381.549.2] [image:6.612.342.539.523.687.2]International Journal of Emerging Technology and Advanced Engineering
Website: www.ijetae.com (ISSN 2250-2459,ISO 9001:2008 Certified Journal, Volume 5, Issue 12, December 2015)
15
Figure 9 and Figure 10 shows the voltages of the critical buses when loadshedding was carried out at t=16.75s. The figures indicates that the voltage oscillations died out with loadshedding.
VI. CONCLUSION
The above results shows that either under-voltage or under-frequency parameters can be used to trigger load shedding process that will restore jointly the frequency and voltage to within acceptable values with single step of load shedding.
REFERENCES
[1] A.J. Wood, B.F. Wollenberg, Power generation, Operation and
Control, 2nd edition, New York, John Wiley & Sons, 1996.
[2] Kundur Prabha et al, Defination and Classification of Power System,
IEEE Transaction on Power Systems, vol 19, No.2, May 2004
[3] Kumar Akhani Aneel, Classsification of Power System Stability,
Engineering Articles,www.top10electrical.blogspot.co.ke
[4] http://www.wbuthelp.com/chapter_file/697.pdf
[5] Ahmad Reza Malekpour, ―Application of Constriction Factor
Particle Swarm Optimization to Optimum Load Shedding in Power System‖, Modern Applied Science Vol. 4, No. 7; July 2010 [6] Olamaei, T. Niknam & G. Gharehpetian ―Application of particle
swarm optimization for distribution feeder reconfiguration considering distributed generators‖, Electric Power Systems Research, Applied Mathematics and Computation, 2008.
[7] Yang, X. S., 2010. Engineering Optimization: An Introduction with
Metaheuristic Applications, John Wiley and Sons.
[8] Yang, X. S., and Deb, S. Engineering Optimization by Cuckoo
Search, Int. J. of Mathematical Modelling and Numerical Optimization, Vol. 1, No. 4, 2010, pp. 330– 343.
[9] Milan Tuba, Milos Subotic, Nadezda Stanarevic: ―Modified cuckoo
search algorithm for unconstrained optimization problems, Proceedings of the European Computing Conference‖ (ECC ’11), pp. 263-268, Paris, France, April 2011
[10] Payne R B, Sorenson M D, Klitz K (2005), The cuckoos. Oxford
University Press.
[11] Ehsan Valian, Shahram Mohanna and Saeed Tavakoli, ―Improved
Cuckoo Search Algorithm for Global Optimization‖ InternationaL Journal of Communications and Information Technology, IJCIT, Vol.1-No.1 Dec. 2011
[12] Yang XS, Deb S (2010) Engineering Optimization by Cuckoo
Search, Int. J. Mathematical Modelling and Numerical Optimization, 1(4):330–343.
[13] Xin-She Yang, Nature Inspired Metaheuristic Algorithms ( Second
Edition), University of Cambridge, United Kingdom, Luniver press, 2010
[14] Chakrabarti.A, Kothari.D.P, Mukhopadhyay.A.K, Reactive Power
Control and Voltage Stability in Power Transmission Systems, New Delhi, PHI Learning Private Limited,2010
[15] Mwaniki, Muriithi, Abungu,Nyakoe: ―Optimal Under-voltage Load
Shedding using Cuckoo Search with Levy Flight Algorithm for Voltage Stability Improvement‖, International Journal of Engineering Science Invention, Vol 4, issue 7, July 2015. Pp 34-41
[16] Mwaniki, Muriithi, Abungu,Nyakoe: ―Optimal Under-frequency