Article
Allocation of Energy Saving Target for Provinces
Based on Cluster Analysis in Vietnam
Dinh Van Chau 1,2*
1 Faculty of Engineering Physics and Nanotechnology, University of Engineering and Technology, Vietnam National University, Hanoi, Vietnam; [email protected]
2 2Dept. Energy Efficiency and Sustainable Development, Ministry of Industry and Trade, Vietnam; [email protected]
* Correspondence: [email protected]; Tel: +84-9142-626-66.
Abstract: In order to meet the national energy saving goals set in the Vietnam National Energy Efficiency Program in the period of 2019 – 2030 (VNEEP), the Vietnamese government has adopted a series solutions and policies to improve energy efficiency. The Vietnam’s 63 provinces will be as main actor for the national achievement in energy efficiency. Thus, understanding the province’s potentiality of energy efficiency is useful for the harmonious and sustainable development between the economy and energy systems. In this study, provincial and national data from General Statistic Office are analyzed in terms of the energy efficiency levels. With the trends of economic development and energy consumption in both national and regional levels, the Lorenz curve between Vietnamese energy consumption and GDP is investigated. The Lorenz coefficient shows the energy allocation is nether reasonable nor balanced. By using clustering method, the 63 provinces of Vietnam clustered into 7 groups that the provinces in the cluster has the similar indexes of energy efficiency i.e. ability, responsibility, potential and difficulty. The energy consumption and GDP are predicted in the period of 2019 – 2025. Based on the difference of GDP development and energy consumption levels, the target of energy efficiency for each province through clustering is set. The results show that 33 provinces included in the cluster 1, 2, 3, 4 and 6 are heavy contribution. Among them, the provinces in the cluster 2 and 3 need to focus on the industry sector in their energy saving policy. The cluster 7 included the under-developed provinces can learn development’s experiences of the provinces in the cluster 1, 2, 3 and 4 to find the best way of their future development.
Keywords: energy efficiency; clustering analysis; allocation target; Vietnam
1. Introduction
An overarching goal of Vietnam’s National Energy Efficiency Program period of 2019-30 (VNEEP) is to address energy in tandem with economy development [1]. Specific goal includes: (i) Mobilizing all domestic and international resources to promote EE&C through synchronous implementation of state management tasks and measures, technical assistance, scientific and technology research and product development, market transformation, training and development of human resources, making use of experience and support of the international community in the EE&C sector; (ii) Forming the EE&C habit in every social activity; reducing energy intensity in various professions, economic sectors; energy efficiency becoming the frequent activity for designated energy users and key energy-intensive economic sectors; orienting towards the green growth and sustainable development. In line with these goals, the central government chose to set targets under the metric of 8.0 – 10% energy saving based on the prediction of total energy consumption requested for economic development in the period. The VNEEP divided into 2 stages, in which, the first stage is in period of 2019 – 2015 with 5.0% saving energy.
To achieve a national target, targets are allocated sub-nationally to provinces, cities, sectors, and enterprises. For the VNEEP, a province’s target is set in the Province’s Action plan on energy efficiency. In a strong effort to meet the target, provinces need to use a more scientific methodology
to better estimate the varying potential for energy saving across the provinces, and to facilitate a change in development mode, as well as to achieve an equitable distribution of targets.
target, the 31 Chinese provinces are divided into 5 clusters with reduction form of 5 levels ranging from 10% to 18%.
This paper adopts the cluster analysis in multivariate statistical analysis to group the 63 Vietnamese provinces into clusters based on provincial similarities in economic, emissions, and reduction potential. Then energy saving targets are assigned to each cluster according to the equity or efficiency principle, and allocation results and policy implications are also discussed. This allocation method emphasizes the major differences between regional clusters while it ignores the minor differences within each cluster.
2. Data and methodology
2.1. Indicator selection and cluster analysis method
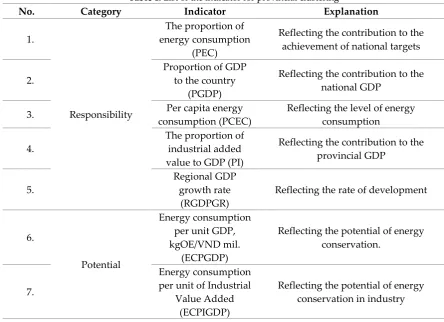
Allocation principles in energy efficiency efforts are often based on economic ability, energy consumption levels and energy saving potential. Indicators should be selected to reflect the characteristics of different provinces, especially the characteristics of energy consumption and energy conservation. There are four categories of the indicators used in the study (Table 1). The first category includes indicators reflecting the responsibility of energy conservation. If the total economic volume and energy consumption of the region are large, the responsibility of energy conservation is heavy. The second category includes the indicators reflecting the energy conservation potential or difficulty, which can take into account the energy intensity, industrial structure, urbanization rate and other indicators. The third category includes the indicators reflecting the energy conservation ability. The indicators reflect regional economic development and regional financial strength.
Table 1. List of the indicator for provincial clustering
No. Category Indicator Explanation
1.
Responsibility
The proportion of energy consumption
(PEC)
Reflecting the contribution to the achievement of national targets
2.
Proportion of GDP to the country
(PGDP)
Reflecting the contribution to the national GDP
3. Per capita energy
consumption (PCEC)
Reflecting the level of energy consumption
4.
The proportion of industrial added value to GDP (PI)
Reflecting the contribution to the provincial GDP
5.
Regional GDP growth rate
(RGDPGR)
Reflecting the rate of development
6.
Potential
Energy consumption per unit GDP, kgOE/VND mil.
(ECPGDP)
Reflecting the potential of energy conservation.
7.
Energy consumption per unit of Industrial
Value Added (ECPIGDP)
8.
The proportion of the third industry(or second industry) of
GDP (3rdIPGDP)
Reflecting economic structure, the high proportion of industry, the potential of energy conservation is relatively large.
9.
Ability
GDP per capita (PCGDP)
Reflect the level of economic development
10.
Proportion of local financial expenditure
to the country (PFE)
Reflecting the financial strength
11. Investment in fixed
assets (IFA) Reflecting the financial strength 12. Difficulty Urbanization rate
(UR)
Reflecting the change of residential energy consumption
Based on the 12 indicators above, the cluster analysis as a multi-variate statistical analysis is applied to group the similar provinces into clusters. Cluster analysis methods fall into two categories: hierarchical cluster methods and non-hierarchical cluster methods. Following suggestions from related researches [7, 8, 9], this study adopts a two-step procedure: the hierarchical cluster method is first employed to establish the proper number of clusters, then the cluster centroids from the first step are used as the initial condition of a non-hierarchical cluster method, which helps to fine-tune the results from the hierarchical cluster method.
For the first step of hierarchical cluster analysis, the method of Ward [10] is selected because it outperforms other hierarchical cluster methods when outliers are absent [7]. Some researches on regional cluster analysis also suggest that Ward's method gives the best interpretative solution [8; 9]. In Ward's method, the union of two clusters occurs when it results in minimum information loss, which is measured by an increase in error sum of squares (S). If there are n clusters, and Sk is the error sum of squares for the kth cluster, then:
(
) (
)
1 k
n
k i k i k
i
S
x
x
x
x
=
=
−
−
(Eq.1)where nk is number of provinces in the kth cluster, xi is a column vector comprising the 12 indicators of ith province,
x
k is the centroid of the kth cluster (averages of provinces within this cluster). Total error sum of square is defined as:1 n
j j
S
S
=
=
In each step, every possible fusion of two clusters is considered and the pair of clusters which lead to the least increase in S will be united. In the second step, the number and centroids of clusters generated from Ward's method are used as initial conditions for the K-means non-hierarchical method [11]. The procedure is as follows: (i) definition of k initial cluster centroids; (ii) an observation is assigned to the nearest cluster, followed by a recalculation of the new cluster centroid; (iii) repeating step 2 until the results remain unchanged.
2.2 Allocation method
Here, Gi is defined as the reduction target for the ith cluster of province, Gi is computed as
i i
G
=
a W
(Eq.2)where a is an adjustment coefficient (a>0); and Wi is the weight for the ith cluster (0<Wi<1); The relationship between provincial and nation energy efficiency target is calculated as follows:
,y
,y 1
i
y i
i y
Y
EC
EC
Y
==
(Eq.3)where ECi,y and ECy are the energy consumption of the ith cluster and of the whole nation in y year,
respectively. Yi,y and Yy are the GDP of the ith cluster and of the whole nation in y year, respectively.
In Eq. (3) the energy consumption of the ith cluster and of the whole nation in y year can be computed from their respective values in the period of 2011 – 2018 using historical trend and the reduction targets (this study is based on the 5% national energy consumption reduction target):
(
)
,y(
)
,y 1
1 5%
i1
y i i
i y
Y
EC
EC
a W
Y
= −
=
−
(Eq.4)This equation indicates that the GDP of the nation and each province should be forecasted first in order to determine the value of a. Then the reduction targets (Gi) of each cluster can be computed from Eq. (2). Finally, Wi determines the relative value of the reduction target of each cluster, and is calculated as follows:
12
,
,max i j
i j
j j
X
W
X
=
(Eq.5)where, Xj,max (j=1,2,…,12) represents the maximum value of the jth indicator in all regions; Xi,j
(j=1,2,…,12) represents the mean value of the jth indicator for the ith cluster; αj is the weight for each
indicator, which approves
12 j j
α =1
. The value of αj is based on different allocation principles.2.3. Allocation principles
The allocation target based on each province’s potential for energy saving, along with consideration of economic development level. It considers equity based on past performance and potential for improvement. The target allocation takes into account the historical variation in energy consumption trends among the provinces, and applies similar energy consumption trends for the years of the first stage of the VNEEP (2019 – 2025). Provincial energy trends are assumed to remain similar (e.g., fast-growing provinces still grow faster than slow-growing provinces). The rate of economic (GDP) growth was assigned to each province based on its growth rate trend in the past with an adjustment referring to the national growth rate.
Since this is a methodology for allocating a national target among the provinces, the analysis combines top-down national projections with bottom-up provincial in terms of energy and GDP to determine provincial intensity targets that will meet the national target. In other words, based on a chosen national intensity target level, iterative calculations are done on the provincial levels to determine provincial targets. Because the methodology is developed for the implementation of the VNEEP, it focuses on the years 2019 to 2025, with 2017 as the base year.
The methodology has three main steps: Step 1. Project National-Level Values to 2025.
Step 2. Project Provincial-Level Energy and GDP Values to 2025. Step 3. Calculate Provincial energy saving Target Allocations.
When adjusting the targets, it should be paid enough attention to the balance between the realization of regional goals and the realization of national goals. Usually for the target of energy consumption reduction rate, the trial calculation is carried out by adjusting one percent point upward or downward each time until the ideal result is obtained.
2.4. Data sources
The economic development and energy consumption in Vietnam’s 63 provinces were taken based on statistics in period of 2011 – 2018 from the General Statistic Office, Ministry of Plan and Investment, Vietnam.
3. Results
3.1. Energy efficiency development analysis
The development trends of the economy and the energy consumption in recent years is considered as main factors affect the energy efficiency of national and provincial level. Figure 1 shows the total economic development and energy consumption in Vietnam form 2011-2018.
Figure 1. The total economy development and GDP’s growth rate of Vietnam from 2010 – 2018
It can see that the tendency of economy development in Vietnam is considerably in the period of 2011 - 2018. The total GDP of Vietnam was just 2.1 million of VND billion in 2011 but in 2018, it reached 5.5 million of VND billion, about 2.6 times expanded. Vietnamese economic growth remained in stable at the range of 5.0 – 7.0% in the period. The rate is highest in 2018 with 7.08%, appositionally to the global economic growth rate. Influences of the changes in the Vietnamese government policy for restructure of economy may attribute to the stability of the GDP’s growth rate.
With the high growth of the Vietnamese economy, the demand for energy is also increasing. The energy consumption in the period of 2011 – 2018 is shown in Figure 2 confirmed that the energy consumption increased consistent with economic development. In 2018, the total energy consumption reached 62.59 million of TOE increases 32% in comparison with the consumed energy amount in 2011. Under the guidance of energy conservation and energy efficiency policies, there was an improvement of energy efficiency. The energy intensity index decreased in the period, from 17.44
0.0
1.0
2.0
3.0
4.0
5.0
6.0
7.0
8.0
2010 2011 2012 2013 2014 2015 2016 2017 2018
1.0
1.5
2.0
2.5
3.0
3.5
4.0
4.5
5.0
5.5
6.0
G
DP G
row
th
R
at
e
, %
Year
G
DP
,
m
il
.
of
NV
D
Bil
lion
s
kgOE/mil. of VND to 11.28 kgOE/mil. of VND. (see Figure 2). In the period, the reduction of the energy intensity is about 65%.
Figure 2. Vietnam’s energy consumption and energy intensity from 2010 – 2018
In Vietnam, the energy resources and the energy demand are distributed reversely. The imbalanced distribution is also a cause for different energy efficiency levels in different provinces. Through the economic development and energy consumption analysis, the fitting method of the Lorenz curve is employed to explain the relationships between energy consumption and GDP development levels in recent years. With the application of the Lorenz theory, it can represent the energy allocation situation in different provinces and also show the national energy allocation situation in different years. The overall energy allocation situation in recent years will be explored and presents in Figure 3.
0.0
5.0
10.0
15.0
20.0
25.0
2010 2011 2012 2013 2014 2015 2016 2017 2018
0.0
10.0
20.0
30.0
40.0
50.0
60.0
70.0
En
e
rg
y
in
te
n
si
ty
, kg
O
E/mi
l.
VND
Year
T
otal F
in
al E
n
er
gy Cons
u
m
p
tion
,
T
OE
Milli o n sTotal Final Energy Consumption Energy Intensity
y = -0.7003x4+ 1.7288x3- 1.6429x2+ 1.6132x
R² = 0.9999
0.0
0.1
0.2
0.3
0.4
0.5
0.6
0.7
0.8
0.9
1.0
0.0 0.1 0.2 0.3 0.4 0.5 0.6 0.7 0.8 0.9 1.0
E
n
er
gy Cons
u
m
p
tion
GDP
Figure 3. The Lorenz curve of Vietnam’s energy consumption and GDP from 2010 – 2018
The S line in Figure 3 stands for absolute equality which is an ideal energy allocation situation. The fitted curve shows a polynomial relationship between the accumulative values of GDP and final energy consumption in the period of 2010 – 2018. It can see that the Lorenz curve is a convex above the S line which resulted from the more consumed energy than the output of GDP meaning that the low energy efficiency level in the period. The area between the Lorenz curve and the absolute equality line is 0.0511 said as Lorenz coefficient represents the overall wastage caused by inefficiency allocation since the energy allocation in Vietnam was nether reasonable nor balanced. The extensive economic development and the imbalance between the energy supply and -demand can be considered as the main reasons for the low energy allocation efficiency. Based on this circumstance, it should improve the national energy intensity as the main way of energy saving allocation for the provinces.
3.2. Cluster analysis
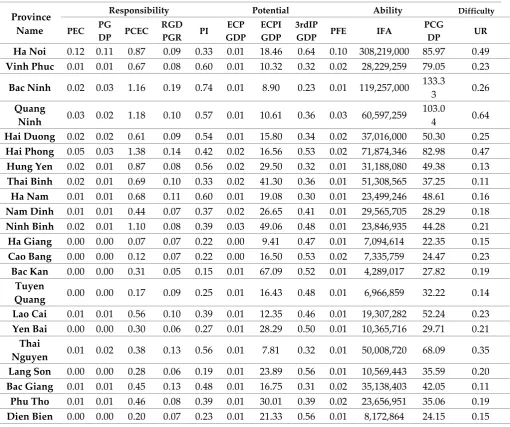
In order to eliminate the effects of different scales, the cluster analysis is carried out with standardized variables. Table 3 shows the indicator values as input for clustering. It takes note that the original data collected in the series of Statistical Yearbook for national and provincial level in period of 2011-17 published by General Statistics Office of Vietnam.
Table 2. Indicator value for provincial cluster analysis
Province Name
Responsibility Potential Ability Difficulty
PEC PG
DP PCEC RGD PGR PI
ECP GDP
ECPI GDP
3rdIP
GDP PFE IFA
PCG
DP UR
Ha Noi 0.12 0.11 0.87 0.09 0.33 0.01 18.46 0.64 0.10 308,219,000 85.97 0.49 Vinh Phuc 0.01 0.01 0.67 0.08 0.60 0.01 10.32 0.32 0.02 28,229,259 79.05 0.23
Bac Ninh 0.02 0.03 1.16 0.19 0.74 0.01 8.90 0.23 0.01 119,257,000 133.3
3 0.26
Quang
Ninh 0.03 0.02 1.18 0.10 0.57 0.01 10.61 0.36 0.03 60,597,259
103.0
4 0.64
Hai Duong 0.02 0.02 0.61 0.09 0.54 0.01 15.80 0.34 0.02 37,016,000 50.30 0.25 Hai Phong 0.05 0.03 1.38 0.14 0.42 0.02 16.56 0.53 0.02 71,874,346 82.98 0.47 Hung Yen 0.02 0.01 0.87 0.08 0.56 0.02 29.50 0.32 0.01 31,188,080 49.38 0.13 Thai Binh 0.02 0.01 0.69 0.10 0.33 0.02 41.30 0.36 0.01 51,308,565 37.25 0.11 Ha Nam 0.01 0.01 0.68 0.11 0.60 0.01 19.08 0.30 0.01 23,499,246 48.61 0.16 Nam Dinh 0.01 0.01 0.44 0.07 0.37 0.02 26.65 0.41 0.01 29,565,705 28.29 0.18 Ninh Binh 0.02 0.01 1.10 0.08 0.39 0.03 49.06 0.48 0.01 23,846,935 44.28 0.21 Ha Giang 0.00 0.00 0.07 0.07 0.22 0.00 9.41 0.47 0.01 7,094,614 22.35 0.15 Cao Bang 0.00 0.00 0.12 0.07 0.22 0.00 16.50 0.53 0.02 7,335,759 24.47 0.23 Bac Kan 0.00 0.00 0.31 0.05 0.15 0.01 67.09 0.52 0.01 4,289,017 27.82 0.19
Tuyen
Quang 0.00 0.00 0.17 0.09 0.25 0.01 16.43 0.48 0.01 6,966,859 32.22 0.14 Lao Cai 0.01 0.01 0.56 0.10 0.39 0.01 12.35 0.46 0.01 19,307,282 52.24 0.23 Yen Bai 0.00 0.00 0.30 0.06 0.27 0.01 28.29 0.50 0.01 10,365,716 29.71 0.21
Thai
Lai Chau 0.00 0.00 0.27 0.12 0.49 0.01 15.02 0.35 0.01 3,946,049 30.66 0.17 Son La 0.00 0.01 0.14 0.10 0.35 0.00 7.36 0.42 0.02 14,825,440 34.49 0.14 Hoa Binh 0.00 0.01 0.17 0.09 0.45 0.00 7.54 0.32 0.01 10,677,100 44.58 0.15 Thanh Hoa 0.06 0.02 0.99 0.09 0.44 0.03 57.14 0.41 0.04 105,175,585 37.64 0.17 Nghe An 0.01 0.02 0.24 0.08 0.30 0.01 14.90 0.47 0.03 55,381,000 34.14 0.15 Ha Tinh 0.01 0.01 0.26 0.11 0.38 0.01 13.46 0.43 0.02 30,343,995 39.63 0.18
Quang
Binh 0.01 0.01 0.46 0.07 0.24 0.01 37.16 0.57 0.02 16,532,400 34.60 0.20 Quang Tri 0.00 0.00 0.29 0.07 0.26 0.01 25.96 0.52 0.01 12,067,441 39.25 0.30
Thua
Thien-Hue 0.01 0.01 0.31 0.08 0.34 0.01 19.53 0.54 0.01 18,849,760 36.67 0.49 Da Nang 0.02 0.01 1.01 0.07 0.34 0.02 23.15 0.64 0.02 36,042,929 72.02 0.88
Quang
Nam 0.01 0.01 0.30 0.05 0.44 0.01 12.16 0.42 0.03 24,055,527 55.86 0.24 Quang
Ngai 0.01 0.01 0.23 0.01 0.50 0.00 5.29 0.31 0.02 21,600,359 50.84 0.15 Binh Dinh 0.01 0.01 0.37 0.07 0.33 0.01 15.13 0.40 0.01 31,481,000 41.27 0.31 Phu Yen 0.00 0.01 0.19 0.07 0.30 0.01 6.06 0.45 0.01 13,116,400 35.94 0.29
Khanh
Hoa 0.01 0.01 0.44 0.08 0.33 0.01 11.97 0.55 0.01 36,748,000 57.07 0.45 Ninh
Thuan 0.00 0.00 0.35 0.09 0.21 0.01 31.60 0.40 0.01 6,777,700 33.07 0.36 Binh
Thuan 0.00 0.01 0.16 0.07 0.30 0.00 9.98 0.38 0.01 20,026,152 44.95 0.39 Kon Tum 0.00 0.00 0.23 0.08 0.27 0.01 20.29 0.42 0.01 10,210,013 34.24 0.36 Gia Lai 0.00 0.01 0.13 0.08 0.23 0.00 4.61 0.45 0.01 18,952,056 38.59 0.30 Dak Lak 0.00 0.01 0.15 0.07 0.14 0.00 14.46 0.45 0.02 22,777,564 34.64 0.24 Dak Nong 0.00 0.00 0.10 0.08 0.17 0.00 6.06 0.38 0.01 9,697,057 39.71 0.15 Lam Dong 0.00 0.01 0.18 0.08 0.17 0.00 4.88 0.35 0.01 23,500,000 54.86 0.39
Binh
Phuoc 0.01 0.01 0.44 0.07 0.37 0.01 15.66 0.36 0.01 18,433,920 53.06 0.20 Tay Ninh 0.01 0.01 0.59 0.08 0.39 0.01 17.23 0.35 0.01 22,626,374 56.87 0.22
Binh
Duong 0.06 0.04 1.55 0.09 0.70 0.01 16.80 0.26 0.02 81,284,638
119.7
5 0.76
Dong Nai 0.12 0.05 2.22 0.08 0.65 0.03 36.93 0.25 0.03 69,170,731 92.37 0.35 Ba
Ria-Vung Tau 0.02 0.05 0.86 -0.04 0.80 0.00 2.55 0.15 0.01 39,627,000
249.4
9 0.52
Ho Chi
Minh city 0.12 0.17 0.81 0.08 0.30 0.01 13.02 0.70 0.05 365,710,000
122.7
1 0.81
Long An 0.02 0.02 0.83 0.10 0.47 0.01 24.57 0.34 0.02 26,237,219 61.26 0.18 Tien
Giang 0.01 0.01 0.46 0.08 0.30 0.01 29.33 0.30 0.01 29,138,940 43.65 0.16 Ben Tre 0.01 0.01 0.31 0.07 0.17 0.01 35.22 0.47 0.01 15,293,000 31.08 0.11 Tra Vinh 0.00 0.01 0.20 0.12 0.32 0.01 14.18 0.32 0.01 20,697,998 39.22 0.18 Vinh Long 0.00 0.01 0.15 0.06 0.18 0.00 16.94 0.47 0.01 12,604,154 41.28 0.17
Dong
Thap 0.01 0.01 0.26 0.06 0.24 0.01 28.51 0.39 0.01 16,670,744 36.28 0.18 An Giang 0.01 0.01 0.18 0.05 0.15 0.01 23.35 0.55 0.02 12,372,899 33.98 0.31
Kien
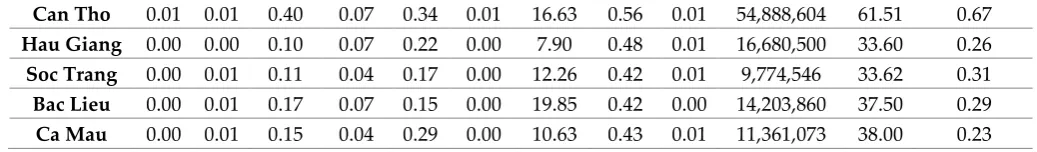
Can Tho 0.01 0.01 0.40 0.07 0.34 0.01 16.63 0.56 0.01 54,888,604 61.51 0.67 Hau Giang 0.00 0.00 0.10 0.07 0.22 0.00 7.90 0.48 0.01 16,680,500 33.60 0.26 Soc Trang 0.00 0.01 0.11 0.04 0.17 0.00 12.26 0.42 0.01 9,774,546 33.62 0.31 Bac Lieu 0.00 0.01 0.17 0.07 0.15 0.00 19.85 0.42 0.00 14,203,860 37.50 0.29 Ca Mau 0.00 0.01 0.15 0.04 0.29 0.00 10.63 0.43 0.01 11,361,073 38.00 0.23
The dendrogram obtained by using the Ward's method for the lustering of the 63 provinces shows in Figure 4. It indicates that provinces can be grouped into 7 clusters. The detail provinces included in each cluster is shown in Table 3. The centroids of the 7 clusters will be used as initial condition for the K-means method, where the same result is still obtained (see Table 4), confirming that the result from Ward's method is reasonable.
Table 3. Results of the cluster analysis
Cluster Number of provinces
Province included
1 2 Ha Noi, Ho Chi Minh city.
2 3 Ninh Binh, Thanh Hoa, Dong Nai.
3 4 Quang Ninh, Binh Duong, Bac Ninh, Ba Ria-Vung Tau.
4 9 Hung Yen, Long An, Vinh Phuc, Hai Duong, Ha Nam, Nam Dinh, Phu Tho, Tien Giang, Thai Binh.
5 13
Bac Giang, Lai Chau, Thai Nguyen, Son La, Ha Tinh, Tra Vinh, Hoa Binh, Binh Phuoc, Tay Ninh, Lao Cai, Nghe An, Quang Nam, Quang
Ngai.
6 5 Binh Thuan, Khanh Hoa, Can Tho, Hai Phong, Da Nang.
7 27
Lang Son, Dien Bien, Yen Bai, Quang Tri, An Giang, Quang Binh, Ben Tre, Dong Thap, Kon Tum, Kien Giang, Ninh Thuan, Bac Kan, Binh
Thuan, Lam Dong, Dak Lak, Vinh Long, Soc Trang, Bac Lieu, Ha Giang, Tuyen Quang, Cao Bang, Gia Lai, Hau Giang, Phu Yen, Ca
Mau, Dak Nong, Bình Định.
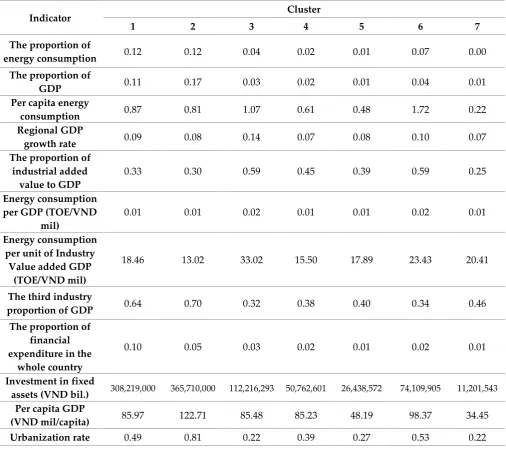
Table 4. Mean values of indicator at the cluster centroids
Indicator Cluster
1 2 3 4 5 6 7
The proportion of
energy consumption 0.12 0.12 0.04 0.02 0.01 0.07 0.00
The proportion of
GDP 0.11 0.17 0.03 0.02 0.01 0.04 0.01
Per capita energy
consumption 0.87 0.81 1.07 0.61 0.48 1.72 0.22
Regional GDP
growth rate 0.09 0.08 0.14 0.07 0.08 0.10 0.07
The proportion of industrial added
value to GDP
0.33 0.30 0.59 0.45 0.39 0.59 0.25
Energy consumption per GDP (TOE/VND
mil)
0.01 0.01 0.02 0.01 0.01 0.02 0.01
Energy consumption per unit of Industry Value added GDP
(TOE/VND mil)
18.46 13.02 33.02 15.50 17.89 23.43 20.41
The third industry
proportion of GDP 0.64 0.70 0.32 0.38 0.40 0.34 0.46
The proportion of financial expenditure in the
whole country
0.10 0.05 0.03 0.02 0.01 0.02 0.01
Investment in fixed
assets (VND bil.) 308,219,000 365,710,000 112,216,293 50,762,601 26,438,572 74,109,905 11,201,543 Per capita GDP
(VND mil/capita) 85.97 122.71 85.48 85.23 48.19 98.37 34.45
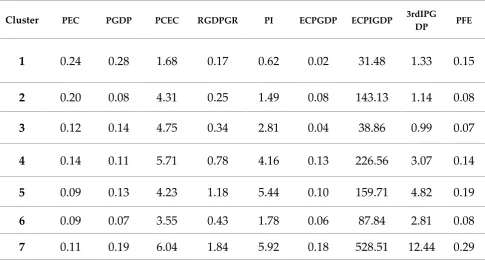
Clusters 1 is region with a developed economy but with low reduction potential. Cluster 1 includes two municipalities, i.e., Ha Noi and Ho Chi Minh city, and represents the most advanced level of economy, with its per capita GDP over VND 90 mil. and the highest sharing of the total energy consumption (24%) as well as of GDP (28%) those are much higher than the other 6 clusters. This high level of living standard also leads to high per capita energy consumption. However, its economic structure and energy efficiency are relatively optimal, indicating a low reduction potential. Cluster 2 includes 3 provinces, which are featured by large scale industry and high total energy consumption which shares 20% of the national energy consumption whistle contributed 8.0% share of GDP. The cluster 3 seems to be energy efficiency likely as the cluster 1 because of the GDP share contribution is higher than the energy consumption share. It also takes note that the number of provinces in this cluster is two times higher than in the cluster 1. Cluster 7 has numerous of provinces, taking almost 1/3 number of the Vietnam’s provinces (27/63), however, it is less contribution in the GDP although energy consumption takes about 11% of the national level. It is noticeable for cluster 6, which included 5 provinces. A characteristic of these provinces is that the service sector takes high share in the economy. However, the cluster’s energy consumption share is higher than its contribution on national GDP may attribute to problems in behavior’s energy use. Table 5 shows the indicator values for all clusters.
Table 5. Indicator values for the clusters
Cluster PEC PGDP PCEC RGDPGR PI ECPGDP ECPIGDP 3rdIPG
DP PFE
1
0.24
0.28
1.68
0.17
0.62
0.02
31.48
1.33
0.15
2
0.20
0.08
4.31
0.25
1.49
0.08
143.13
1.14
0.08
3
0.12
0.14
4.75
0.34
2.81
0.04
38.86
0.99
0.07
4
0.14
0.11
5.71
0.78
4.16
0.13
226.56
3.07
0.14
5
0.09
0.13
4.23
1.18
5.44
0.10
159.71
4.82
0.19
6
0.09
0.07
3.55
0.43
1.78
0.06
87.84
2.81
0.08
7
0.11
0.19
6.04
1.84
5.92
0.18
528.51
12.44
0.29
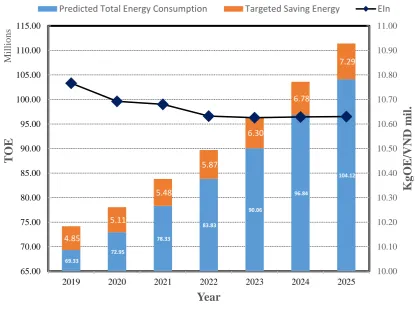
3.3. National-level projection of energy consumption and energy saving.
Figure 5. National-level Projection of energy consumption, saving and energy intensity
In national level, the energy consumption increases yearly and will reach about 104 mil. TOE. Assignment of 7% energy saving, the total energy saving in the period is about 41.67 mil. TOE. The energy intensity will decrease yearly from 2019 to 2023 and be level-off in the remaining year. In general, the improvement of the energy intensity will be not much due to small lifting the economy structure.
3.4. Allocation of energy efficiency target for the provinces
Under the national socio-economic development defined in the national-level projection in cooperation with historical trend of each province, the regional energy consumption and the socio-economic development is projection. Table 6 shows the predicted amount of the final energy consumption for each province. The predicted results confirm the consistency to the province clustering. Provinces included in the cluster 1, 2 and 3 are main players in the future energy consumption of Vietnam. As shown in Table 6, the energy consumption for each province increases yearly in the period. All provinces, the energy consumption in 2015 will be double in comparison in 2019. It means that the regional economic development still bases the intensive energy consumption.
Table 6. The predicted energy consumption for each province in the period of 2019 – 2025 (in TOE)
2019 2020 2021 2022 2023 2024 2025
Ha
Noi 9,017,766 10,042,358 11,183,365 12,454,012 13,869,028 15,444,819 17,199,649 Vinh
Phuc 1,190,791 1,305,978 1,432,307 1,570,856 1,722,808 1,889,458 2,072,228 Bac
Ninh 670,599 812,131 983,535 1,191,113 1,442,503 1,746,949 2,115,649
69.33
72.95
78.33
83.83
90.06
96.84
104.12
4.85
5.11
5.48
5.87
6.30
6.78
7.29
10.00 10.10 10.20 10.30 10.40 10.50 10.60 10.70 10.80 10.90 11.00
2019 2020 2021 2022 2023 2024 2025
65.00 70.00 75.00 80.00 85.00 90.00 95.00 100.00 105.00 110.00 115.00
K
gOE
/VND
m
il
.
Year
T
OE
Millio
n
s
Quang
Ninh 12,209,577 14,004,249 16,062,718 18,423,760 21,131,848 24,237,996 27,800,713 Hai
Duong 3,115,964 3,482,698 3,892,595 4,350,735 4,862,795 5,435,122 6,074,810 Hai
Phong 5,617,010 6,544,701 7,625,607 8,885,032 10,352,461 12,062,247 14,054,417 Hung
Yen 849,051 950,713 1,064,546 1,192,010 1,334,736 1,494,551 1,673,501 Thai
Binh 502,116 566,303 638,694 720,340 812,423 916,277 1,033,407 Ha
Nam 1,156,384 1,335,866 1,543,207 1,782,729 2,059,427 2,379,072 2,748,329 Nam
Dinh 340,916 376,139 415,000 457,876 505,182 557,376 614,962
Ninh
Binh 2,927,064 3,282,853 3,681,888 4,129,426 4,631,363 5,194,311 5,825,687 Ha
Giang 47,165 53,468 60,614 68,714 77,896 88,306 100,107
Cao
Bang 155,522 171,991 190,203 210,344 232,618 257,250 284,491
Bac
Kan 63,552 71,144 79,644 89,159 99,811 111,736 125,085
Tuyen
Quang 778,963 884,415 1,004,144 1,140,080 1,294,419 1,469,651 1,668,606 Lao
Cai 302,364 353,322 412,869 482,451 563,760 658,772 769,797 Yen
Bai 898,748 1,004,227 1,122,086 1,253,777 1,400,923 1,565,338 1,749,050 Thai
Nguye n
1,891,718 2,276,209 2,738,847 3,295,516 3,965,328 4,771,279 5,741,039
Lang
Son 619,681 693,217 775,479 867,504 970,448 1,085,609 1,214,436 Bac
Giang 2,755,421 3,260,703 3,858,642 4,566,230 5,403,574 6,394,468 7,567,069 Phu
Tho 902,888 1,013,270 1,137,148 1,276,171 1,432,190 1,607,283 1,803,781 Dien
Bien 115,410 128,964 144,110 161,035 179,947 201,081 224,697
Lai
Chau 49,809 60,190 72,735 87,895 106,215 128,352 155,104
Son La 190,824 226,716 269,359 320,022 380,215 451,729 536,695 Hoa
Binh 205,644 235,150 268,889 307,469 351,584 402,029 459,712
Thanh
Hoa 3,478,599 4,003,904 4,608,535 5,304,472 6,105,503 7,027,498 8,088,724 Nghe
An 909,522 1,040,597 1,190,561 1,362,138 1,558,440 1,783,033 2,039,993 Ha
Tinh 2,559,503 3,043,808 3,619,752 4,304,674 5,119,196 6,087,841 7,239,771 Quang
Quang
Tri 94,908 108,411 123,835 141,454 161,579 184,567 210,826 Thua
Thien-Hue
416,696 469,986 530,091 597,882 674,343 760,583 857,851
Da
Nang 651,707 736,685 832,745 941,330 1,064,074 1,202,822 1,359,663 Quang
Nam 660,156 770,883 900,181 1,051,167 1,227,478 1,433,360 1,673,775 Quang
Ngai 3,315,835 3,727,322 4,189,874 4,709,827 5,294,305 5,951,315 6,689,859 Binh
Dinh 559,803 626,898 702,034 786,175 880,401 985,921 1,104,087 Phu
Yen 75,886 85,915 97,270 110,125 124,680 141,157 159,813 Khanh
Hoa 332,571 375,871 424,810 480,119 542,630 613,281 693,129 Ninh
Thuan 613,363 695,618 788,903 894,698 1,014,681 1,150,753 1,305,074 Binh
Thuan 492,199 558,226 633,109 718,038 814,360 923,604 1,047,501 Kon
Tum 71,206 81,557 93,413 106,992 122,545 140,359 160,762 Gia
Lai 810,375 931,652 1,071,079 1,231,372 1,415,654 1,627,515 1,871,082 Dak
Lak 416,740 466,538 522,287 584,697 654,565 732,781 820,344 Dak
Nong 115,157 136,149 160,968 190,312 225,005 266,022 314,517
Lam
Dong 583,821 671,884 773,231 889,866 1,024,093 1,178,567 1,356,342 Binh
Phuoc 784,451 901,571 1,036,177 1,190,881 1,368,681 1,573,028 1,807,884 Tay
Ninh 357,055 405,017 459,422 521,135 591,137 670,543 760,615
Binh
Duong 2,004,434 2,282,318 2,598,725 2,958,998 3,369,216 3,836,305 4,368,148 Dong
Nai 3,916,494 4,407,172 4,959,325 5,580,654 6,279,826 7,066,594 7,951,933 Ba
Ria-Vung
Tau
1,616,462 1,684,554 1,755,514 1,829,464 1,906,528 1,986,839 2,070,533
Ho Chi Minh
city
6,144,729 6,923,308 7,800,538 8,788,919 9,902,534 11,157,252 12,570,951
Long
An 383,633 444,156 514,227 595,354 689,279 798,022 923,920 Tien
Ben
Tre 193,391 214,288 237,444 263,101 291,531 323,034 357,940 Tra
Vinh 3,349,935 3,867,035 4,463,956 5,153,019 5,948,446 6,866,656 7,926,603 Vinh
Long 88,270 97,823 108,411 120,145 133,150 147,561 163,533
Dong
Thap 112,213 124,388 137,883 152,843 169,425 187,807 208,183
An
Giang 145,961 160,145 175,707 192,781 211,514 232,068 254,619
Kien
Giang 959,997 1,059,947 1,170,303 1,292,150 1,426,682 1,575,221 1,739,225 Can
Tho 144,715 159,318 175,395 193,094 212,578 234,029 257,645 Hau
Giang 24,956 27,699 30,743 34,122 37,873 42,035 46,655
Soc
Trang 40,189 44,294 48,819 53,806 59,302 65,359 72,035
Bac
Lieu 102,300 113,163 125,180 138,472 153,176 169,441 187,433
Ca
Mau 93,017 102,088 112,044 122,971 134,964 148,126 162,572 The VNEEP has set the goal of the national level target is 7% saving of total energy consumption in the period of 2019 – 2025, the 63 provinces are main actors to implementation of the national target. Therefore, allocation of the national target to the provincial target ensures that sum of the province saving energy amount has to meet the national energy saving amount. The allocation mechanism has to be based on the provincial characteristic of energy efficiency such as responsibility, ability, potential, difficulty.
Using MATLAB genetic algorithm programming, the amount of saving energy of each province was iteratively calculated and re-examined to meet the national goal. Detail calculation results are shown in Table 7.
Table 7. Result of target allocation
Cluster Number of
provinces Province included
Allocated target in %
1 2 Ha Noi, Ho Chi Minh city. 7.25
2 3 Ninh Binh, Thanh Hoa, Dong Nai. 7.90
3 4 Quang Ninh, Binh Duong, Bac Ninh, Ba
Ria-Vung Tau. 7.65
4 9
Hung Yen, Long An, Vinh Phuc, Hai Duong, Ha Nam, Nam Dinh, Phu Tho, Tien Giang,
Thai Binh.
7.25
5 13
Bac Giang, Lai Chau, Thai Nguyen, Son La, Ha Tinh, Tra Vinh, Hoa Binh, Binh Phuoc, Tay Ninh, Lao Cai, Nghe An, Quang Nam, Quang
Ngai.
6.75
6 5 Binh Thuan, Khanh Hoa, Can Tho, Hai Phong,
Da Nang. 7.0
7 27
Lang Son, Dien Bien, Yen Bai, Quang Tri, An Giang, Quang Binh, Ben Tre, Dong Thap, Kon Tum, Kien Giang, Ninh Thuan, Bac Kan, Binh Thuan, Lam Dong, Dak Lak, Vinh Long, Soc
Trang, Bac Lieu, Ha Giang, Tuyen Quang, Cao Bang, Gia Lai, Hau Giang, Phu Yen, Ca Mau,
Dak Nong, Bình Định.
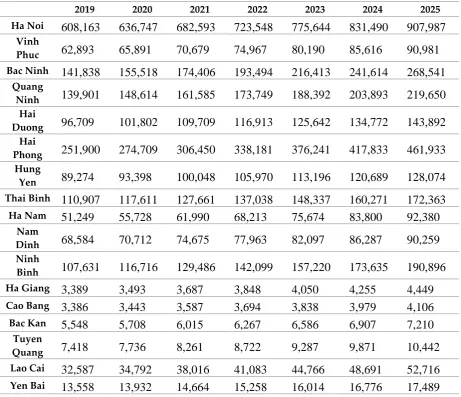
As seen in Table 7, each cluster assigns different energy saving target. There are 28 provinces included in the cluster 1, 2, and 3 assigned higher rate of saving energy than the national rate. These provinces had high economic development level and high energy consumption. Among those cluster, the cluster 1 included Ha Noi and Ho Chi Minh city contributes highest share for national GDP assigned lower energy saving rate than the cluster 2 and 3. It is reasonable assignment because of their high percentage of energy consumption in service sector (logistic, transportation, commercial etc.). The cluster 2 and 3 assigned 7.90 % and 7.65 %, respectively. The provinces include in these clusters had economic development based secondary industry. The provinces in the cluster 4 has restructured economy based on industrialization recently and will play important role in the future of Vietnam energy consumption. The cluster 5 included Hai Phong, Can Tho, Da Nang, and Binh Thuan province is allocated 7.0% equal to the national goal level because these provinces had economic development strongly focused on services. The cluster 4 and 7 are set 6.75% and 4.50% saving target, respectively. Specially, the cluster 7 included 27 provinces assigns only 4.75% energy saving rate. These provinces are lowest level of economy development with economy feature is only based on the primary industry. Table 8 shows the amount of saving energy for provinces consistency with the 7.00% national energy saving target in the period of 2019 – 2025.
Table 8. Amount of saving energy for each province in the period of 2019 – 2025 (in TOE)
2019 2020 2021 2022 2023 2024 2025
Ha Noi
608,163
636,747
682,593
723,548
775,644
831,490
907,987
VinhPhuc
62,893
65,891
70,679
74,967
80,190
85,616
90,981
Bac Ninh141,838
155,518
174,406
193,494
216,413
241,614
268,541
Quang
Ninh
139,901
148,614
161,585
173,749
188,392
203,893
219,650
HaiDuong
96,709
101,802
109,709
116,913
125,642
134,772
143,892
HaiPhong
251,900
274,709
306,450
338,181
376,241
417,833
461,933
HungYen
89,274
93,398
100,048
105,970
113,196
120,689
128,074
Thai Binh110,907
117,611
127,661
137,038
148,337
160,271
172,363
Ha Nam
51,249
55,728
61,990
68,213
75,674
83,800
92,380
NamDinh
68,584
70,712
74,675
77,963
82,097
86,287
90,259
NinhBinh
107,631
116,716
129,486
142,099
157,220
173,635
190,896
Ha Giang3,389
3,493
3,687
3,848
4,050
4,255
4,449
Cao Bang
3,386
3,443
3,587
3,694
3,838
3,979
4,106
Bac Kan
5,548
5,708
6,015
6,267
6,586
6,907
7,210
TuyenQuang
7,418
7,736
8,261
8,722
9,287
9,871
10,442
Lao Cai
32,587
34,792
38,016
41,083
44,766
48,691
52,716
Thai
Nguyen
47,914
56,188
67,296
79,791
95,325
113,692
135,030
Lang Son12,032
12,353
12,990
13,505
14,162
14,823
15,440
Bac
Giang
64,844
69,849
76,987
83,930
92,255
101,221
110,552
Phu Tho55,592
58,139
62,257
65,918
70,389
75,022
79,584
Dien
Bien
6,373
6,699
7,209
7,672
8,233
8,819
9,403
Lai Chau
11,666
13,288
15,468
17,820
20,689
23,980
27,673
Son La
13,813
14,378
15,326
16,152
17,168
18,214
19,232
Hoa Binh
11,714
12,229
13,072
13,817
14,729
15,671
16,595
ThanhHoa
336,574
354,550
382,350
407,742
438,490
470,679
502,878
Nghe An60,592
62,923
66,916
70,360
74,615
78,977
83,200
Ha Tinh
24,664
24,769
25,494
25,935
26,616
27,262
27,787
QuangBinh
22,252
22,885
24,107
25,106
26,372
27,650
28,851
QuangTri
10,174
10,509
11,117
11,627
12,266
12,915
13,533
ThuaThien-Hue
27,595
28,662
30,488
32,063
34,009
36,005
37,938
Da Nang
84,201
88,109
94,401
100,010
106,852
113,949
120,947
QuangNam
43,899
50,562
59,499
69,302
81,344
95,316
111,211
QuangNgai
22,979
23,579
24,784
25,753
26,991
28,235
29,395
BinhDinh
353
362
381
396
415
434
453
Phu Yen
112
118
127
136
146
157
169
Khanh
Hoa
39,538
40,225
41,929
43,202
44,903
46,581
48,089
NinhThuan
11,889
12,277
12,985
13,578
14,321
15,075
15,794
BinhThuan
15,392
16,002
17,037
17,934
19,040
20,176
21,279
Kon Tum6,889
7,201
7,707
8,156
8,704
9,273
9,831
Gia Lai
10,175
10,515
11,129
11,646
12,291
12,948
13,575
Dak Lak
15,478
15,928
16,788
17,494
18,387
19,289
20,139
DakNong
3,960
4,256
4,681
5,092
5,585
6,114
6,664
Lam
Dong
13,304
13,885
14,838
15,679
16,708
17,772
18,815
BinhPhuoc
33,658
34,668
36,575
38,147
40,131
42,138
44,034
Tay Ninh54,019
56,821
61,189
65,158
69,971
75,000
80,015
Binh
Dong Nai
634,731
662,537
708,124
748,351
797,598
848,491
898,388
BaRia-Vung Tau
68,905
63,636
60,361
56,530
53,451
50,433
47,333
Ho ChiMinh city
605,601
632,994
677,452
716,902
765,101
815,012
864,102
Long An110,793
117,284
127,087
136,184
147,159
158,723
170,403
Tien
Giang
70,045
73,267
78,469
83,099
88,749
94,607
100,378
Ben Tre21,553
22,206
23,434
24,450
25,729
27,023
28,248
Tra Vinh
17,312
18,426
20,072
21,625
23,493
25,474
27,496
VinhLong
8,732
9,005
9,511
9,932
10,461
10,997
11,505
DongThap
24,458
25,096
26,379
27,411
28,730
30,055
31,291
An Giang21,382
21,632
22,426
22,980
23,755
24,508
25,162
Kien
Giang
53,808
56,128
59,951
63,315
67,437
71,693
75,860
Can Tho40,651
42,891
46,328
49,483
53,299
57,303
61,321
Hau
Giang
4,121
4,244
4,478
4,670
4,913
5,158
5,390
Soc Trang
7,673
7,719
7,957
8,108
8,334
8,550
8,729
Bac Lieu
8,545
8,738
9,154
9,480
9,903
10,325
10,713
Ca Mau
10,097
10,232
10,625
10,905
11,291
11,668
12,000
Grand
4,863,109
5,118,069
5,518,073
5,887,049
6,340,115
6,821,503
7,331,133
NationalTarget
4,852,954
5,106,651
5,483,135
5,868,063
6,304,246
6,779,126
7,288,525
4. Discussion
The economic development and energy consumption are two core variables effect on Vietnamese energy efficiency. Based on the actual energy efficiency situation, the Vietnam government has improved the energy efficiency for 15 years, started from 2006 with the Vietnam National Energy Efficiency Program. The new era of the Vietnam energy efficiency strategy started in early of 2019 and will implement continuously until 2030. Three main aspects, i.e., policy, technology and industry are main coordinators for improvement of the feature of the Vietnam energy efficiency. It also confirms that provinces play an important actor for achievement of the national energy efficiency target, therefore, the allocation of the national target to provinces is need.
The allocation mechanism proposed mainly considers the regional local economic development level, energy consumption historical trend and tendency of economic development combined with the required energy consumption. Based on the calculated energy consumption requirement and analysis of regional economic structure, this work suggest a mixture of economic-oriented and energy-oriented method to build up The 5-year socio-economic development Plan in terms of sustainable development and energy consumption reform for each province from 2021 to 2025. The provincial government can distinguish, anticipate and obligate indicators to restrict energy consumption as well as evaluate the province’s energy efficiency within the possibility. It also reduces the pressure on energy saving for low developed provinces in the short term and finally archive the long-term goal of Vietnam’s energy secure strategy.
Understanding the potentiality of energy efficiency is useful for the harmonious and sustainable development between the economy and energy systems. In this study, provincial and national data are collected to analyze the energy efficiency levels in Vietnam. The trends of national and regional economic development and energy consumption are used to predict the energy consumption requirement need for economic development in the period of 2019 – 2025. It also reveals that the energy saving allocation in Vietnam is uneven. Combined with the different GDP development and energy consumption levels, the target regions of energy efficiency analysis are newly divided via a cluster analysis method. The provinces are classified into 7 clusters. Based on this, a quantitative calculation method is employed to estimate the amount of saving energy of each province. The results show that 33 provinces included in the cluster 1, 2, 3, 4 and 6 are heavy contribution. Among them, the provinces in the cluster 2 and 3 need to focus on the industry sector in their energy saving policy. The cluster 7 included the under-developed provinces can learn development’s experiences of the provinces in the cluster 1, 2, 3 and 4 to find the best way of their future development.
Acknowledgments: This study used a partial supported data from the World Bank in Vietnam.
Conflicts of Interest: The authors declare no conflicts of interest.
References
1. Vietnam National Program of Energy Efficiency in the period of 2019 – 2019 (in Vietnamese). Available online:
http://vanban.chinhphu.vn/portal/page/portal/chinhphu/hethongvanban?class_id=2&mode=detail&docu
ment_id=196453 (accessed on 03 May 2019).
2. Synergy operational schemes of saving energy and reducing pollution in 12th Five-Year Plan (in Chinese). Available online: http://www.gov.cn/zwgk/2011-09/07/content¡1941731.htm (accessed on 03 May 2019) 3. Shock, R. The UK Energy Efficiency Best Practice Program. Available online:
http://www.un.org/events/energy2000/speaker/shock/shock.ppt (accessed on 7 July 2018).
4. ETSU, 1999. Industrial Sector Carbon Dioxide Emissions: Projections and Indications for the UK, 1990 – 2020. See discussion of this report in ETSU, AEA Technology, 2001. Climate Change Agreements – Sectoral
Energy Efficiency Targets (version 2). Available online:
http://www.defra.gov.uk/environment/ccl/pdf/etsu-analysis.pdf(accesed on 17 December 2018).
5. Phylipsen, G.J.M.; Bode, J.W.; Blok, K.; Merkus, H. and Metz, B. A Triptych Sectoral Approach to Burden Differentiation; GHG Emissions in the European Bubble. ENERG POLICY. 1998b26, 929-943.
6. Phylipsen,G.J.M. and Höhne, N. The Triptych Approach, Presentation for Center for Clean Air Policy Dialogue on Future International Actions to Address Global Climate Change. 2004.
7. Punj, G.; Stewart, D.W. Cluster analysis in marketing research: Review and suggestions for application J Mark Res, 1983, 20, 134-148.
8. Soares, J.O.; Marques, M.M.L. and Monteiro, C.M.F. A multivariate methodology to uncover regional disparities: A contribution to improve European Union and governmental decisions Eur J Oper Res, 2003 145, 121-135.
9. Del Campo, C.; Monteiro, C. and Soares, J.O. The European regional policy and the socio-economic diversity of European regions: A multivariate analysis. Eur J Oper Res2008, 187, 600-612.
10. Ward, J.H. Hierarchical grouping to optimize an objective function. J Am Stat Assoc. 1963, 58, 236-244. 11. Lloyd, S.P. Least squares quantization in PCM. IEEE Transactions on Information Theory1982, 28,