Quality-Sensitive Test Set Selection for a Speech Translation System
Fumiaki Sugaya1, Keiji Yasuda2, Toshiyuki Takezawa and Seiichi Yamamoto ATR Spoken Language Translation Research Laboratories
2-2-2 Hikari-dai Seika-cho, Soraku-gun, Kyoto, 619-0288, Japan
{fumiaki.sugaya, keiji.yasuda, toshiyuki.takezawa, seiichi.yamamoto}@atr.co.jp
1
2
1
Current affiliation: KDDI R&D Laboratories. Also at Graduate School of Science and Technology, Kobe University. 2
Also at Graduate School of Engineering, Doshisha University. Abstract
We propose a test set selection method to sensitively evaluate the performance of a speech translation system. The proposed method chooses the most sensitive test sentences by removing insensitive sentences iteratively. Experiments are conducted on the ATR-MATRIX speech translation system, developed at ATR
Interpreting Telecommunications Research Laboratories. The results show
the effectiveness of the proposed method. According to the results, the proposed method can reduce the test set size to less than 40% of the original size while improving evaluation reliability.
Introduction
The translation paired comparison method precisely measures the capability of a speech translation system. In this method, native speakers compare a system’s translation and the translations, made by examinees who have various TOEIC scores. The method requires two human costs: the data collection of examinees’ translations and the comparison by native speakers. In this paper, we propose a test set size reduction method that reduces the number of test set utterances. The method chooses the most sensitive test utterances by removing the most insensitive utterances iteratively.
In section 2, the translation paired comparison method is described. Section 3 explains the proposed method. In section 4, evaluation results for ATR-MATRIX are shown. Section 5 discusses the experimental results. In section 6, we state our conclusions.
Translation paired comparison method The translation paired comparison method (Sugaya, 2000) is an effective evaluation method for precisely measuring the capability of a speech translation system. In this section, a description of the method is given.
2.1 Methodology of the translation paired comparison method
Figure 1 shows a diagram of the translation paired comparison method in the case of Japanese to English translation. The Japanese native-speaking examinees are asked to listen to Japanese text and provide an English translation on paper. The Japanese text is spoken twice within one minute, with a pause in-between. To measure the English capability of the Japanese native speakers, the TOEIC score is used. The examinees are requested to present an official TOEIC score certificate showing that they have taken the test within the past six months. A questionnaire is given to them and the results show that the answer time is moderately difficult for the examinees.
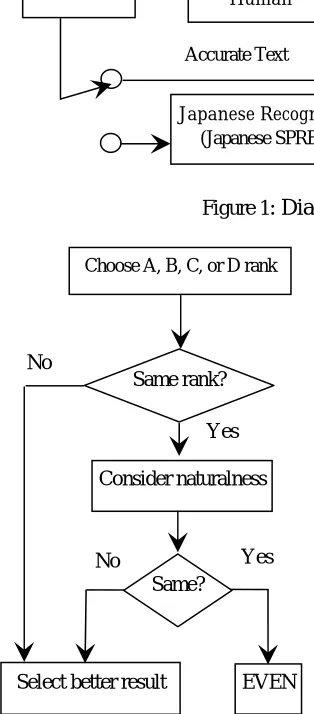
open for both speech recognition and language translation. The answers written on paper are typed. In the proposed method, the typed translations made by the examinees and the outputs of the system are merged into evaluation sheets and are then compared by an evaluator who is a native English speaker. Each utterance information is shown on the evaluation sheets as the Japanese test text and the two translation results, i.e., translations by an examinee and by the system. The two translations are presented in random order to eliminate bias by the evaluator. The evaluator is asked to follow the procedure illustrated in Figure 2. The four ranks in Figure 2 are the same as those used in Sumita (1999). The ranks A, B, C, and D indicate: (A) Perfect: no problems in both
information and grammar; (B) Fair: easy-to-understand with some unimportant information missing or flawed grammar; (C) Acceptable: broken but understandable with effort; (D) Nonsense: important information has been translated incorrectly.
[image:2.612.115.506.76.199.2]2.2 Evaluation result using the translation paired comparison method
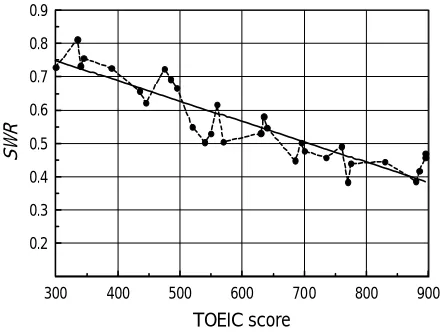
Figure 3 shows the result of a comparison between a language translation subsystem (TDMT) and the examinees. The input for TDMT included accurate transcriptions. The total number of examinees was thirty, with five people having scores in every hundred-point TOEIC range between the 300s and 800s. In Figure 3, the horizontal axis represents the TOEIC score and the vertical axis the system winning rate (SWR) given by following equation:
Translation Result by
Human
Evaluation
Sheet
Japanese Test
Text Typing Paired Comparison
Accurate Text
where NTOTAL denotes the total number of
utterances in the test set, NTDMT represents the
number of "TDMT won" utterances, and NEVEN,
[image:2.612.98.255.111.468.2]indicates the number of even (non-winner) utterances, i.e., no difference between the results of the TDMT and humans. The SWR ranges from 0 to 1.0, signifying the degree of capability of the MT system relative to that of the examinee. An SWR of 0.5 means that the TDMT has the same capability as the human examinee.
Figure 3 shows that the SWR of TDMT is greater than 0.5 at TOEIC scores of around 300 and 400, i.e., the TDMT system wins over humans with TOEIC scores of 300 and 400. Examinees, in contrast, win at scores of around 800. The capability balanced area is around a score of 600 to
(1)
0.5
TOTAL EVEN TDMT
N
N
N
SWR
=
+
×
Figure 1: Diagram of translation pair comparison method
Japanese-to-English
Language Translation (J-E TDMT)
Japanese Recognition
(Japanese SPREC)
Choose A, B, C, or D rank
No
Same rank?
Yes
Consider naturalness
Yes No
Same?
Select better result EVEN
300 400 500 600 700 800 900 0.2 0.3 0.4 0.5 0.6 0.7 0.8 0.9 TOEIC score SWR
Figure 3: Evaluation results using translation paired comparison method
Under the above condition, the standard deviation of the system's TOEIC score is calculated by
(4)
)
(
)
(
1
2 2 02
∑
−− + = X X X C n i t
β
σ
σ
where n is the number of examinees, C0 is the
system's TOEIC score, and
X
is the average of the examinees' TOEIC scores. Equation (4) indicates that the minimum error is given when the system's TOEIC score equals the average of the examinees' TOEIC scores.By using a t-distribution, the confidence interval (CI) of the system's TOEIC score with confidence coefficient 1-
α
is given by700. To precisely determine the balanced point, we used regression analysis. The straight line in Figure 3 is the regression line. The capability balanced point between the TDMT subsystem and the examinees is 0.5 of SWR. In Figure 3, the exact point is a TOEIC score of 708. We call this point the system's TOEIC score. Consequently, the translation capability of the language translation system equals that of the examinees at around a score of 700 points on the TOEIC.
[
]
(5) ) 2 ; 2 ( , 0 0 − × = + − = n t I I C I C CI tα
σ
In the current study, we employ 0.01 for the value of
α
.2.4 Costs for the translation paired comparison method
The experimental result for ATR-MATRIX, which consists of a speech recognition subsystem and TDMT, has been also reported (Sugaya, 2000). This system’s TOEIC score is 548, where the number of speech recognition errors is a factor in the degradation of the score.
The translation paired comparison method is an effective evaluation method because it can clearly express a system’s performance as a TOEIC (Test of English for International Communication) score. However, this method has excessive evaluation costs.
Roughly speaking, one of these costs is the need to collect translations made by examinees of various TOEIC scores. As shown in Equations (4) and (5), n, the number of examinees, affects the confidence interval of the system’s TOEIC score. Therefore, a reduction in this number makes it difficult to obtain a reliable evaluation result.
2.3 Error in the system’s TOEIC score
The SWR (Yi) and TOEIC scores for the examinees
(Xi) are assumed to satisfy the population
regression equation: (2) ) ,..., 2 , 1 ( 2
1 X i n
Yi = β +β i +εi =
The other cost is for the evaluation. Compared to a conventional evaluation method, such as a simple rank evaluation method, the translation paired comparison method uses a larger amount of labor because the evaluator must work on n
evaluation sheets. Each sheet consists of 330 pairs of translation results to be evaluated. Even for an accomplished evaluator, it takes more than two weeks to finish the work, following the method explained in section 2.2.
where
β
1 andβ
2 are population regressioncoefficients. The error term (
ε
i) is assumed to satisfy the following condition:3 Proposed method
Yes
No
σ
σ
NoYes
All candidates are calculated?
Set the number of iterations
Remove worst utterances from candidates
Is iteration achieved?
Calculate iteration
Update worst sentence, which causes maximum
iteration Get next candidate
As explained in the previous section, the translation paired comparison method has an excessive evaluation cost. Nevertheless, it is an effective evaluation method for measuring the capability of a speech translation system. Therefore, cost reduction for this evaluation method is an important subject for study.
The proposed method reduces the evaluation cost by removing insensitive test utterances from the test set. In this section, we explain the optimization procedure of the proposed method.
3.1 Optimization basis
In the proposed method, the basis of test set optimization is the minimization of
σ
. As shown in Equations (4) and (5), this value has an influence on the confidence interval of the system's TOEIC score. Therefore, minimizingσ
brings about a reliable evaluation result.We introduce
σ
iteration, which is calculated ineach iteration step.
σ
iteration is also calculated byusing Equations (2) and (3). The difference between
σ
iteration andσ
is the test set to be usedfor calculation.
σ
iteration is calculated usingresidual test utterances in each iteration step. However, the values of
β
1 andβ
2 are fixed, i.e., for the calculation ofσ
iteration, theseβ
1 andβ
2are calculated using the original test set consisting of 330 test utterances.
Optimization is conducted iteratively by picking up the test utterance that causes maximum
σ
iteration in each iteration step. The details of thisprocedure is explained in the next subsection.
3.2 Methodology of the proposed method
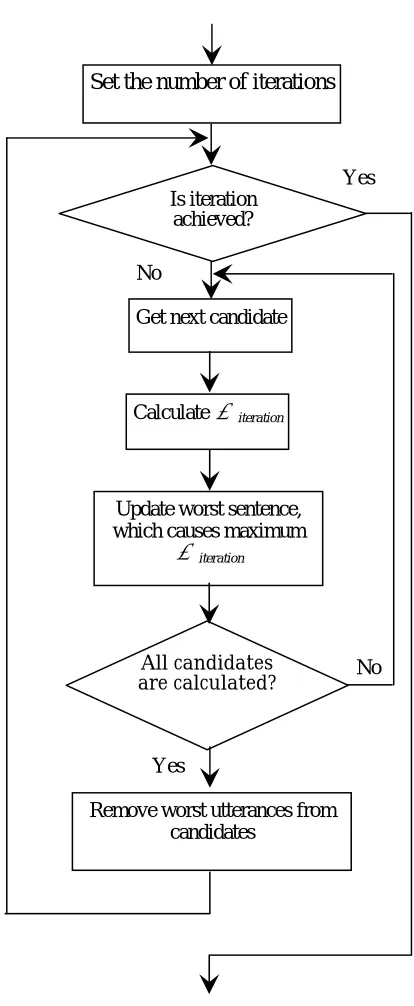
Figure 4 shows a diagram of the proposed method. In the first step, the number of iterations is set. This number is an actual number of removed test utterances. During the iterations, test utterances are removed one-by-one. To decide which test utterance to remove in each iteration,
σ
iteration is [image:4.612.341.548.72.575.2]calculated for the condition of removing each test utterance. This calculation is done for all candidates, i.e., all constituents of residual test utterances.
Figure 4: Procedure of proposed method
At the end of each iteration step, the test utterance to be removed is decided. The removed
test utterance is the one that maximizes
σ
iteration.We regard the utterance as maximizing
σ
iteration ifremoving it from the test set gives minimum
700 720 740 760
TO
E
IC
s
c
or
e
0 50 100 150 200 250 300
660 680
Iteration
(upper) C0 opt + Iopt
C0 opt
(lower) C0 opt - Iopt
20 30 40
σt op
t
Random selection (Averaging of 10 trials) Optimized (Open)
Optimized (Closed)
0 50 100 150 200 250 300
0 10
[image:5.612.80.295.80.262.2]Iteration
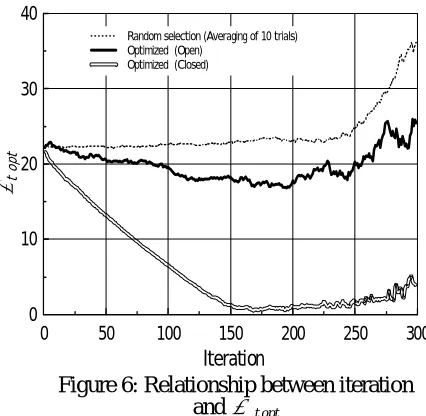
[image:5.612.304.517.81.289.2]Figure 6: Relationship between iteration and
σ
t optFigure 5: Relationship between iteration and system’s TOEIC score
As shown in the figure, from iteration 1 to iteration 250, the value of C0 opt is stable and does
not deviate from C0, which is 708. Furthermore,
until around iteration 200, the value of Iopt
decreases concurrently with the iteration. 4 Experimental results
In this section, we show experimental results of the proposed method. Here, we introduce the suffix “opt” to distinguish a variable calculated with the
optimized test set from a variable calculated with the original test set. All of the above variables are calculated with the original test set. By joining the suffix “opt” to these variables, we refer to variables
calculated with the optimized test set, e.g.,
σ
opt3
,
σ
t opt, Iopt, C0 opt, CI opt, and so on.This result suggests that the proposed may provide low-cost evaluation with high reliability.
4.2 Experiment opened for examinees
In the result shown in the previous subsection, the optimization and evaluation were conducted on the same examinees, i.e., the evaluation is closed for examinees. In this subsection, we look into the robustness of the proposed method against different examinees. We divided the group, consisting of 30 examinees, into two groups: a group of odd-numbered examinees and a group of even-numbered examinees. Individuals were sorted by TOEIC score from lowest to highest.
4.1 Closed experiment
This subsection discusses an experimental result obtained for the same test set and examinees described in Section 2. Namely, the target test set for optimization consists of 330 utterances and the number of examinees is 30.
Figure 5 shows the relationship between iteration and the system’s TOEIC score (C0 opt). In
this figure, the horizontal axis represents the iteration number and the vertical axis the TOEIC score. The solid line represents C0 opt, which is the
system’s TOEIC score using the optimized test in each iteration. The dotted line above the solid line represents the value of C0 opt + Iopt, and the dotted
line below the solid line C0 opt - Iopt.
One of the groups is used to optimize the test set. The other group is used for the translation paired comparison method. We use the term “optimization group” to refer to the first group and “evaluation group” to refer to the second group.
Figure 6 shows the relationship between iteration and
σ
t opt. In this figure, the horizontalaxis represents the iteration and the vertical axis shows
σ
t opt. Three kinds of experimental resultsare shown in this figure. In each of three experiments, the translation paired comparison is conducted by the evaluation group. The differences
3
σ
opt is different from
σ
iteration.σ
optis calculated based on1
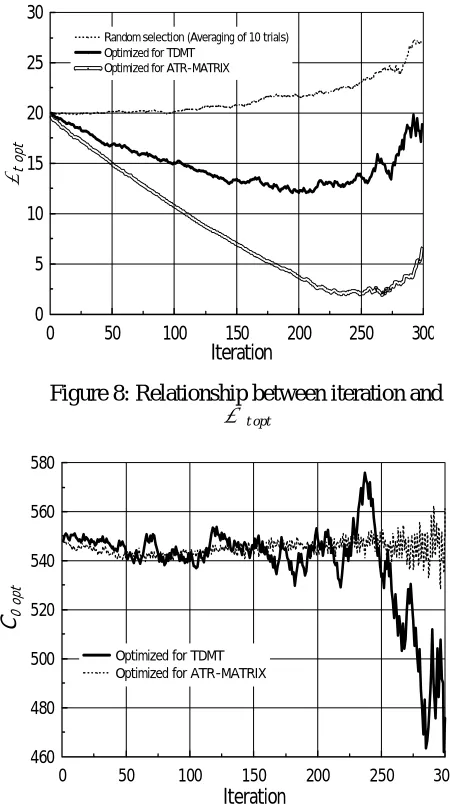
Figure 8: Relationship between iteration and
t opt
σ
0 50 100 150 200 250 300
0 5 10 15 20 25
Iteration
σt op
t
Random selection (Averaging of 10 trials) Optimized for TDMT
Optimized for ATR-MATRIX
0 50 100 150 200 250 300
550 600 650 700 750 800
Iteration C0 o
pt
Random selection (Averaging of 10 trials) Optimized (Open)
[image:6.612.80.298.80.271.2]Optimized (Closed)
Figure 7: Relationship between iteration and C0 opt
among the three experiments are in the group to be used for optimization of the test set or the method used to reduce it. The double line represents the closed result using the test set, optimized on the evaluation group. The solid line represents the open result using the test set, optimized on the optimization group. The broken line represents the result using the test set, which is reduced by randomly removing test utterances one-by-one. The actual plotted broken line is averaged over 10 random trials.
0 50 100 150 200 250 300
460 480 500 520 540 560 580
Iteration C0 o
pt
Optimized for TDMT Optimized for ATR-MATRIX
As shown in Figure 6, in the random selection result, t opt is on the rise. On the other hand, the
open result is on the decline.
σ
Figure 7 shows the relationship between iteration and the system’s TOEIC score. In this figure, the horizontal axis represents the iteration and the vertical axis the TOEIC score. The denotation of each line is the same as that in Figure 6. The error bar from the broken line represents and the vertical axis the TOEIC score. The denotation of each line is the same as that in Figure 6. The error bar from the broken line represents
σ
random, which is the standard deviation of thesystem’s TOEIC score over 10 random trials.
Figure 9: Relationship between iteration and C0 opt
In Figure 7, considering
σ
random, C0 opt of theopen evaluation is more approximate to C0 than
that of random selection, whereas C0 opt of the
closed evaluation is much more approximate to C0.
4.3 Experiment on ATR-MATRIX
To be of actual use, the test set optimized for some system must be applicable for evaluation of other systems. In this subsection, we show the results of an experiment aimed at verifying this requirement is met. In this experiment, we apply the test set,
which is optimized for TDMT, to evaluate ATR-MATRIX. The experimental conditions are the same as in Section 4.1, except for the evaluation target. The results are shown in Figure 8 and Figure 9.
Figure 8 shows the relationship between iteration and
σ
t opt. In this figure, the horizontalaxis represents the iteration and the vertical axis shows
σ
t opt. The double line represents the result [image:6.612.316.527.83.260.2]6 Conclusions by-one. The actual plotted broken line is averaged
over 10 random trials.
We proposed a test set selection method for evaluating a speech translation system. This method optimizes and drastically reduces the test set required by the translation paired comparison method.
Figure 9 shows the relationship between iteration and the system’s TOEIC score. In this figure, the horizontal axis represents the iteration, and the vertical axis TOEIC score. The broken line and the solid line are plotted using the same
denotation as that in Figure 8. Translation paired comparison is an effective method for measuring a system’s performance as a TOEIC score. However, this method has excessive evaluation costs. Therefore, cost reduction for this evaluation method is an important subject for study. In Figure 8, the solid line always lies on a lower
position than the broken line. In Figure 9, from iteration 1 to around iteration 200, the broken line does not deviate from the actual system’s TOEIC
score, which is 548. We applied the proposed method in an evaluation
of ATR-MATRIX. Experimental results showed the effectiveness of the proposed method. This method reduced evaluation costs by more than 60% and also improved the reliability of the evaluation result.
Considering these results, the test set optimized for TDMT is shown to be applicable for evaluating ATR-MATRIX.
5 Discussion
Acknowledgement In this section, we discuss the experimental results
shown in Section 4.
The research reported here was supported in part by a contract with the Telecommunications Advancement Organization of Japan entitled, "A study of speech dialogue translation technology based on a large corpus."
Looking at the broken lines in Figure 6 and Figure 8, test set reduction using random selection always causes an increase of
σ
t opt i.e., an increasein the scale of confidence interval. Therefore, this method causes the reliability of the evaluation result to deteriorate. Meanwhile, in the case of using the proposed method, looking at the solid lines on these figures,
σ
t opt is on the decline untilaround iteration 200. This means that we can achieve a more reliable evaluation result with a lower evaluation cost than when using the original test set. Here, looking at the solid lines in Figure 7 and Figure 9, the Co opt system’s TOEIC score is
nearly stable until iteration 200, and it does not deviate from Co. As mentioned before, Co for
Figure 7 is 708 and Co for Figure 9 is 548.
References
Morimoto, T., Uratani, N., Takezawa, T., Furuse, O., Sobashima, Y., Iida, H., Nakamura, A., Sagisaka, Y., Higuchi, N. and Yamazaki, Y. 1994. A speech and language database for speech translation research. In Proceedings of ICSLP `94, pages 1791-1794.
Sugaya, F., Takezawa, T., Yokoo, A., Sagisaka, Y. and Yamamoto, S. 2000. Evaluation of the ATR-MATRIX Speech Translation System with a Pair Comparison Method between the System and Humans. In Proceedings of ICSLP 2000, pages 1105-1108.
Considering these results, the proposed method can reduce the 330-utterance test set to a 130- utterance test set while reducing the scale of confidence interval. In other words, the proposed method both reduces evaluation costs by 60% and
improves reliability of the evaluation result. Sumita, E., Yamada, S., Yamamoto K., Paul, M., Kashioka, H., Ishikawa, K. and Shirai, S. 1999. Solutions to Problems Inherent in Spoken-language Translation: The ATR-MATRIX Approach. In Proceedings of MT Summit `99, pages 229-235.
Looking at Equations (4) and (5), the scale of confidence interval is also influenced by n. When we allow the scale of confidence interval obtained from the original test set, we can use the proposed method’s reduction effect of
σ
t to compensate theσ
t 's increase by reducing n. In this case, theactual achievable cost reduction will be more than 60%.
Workshop, pages 17-20.
Takezawa, T., Morimoto, T., Sagisaka, Y., Campbell, N., Iida., H., Sugaya, F., Yokoo, A. and Yamamoto, S. 1998. A Japanese-to-English speech translation system: ATR-MATRIX. In