University of Windsor University of Windsor
Scholarship at UWindsor
Scholarship at UWindsor
Electronic Theses and Dissertations Theses, Dissertations, and Major Papers
2013
Multiple Alignment of Protein Interaction Networks by Three-Index
Multiple Alignment of Protein Interaction Networks by Three-Index
Assignment Algorithm
Assignment Algorithm
Arushi Arora University of Windsor
Follow this and additional works at: https://scholar.uwindsor.ca/etd
Recommended Citation Recommended Citation
Arora, Arushi, "Multiple Alignment of Protein Interaction Networks by Three-Index Assignment Algorithm" (2013). Electronic Theses and Dissertations. 4959.
https://scholar.uwindsor.ca/etd/4959
This online database contains the full-text of PhD dissertations and Masters’ theses of University of Windsor students from 1954 forward. These documents are made available for personal study and research purposes only, in accordance with the Canadian Copyright Act and the Creative Commons license—CC BY-NC-ND (Attribution, Non-Commercial, No Derivative Works). Under this license, works must always be attributed to the copyright holder (original author), cannot be used for any commercial purposes, and may not be altered. Any other use would require the permission of the copyright holder. Students may inquire about withdrawing their dissertation and/or thesis from this database. For additional inquiries, please contact the repository administrator via email
Multiple Alignment of Protein Interaction Networks by
Three-Index Assignment Algorithm
by
Arushi Arora
A Thesis
Submitted to the Faculty of Graduate Studies through Computer Science
in Partial Fulfillment of the Requirements for the Degree of Master of Science at the
University of Windsor
Windsor, Ontario, Canada
2013
Multiple Alignment of Protein Interaction Networks by
Three-Index Assignment Algorithm
by
Arushi Arora
APPROVED BY:
______________________________________________ K. Tepe
Department of Electrical and Computer Engineering
______________________________________________ L. Rueda
School of Computer Science
______________________________________________ A. Ngom, Advisor
School of Computer Science
iii
DECLARATIONOFORIGINALITY
I hereby certify that I am the sole author of this thesis and that no part of this thesis has
been published or submitted for publication.
I certify that, to the best of my knowledge, my thesis does not infringe upon anyone’s
copyright nor violate any proprietary rights and that any ideas, techniques, quotations, or
any other material from the work of other people included in my thesis, published or
otherwise, are fully acknowledged in accordance with the standard referencing practices.
Furthermore, to the extent that I have included copyrighted material that surpasses the
bounds of fair dealing within the meaning of the Canada Copyright Act, I certify that I
have obtained a written permission from the copyright owner(s) to include such
material(s) in my thesis and have included copies of such copyright clearances to my
appendix.
I declare that this is a true copy of my thesis, including any final revisions, as approved
by my thesis committee and the Graduate Studies office, and that this thesis has not been
iv ABSTRACT
Bio-molecular networks have led to many discoveries in molecular biology. The most atypical of
them are protein-protein interaction (PPI) networks. In PPI networks the nodes refer to proteins
and edges refer to interactions between nodes. The comparison of PPI networks can be
demonstrated as a powerful approach for examining interactions in these networks and predicting
protein functions. This thesis contributes a new alignment algorithm for aligning three PPI
networks. We examine how Three-Index Assignment Problem via Hungarian Pair Matching
algorithm is used to maximize the complete match between the three networks to identify protein
triplets with higher similarity. We have performed tests on PPI networks extracted from the
IntAct database and IsoRank database. We experimentally show that the results obtained by our
method have more biological significance in comparison to other methods and can be used in
v
DEDICATION
vi
ACKNOWLEDGEMENTS
First and foremost I would like to thank my advisor Dr. Alioune Ngom, without
whom this research would not have been possible. Dr Ngom’s great research insight and
caring personality makes him a perfect supervisor. I also would like to thank him for
introducing me to the area of Bioinformatics and providing me with an initial idea of my
research. His ideas, guidance, encouragement and patience not only made my research
experience meaningful but also very enjoyable.
I would also like to thank Dr. Luis Rueda, Dr. Christie Ezeife and Dr. Kemal
Tepe for kindly agreeing to be a part of my thesis committee. Also, I thank all my friends
and colleagues who were always available for providing me with all the necessary
support and helping me in completing my thesis successfully.
Finally, I am sincerely grateful to my parents who have been a pillar of support all
through my life. Their belief that I could do a good research kept me motivated. Without
their love and encouragement I would not have finished this thesis. This thesis is
vii
TABLE OF CONTENTS
DECLARATION OF ORIGINALITY ... iii
ABSTRACT ... iv
DEDICATION ... v
ACKNOWLEDGEMENTS ... vi
LIST OF TABLES ... ix
LIST OF FIGURES ... ix
CHAPTER 1. INTRODUCTION 1.1 PREFACE ... 1
1.2 BACKGROUND STUDY ... 1
1.2.1 Proteins ... 2
1.2.2 Protein-Protein Interactions ... 3
1.2.3 Protein-Protein Interaction Networks ... 4
1.3 THESIS OUTLINE ... 5
2. PROBLEM DEFINITION AND PREVIOUS METHODS 2.1 PROBLEM DEFINITION AND NETWORK ALGNMENT PROBLEM ... 7
2.2 CURRENT RESEARCH MOTIVATION ... 9
2.3 THESIS CONTRIBUTION ... 11
2.4 PREVIOUS METHODS FOR ALIGNING PPI NETWORKS ... 13
2.4.1 Pairwise network alignment methods ... 13
2.4.1.1 PathBlast ... 13
2.4.1.2 MaWish ... 16
2.4.2 Multiple network alignment methods ... 17
2.4.2.1 Graemlin ... 17
2.4.2.2 IsoRank ... 20
3. RELATED WORK 3.1 PREFACE ... 22
3.2 HUNGARIAN ALGORITHM ... 22
3.2.1 Preliminary ... 24
3.2.2 The Algorithm ... 26
viii
3.2.4 A Walk Through Example ... 28
3.3 PINALOG ... 34
3.3.1 Methodology ... 35
4. MULTIPLE ALIGNMENT OF PROTEIN INTERACTION NETWORKS VIA THREE- INDEX ASSIGNMENT METHOD 4.1 PREFACE ... 39
4.2 PROPOSED METHOD ... 39
4.2.1 Community Detection ... 41
4.2.1.1 Clique Percolation Method ... 42
4.2.2 Community Mapping ... 43
4.2.2.1 Scoring Scheme ... 44
4.2.2.2 Three-Index Assignment Problem ... 51
4.2.2.3 Algorithm ... 58
4.2.3 Extension Mapping ... 59
5. EXPERIMENTS AND RESULTS 5.1 PREFACE ... 61
5.2 DATASET USED FOR EVALUATION ... 61
5.3 EVALUATION CRITERIA ... 63
5.4 RESULTS ... 66
5.5 RUNTIME ANALYSIS ... 69
6. CONCLUSION AND FUTURE WORK………...………72
REFERENCES ... 75
ix
LISTOFTABLES
Table 5.1: PINALOG Dataset…...61
Table 5.2: File Format of PINALOG Dataset…...62
Table 5.3: IsoRank Dataset…...63
Table 5.4: Alignment results of different species from IsoRank dataset. …...67
x
LISTOFFIGURES
Figure 1.1: A map of protein-protein interactions in yeast…………...4
Figure 2.1: Example of Network Alignment Graph...…...9
Figure 2.2: An example of pathway alignment………...14
Figure 2.3: A graph representation of the equivalence relation in Graemlin...…..18
Figure 3.1: Matrix representation of a complete weighted bipartite graph...24
Figure 3.2: Example of a weight matrix ...28
Figure 3.3: Example of a weight matrix with vertex labels ...28
Figure 3.4: Equality graph of the given example ...29
Figure 3.5: Updated Labels ...30
Figure 3.6: Updated Labels ...31
Figure 3.7: Updated Labels ...32
Figure 3.8: Alternating Tree...32
Figure 3.9: Final Assignment...33
Figure 3.10: (i) Community Detection (ii) Community Mapping (iii) Extension Mapping in PINALOG...35
Figure 3.11: Example showing three communities in a network...36
Figure 4.1: Summary of proposed method...40
Figure 4.2: Example of clique percolation method...43
Figure 4.3: DAG for Intracellular Membrane-bound Organelle: 00432331...47
Figure 4.4: Diagram showing calculation of functional similarity for two proteins…….49
xi
Figure 4.6: Random initial assignment of three graphs……….54
Figure 4.7: Diagram showing optimization of permutation ………...…………56
Figure 4.8: Diagram showing optimization of permutation p………56
Figure 4.9: Diagram showing optimization of index permutation I………..56
Figure 4.10: Algorithm for community mapping ..………...58
Figure 4.11: Algorithm for Three-Index Assignment problem …...59
Figure 4.12: Extension mapping from core proteins…...60
Figure 5.1: Diagram illustrating protein-protein interologs………...65
Figure 5.2: Proteins aligned in Worm, Fly and Bacteria with Functional Similarity > 0.5 in comparison with IsoRank………...69
1 CHAPTER 1
INTRODUCTION
1.1 Preface
Every living cell consists of proteins that continuously interact with each other to perform
various functions. These cellular functions are not carried out by single proteins, but by
proteins interacting with each other. Various techniques have been developed to
understand these interactions. Due to the recent advances in the experimental biological
techniques such as yeast-2-hybrid, tandem affinity purification and other high-throughput
methods, a huge amount of protein-protein interaction (PPI) data is publicly available.
The availability of large amount of data entails the researchers to devise new
computational approaches to analyze these interactions and study the complex networks
they form. The networks formed by these protein interactions are called protein-protein
interaction (PPI) networks. The comparative analysis of PPI networks of various species
can be very useful in the field of bioinformatics as it helps in revealing significant
biological information. Unfortunately, unlike sequence comparison and alignment,
comparing networks by aligning them is computationally hard and thus heuristic
approaches must be devised. The purpose of this thesis is to provide new, better and
efficient heuristic algorithm for aligning multiple networks
1.2 Background Study
In this section we discuss briefly the biological background and provide an introduction
2 1.2.1Proteins
Proteins are large biological molecules consisting of one or more connected amino acid
units. They are involved in practically every function performed by a cell. Some of the
important examples of functional classes include: (1) enzymes, which catalyze, for
example, the many of the reactions of metabolism; (2) structural proteins, such as
collagen which is the main protein of connective tissue in animals; (3) regulatory
proteins, such as transcription factors that regulate the transcription of genes; (4)
signaling molecules, such as certain hormones, like insulin, and their receptors; and (5)
defensive proteins such as antibodies of the immune system.
Recent advancements in high-throughput sequencing techniques, discovered the complete
sequences of several genomes. However, the biological function of a large proportion of
sequenced proteins remains to be identified. Moreover, a given protein may have more
than one function, so many proteins that are known to be in some class may have as yet
undiscovered functionalities. Predicting protein functions is one of the most important
challenges of current computational biology research. To facilitate such research, various
biological data could be used, including sequence, gene expression patterns, phylogenetic
profiles, domain fusions and so on.
Proteins interact with each other to perform various functions. Hence, we see that
protein-protein interactions operate at almost every level of cellular functions. Thus,
knowledge bout protein functions can be inferred via protein-protein interaction studies.
These implications are based on an idea that the function of unknown proteins can
3
function. The study of protein interactions will help us understand how proteins function
within the cell and predict protein functions of unknown proteins..
1.2.2Protein-ProteinInteractions
The Protein-Protein Interactions are referred to as the biochemical reactions between
protein molecules. In all the living organisms the proteins interact with each other to
perform various functions. For example, signal transduction within the cell takes place
when chains of protein interactions occur many of which include kinase enzymes or
proteins which react with other proteins to modify their function. Generally the proteins
perform long-lasting interactions, creating protein complexes. A protein complex is a
group of two or more proteins interacting with each other to perform a particular
function. A single protein can be a part of various complexes. Various experimental
methods have been described to identify the proteins participating in a complex to
perform various functions.
There are proteins across various species that are similar to each other based on the
shared ancestry. These proteins are referred to as orthologs. The orthology of the proteins
in these species is detected via sequence similarity between their respective DNA or
amino-acids sequences. The sequence similarity between these proteins is calculated
using a sequence similarity alignment method. The most commonly method used for
computing the sequence similarity is BLAST (Basic Local Alignment Search Tool),
which aligns the sequences and computes a score called S-score of the alignment, and
outputs the significance of the result as a number, the value (Expectation value). The
4
than the S-score that are expected to occur in a database. The lower the E-value, the more
significant is the score. This score is used for determining the similarities between the
proteins in large protein-protein interaction networks.
1.2.3Protein-ProteinInteractionNetworks
The most commonly studied biological networks are known as Protein-Protein
Interaction networks. (Figure 1.1 depicts an example of such a network). These networks
are usually represented using undirected, weighted graphs where the nodes of these
graphs represent the proteins and the edges represent the interactions between the
proteins. The study of these networks becomes important to understand the various
functions in a cell. As we know proteins never perform their function alone instead they
interact with each other to perform various functions hence, studying and understanding
these networks is one of the foremost challenges faced by the researchers today The study
of the topology of the PPI networks gives us an insight about function of individual
5
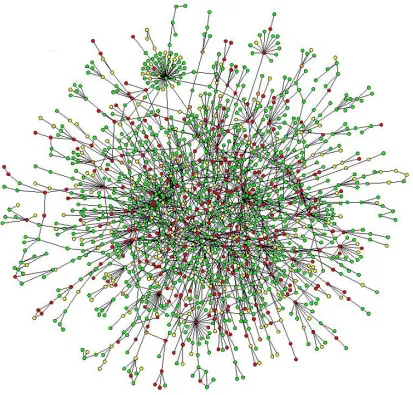
Figure 1.1: A map of protein-protein interactions in yeast (Barabàsi et.al., 2004), which
was based on early yeast two-hybrid measurements. A few highly connected nodes
(which are also known as hubs) hold the network together
1.3ThesisOutline
This thesis is organized as follows. The next chapter provides a very brief description of
problem definition, current research motivation and previous approaches proposed for
6
algorithm which forms an important part of our method and also detailed description of a
previous method PINALOG which serves as a basis for our new method. Chapter 4
describes our new algorithm for aligning three protein interaction networks using a
solution to Three-Index Assignment Problem via Hungarian algorithm. Chapter 5
presents a description of datasets used and results of applying our method to PPI
networks. It also presents the comparison of IsoRank’s performance to our method.
7 CHAPTER 2
PROBLEM DEFNITION AND PREVIOUS METHODS
2.1Problem Definition andNetworkAlignmentProblem
Proteins are considered as basic building blocks of all the cellular processes. Thus protein
interactions perform all the activities that occur within the cell. Two or more proteins that
are descendants of a common ancestral DNA sequence are known as homologs.Also,
proteins in different species that evolve from a common ancestor are called orthologs.
Thus, functions performed by proteins in different species may be related to each other.
In order to identify similar related protein groups have attracted lot of researchers to
compare PPI networks.
Let us consider a set of PPI networks of different species. In addition we also have
protein sequence similarity data or function similarity data for every protein pair in the
networks. The idea here is to find the sub-networks that are conserved across the species
both in terms of proteins (similar sequence) and interactions (similar topology). The
graphs are formally represented as :
(2.1)
denote the PPI networks of species 1…..k, is the set of proteins of
species i and is the set of protein-protein interactions.
Network alignment is the process of comparing ` networks, identifying regions of
similarity and dissimilarity. The algorithms for network alignment can be divided into
8
Global Network Alignment - The goal is to map every node in one network to a
node in the other network. The mapping between the nodes of the two networks
maximizes some kind of score. The score can be either sequence, function or
topological similarity. The nodes that are not mapped to any node in the other
network are present in the alignment without any matched partner. These types of
alignment take into account the whole network into consideration and measure
overall network conservation.
Local Network Alignment – This alignment focus on finding the conserved
sub-networks across the species, thus representing true functional modules. The goal is to
find a local alignment that contains a sub-network from each species as well as the
mapped nodes in the sub-networks. One disadvantage of aligning networks by this
method is that the nodes aligned can overlap in different local alignments. The same
node in one network might be aligned with different nodes in the other network. Also
there is no way to know the overall similarity existing between the two networks.
The challenge in PPI network research is network comparison. Given two networks
and the network alignment problem finds a mapping
which matches similar nodes in the networks being compared. Aligning
topologically similar nodes is called graph isomorphism. An isomorphism may not exist
even if the two PPI networks are of the same size because of the biological variation in
these biological networks. Thus network alignment problem includes sub-graph
9
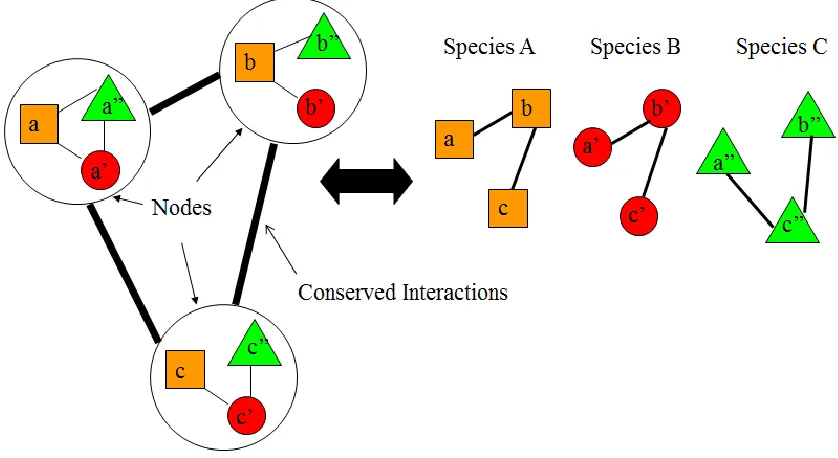
Another way of comparing two networks is by forming a network alignment graph. The
node of this graph is a collection of proteins, one from each network and the edges
represent the conserved protein interactions between the networks (Figure 2.1).
Figure 2.1: Example of Network Alignment Graph.
In the above example we see proteins of PPI networks of three species . Let
represent the sets of proteins in species . For every homologous
protein, , a node is added to the
network alignment graph.` The complexity of creating network alignment graph increases
exponentially if more than two networks are being compared.
Hence, because of the large amount of PPI data available, we need an efficient method to
10 2.2 Current Research Motivation
With the rapid advancement in technology the study of biological networks has become
one of the primary focuses in the field of bioinformatics. The most commonly studied
biological networks are the protein-protein interaction (PPI) networks. Since the proteins
do not function alone they interact with one another to form protein complexes or
functional module. The PPI networks can be graphically represented in the form of an
undirected weighted graph denoted by where is a set of nodes and
is a set of edges. The nodes of the graph represent the proteins and the edges
represent the interactions between the proteins. There are several crucial challenges faced
in network alignment research.
Certain regions in PPI networks are expected to be conserved more than others during the
course of evolution. The challenge faced by the researchers nowadays is to study and
compare the given PPI networks in order to find the conserved sub-graphs. The
conserved sub-graphs ensure that the proteins present in the two sub-graphs consist of
protein that have similar functions and have similar interaction profiles. Since protein
interaction networks are too large and complex it is essential devise an efficient
alignment methods. The commonly used method is to generate a merged representation
of the networks being compared, known as a network alignment graph. A network
alignment graph consists of nodes that represent the set of proteins, one from each
species and the edges represent the conserved protein-protein interactions across the
species being compared. The alignment may be one-to-one correspondence or
11
by various authors successfully but its extension to more than two networks results in
exponential growth of the alignment graph with the increase in number to species. The
researchers are motivated to propose new algorithms to overcome this difficulty.
Another way of comparing two networks specified above, is the concept of graph
isomorphism. Consider two networks and , here the network
alignment problem can be referred as to find a mapping function which
aligns similar nodes on basis of topology. .But we know exact comparisons in biological
networks is not possible because of the biological variations. Formulation of network
alignment problem includes sub-graph isomorphism problem which is known to be
NP-complete. Hence, network alignment problem is computationally hard and has to be
addressed using heuristics.
We know that comparing networks can provide us with valuable insights to the biological
information. Alignments can be used to transfer knowledge between protein networks
such as predicting functions of unannotated proteins. This motivates us to formulate
methods to align PPI networks in an efficient way in order to extract relevant biological
information.
2.3ThesisContribution
The alignment of PPI networks helps in understanding the functioning of individual
proteins. Many network alignment methods have been applied successfully by various
authors for aligning two PPI networks. These methods align networks both globally and
12
conserved across two species. In global network alignment (GNA), the goal is to
associate proteins from two or more species in a global manner so as to maximize the
overall conservation across the aligned networks.
Methods based on local network alignment methods include PathBLAST (Kelley et al.,
2003), MaWISH (Koyutürk et al., 2006), which adopts the evolutionary models of match,
mismatch and deletion of the proteins. The global alignment of networks proves to be
more challenging due to the complexity and scale of the problem for example Graemlin
2.0 proposed by Flannick et al., 2009 formulates a model for protein duplication, deletion
and mutation and aligns the network progressively using a hill-climbing algorithm,
IsoRank by Singh et al., 2008 which aligns the networks by eigenvalue-based methods
and PINALOG (Phan et. al. 2009) which is a pairwise alignment method that
incorporates sequence, function and topological information to map the networks using
Hungarian algorithm.
Analogous to global sequence alignment problem, in network alignment problem we aim
to find the overall best match between the PPI networks using network topology,
sequence similarity and function similarity between proteins of the networks. In this
thesis propose a method for aligning multiple species. The method is based on
PINALOG; a global pairwise network alignment method which is extended to perform
multiple network alignment. We introduce a method which is capable of aligning three
protein interaction networks based on combination of sequence similarity and function
similarity between the proteins of the networks and later incorporating network topology.
13
Three-Index assignment problem via Hungarian algorithm and thus obtain overall best
match between three networks. This thesis provides a flexible and scalable( in terms of
computational running time) method for comparing and aligning protein interaction
networks.
2.4PreviousMethodsforAligningPPINetworks
A variety of methods have been proposed for PPI network alignment. The network
alignment method has been successfully implemented by various authors for pairwise
alignment of networks. However, aligning more than two networks has proven to be
difficult because of the exponential growth of the alignment graph with the number of
species. Thus alignment of multiple networks is a challenge faced by the researchers
today.
2.4.1PairwiseNetworkAlignmentMethods
2.4.1.1 PathBlast
One of the first successful algorithms for pairwise local network alignment is
Path-BLAST . This method searches for high-scoring alignments of pathways from two
networks as shown in Figure 2.2. It pairs proteins along a pathway from one network
with their homologues, i.e., proteins that are descendants of common ancestry, from
another network. This algorithm can be described as follows. First, the “global network
alignment graph” between two networks is constructed as illustrated in Figure 2.2b. As
discussed above each vertex of this graph represents a pair of proteins from two networks
14
and (B, b) in this “global network alignment graph” can be of the three types: (i) “direct”
- both edges (A,B) and (a, b) are present in the input PPI networks, (ii) “gap” – only one
of the edges (A,B) or (a, b) is present in the data and (iii) “mismatch” - (A,B) and (a, b)
are absent in both networks. Similar to to sequence alignment method, this algorithm also
allows for gaps and mismatches in the alignments. Then, for each path P in the “global
alignment graph,” its log-likelihood score is defined as
∑
∑
(2.2)
where p(v) is the probability that the proteins in the pair corresponding to v are true
homologues, given their pairwise sequence similarity measured as BLAST E-value, and
q(e) is the probability that the protein-protein interaction represented by e is real. The
q(e) value is estimated based on the number of studies that confirmed interaction e and
the quality of the experiments that confirmed it. and are expected values
of p(v) and q(e) taken over all nodes and edges in the “global alignment graph,”
respectively. Based on this scoring function, a dynamic programming algorithm is used to
15
Figure 2.2: (a) An example of pathway alignment. Capital letters represent nodes from
one network and small letters represent nodes from another network. Dotted horizontal
lines represent local alignments that link proteins with high sequence similarity. Gaps
(e.g. at node “C”) and mismatches (e.g., at nodes “E” and “g”) are allowed in the
alignment. (b) The two paths from panel (a) combined into the global alignment graph.
This figure is taken from (Kelly et.al., 2003).
PathBLAST was used to identify orthologous pathways between yeast S. cere- visiae and
bacteria H. pylori.. Later, Suthram et al. (22) used PathBLAST to compare the PPI
networks of Plasmodium falciparum (the pathogen responsible for over 90% of human
deaths from malaria) with PPI networks of model eukaryotic organisms: the budding
yeast Saccharomyces cerevisiae, the nematode worm Caenorhabditis elegans, the fruitfly
Drosophila melanogaster and the bacterial pathogen Helicobacter pylori. Based on their
alignments of these networks using PathBLAST, they found 29 highly connected protein
complexes specific to the network of the pathogen. However, only 3 of them were
conserved in the yeast. Since yeast, fly and worm share a substantial amount of conserved
complexes with each other (as Suthram et al. (22) revealed using PathBLAST), this
suggests that the PPI network of this pathogen encodes significant functional differences
16 2.4.1.2 MaWISh
Another method for pairwise local alignment of PPI networks is MaWISh (Maximum
Weight Induced Subgraph). This algorithm is based on the duplication/ divergence
models. It is based on understanding the evolution of protein interactions. Analogous to
sequence alignment method, the concept of match, a gap and a duplication event are
defined, as well as the corresponding scores for these events. Firstly, the “global
alignment graph” is constructed from the PPI networks being aligned. This “global
network alignment graph” is conceptually similar to those used by Path-BLAST. Its node
set consists of all pairs of nodes : such that
> 0, where S defines the likelihood that are orthologs and is defined as
̃
̃(2.3)
where E(v1, v2) is a BLAST E-score for protein sequences of , is manually
chosen threshold and is a set of all known orthologous pairs of nodes from two
networks. The edges of their “global alignment graph” are weighted, with weights equal
to
(2.4)
where are scores for match, mismatch and duplication events, respectively.
The goal of MaWISh algorithm is to find an induced subgraph of maximum weight in the
“global alignment graph.”.
Koyuturk et al. 2005 used MaWISh to perform pairwise alignments of yeast
(S.cerevisiae), worm (C. elegans) and fruitfly (D. melanogaster) PPI networks. Aligning
17
subnetworks. Note that these alignments are very “local” in the sense that these
conservedsubnetworks contain about 10 nodes each.
2.4.2MultipleNetworkAlignmentMethods
2.4.2.1 Graemlin
Graemlin 2.0 is a global network alignment algorithm for multiple network alignments.
This algorithm performs both global and local network alignments. It obtains its
parameters of scoring function from the data and its complexity scales linearly with the
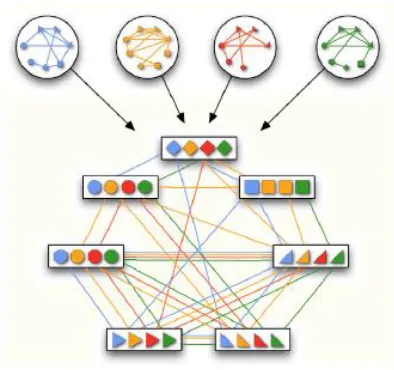
number of networks in the multiple network alignment. Flannick et al. 2009 define a
multiple network alignment as an equivalence relation over the nodes of
Example of such equivalence relation for four networks is given in Figure
2.3. It is a transitive relation and it partitions V into disjoint equivalence classes of
orthologous proteins. The global alignment is an equivalence relation over all nodes in V ,
whereas the local alignment is a relation over a subset of nodes in V .
The scoring function used by Graemlin 2 computes the features of the global network
alignment to a numerical feature vector of the form
[
∑
[ ][ ]
∑
[ ] [ ] [ ] [ ][ ] [ ]
]
(2.5)where [ ] represents an equivalence class of nodes under alignment a, and and are
node and edge feature functions scoring several evolutionary events. The score of
alignment a is then given by s(a) = wf(a) where w is a parameter vector to be learned.
The pairwise node feature function computes and scores the following evolutionary
18
Protein present = which denotes the existence of a protein in both species.
Protein count = the count of proteins that exist in both species.
Protein deletion = a loss of a protein in one of the two species.
Protein duplication = the duplication of a protein in one of the two species.
Protein mutation = the divergence in sequence of two proteins in different species.
Paralog mutation = the divergence in sequence of two proteins in the same
species.
For edge feature function two evolutionary events are considered:
Edge deletion= a loss of an interaction between two pairs of proteins in different Species
Paralog edge deletion = a loss of an interaction between two pairs of proteins
in the same species.
Figure 2.3: A graph representation of the equivalence relation corresponding to the
multiple alignment of four PPI networks.
All these evolutionary events for nodes and links in the network are defined for a pair of
19
Graemlin uses phylogenetic trees of species being aligned and incorporates evolutionary
distance between species into its scoring function. Parameter w is learned from the
example set of networks with known optimal alignments. Once the optimal vector of
parameters has been learned, Graemlin uses iterative hill climbing technique to find the
optimal (the one with the highest score) global alignment.
To test the performance of Graemlin, its authors performed several pairwise alignments
of yeast, human, mouse and different bacteria PPI networks. They also performed a
three-way alignment of yeast, worm and fly networks from DIP (34) as well as six-three-way
alignment of E. coli, S. typhimurium, Vibrio cholerae, Campylobacter jejuni,
Helicobacter pylori, and C. crescentus PPI networks. To measure the sensitivity and
specificity of their algorithm, Flannick et al. compared the alignments produced by
Graemlin with KEGG Orthology (KO) groups. They also evaluated Graemlin and all
previously discussed algorithms on the same datasets and showed that Graemlin is both
more sensitive and more specific than all of the algorithms discussed earlier in this
chapter. In order to perform global alignment, Graemlin requires a lot of information as
input: (i) node sequence similarity scores that estimates evolutionary events, (ii) the
phylogenetic tree of species being aligned for multiple network alignment, and (iii) a
training set consisting of several networks and “correct” alignments between them to
20 2.4.2.2 IsoRank
One of the most advanced algorithms for global network alignment up to date is IsoRank
(Singh et. al., 2006). It is inspired by Google’s PageRank method and is based on the fact
that two nodes should be aligned together only if their neighbors can also be well
matched together. Its method is formalized using the eigenvalues problem.IsoRank is the
first global network alignment algorithm.
Given two networks and , the algorithm works in two stages: (i) ∀i V ( ) and ∀j
V ( ) it computes the scores of matching node i with node j, (ii) it constructs a
global network alignment by extracting from vector R, high-scoring pairwise
mutually-consistent matches. Given dimensional scores vector R is subject to the
following constraints
∑
∑
∀
(2.6)
where N(u) is a neighborhood of node u. This equation can be written in the matrix form.
(2.7)
where A[i, j][u, v] = 1/ |N(u)||N(v)| if (i, u) E1 and (j, v) E2, and A[i, j][u, v] = 0
otherwise. Note that A is a stochastic matrix (i.e., each of its columns sum to 1), so its
principle eigenvalue is 1. The matrix A is of size , and is very sparse and R
can be efficiently computed using some iterative technique such as the power method.
The above equations is modified to include pairwise information about node similarity
(i.e., sequence information) as shown in Equation 2.8
21
where E is a matrix with pairwise sequence scores between the nodes and α is a user
defined parameter which controls the contribution of sequence versus topology
information in the alignment. After computing the value of the global network
alignment is then constructed by interpreting R as a weighted bipartite graph and finding
the maximum-weight bipartite matching. IsoRank constructs global alignment between
yeast S. cerevisiae and fly D. melanogaster PPI networks. The common subgraph, as
revealed by this alignment, consists of 1,420 edges present in both species. The authors
use their alignment to identify functional orthologs between yeast and fly.
For multiple alignment, first stage of the algorithm remains the same, but is executed for
all pairs of networks creating a k-partite graph. Thus, the second stage was changed to
find the optimal solutions of the k-partite matching. This version of IsoRank was used to
perform the alignment of the five PPI networks, of yeast, fly, mouse, worm and human.
The common subgraph constructed by this alignment had 1,663 edges that were
supported by edges in at least two (out of five) aligned PPI networks, and only 157 edges
that were supported by at least three PPI networks (i.e., species). Based on this alignment,
22 CHAPTER 3
RELATED WORK
3.1 Preface
In this chapter we discuss the details of the methods applied to find out the mapping
between the protein interaction networks. We begin by describing an algorithm called
Hungarian algorithm. As discussed earlier the challenge faced in aligning protein
interaction networks is to find an optimal alignment algorithm which is fast and accurate.
In the network alignment of two or more networks we focus on identifying regions of
similarity and dissimilarity. Since in our thesis we focus on global alignment we need to
find a mapping that maximizes the total network score. The score can be sequence
similarity, or functional similarity between the proteins or can be based on the topology
of the networks. This mapping can be achieved by considering this problem as a
maximum weight matching problem. Finding maximum weight matching is called an
assignment problem which is one of the most fundamental optimization problems. A very
famous assignment problem was developed by Kuhn (1955) which maximizes/minimizes
the total cost called Hungarian Algorithm. We then discuss a pairwise protein interact ion
network alignment method known as PINALOG that provides a basis for our approach.
3.2Hungarian Algorithm
The standard assignment problem is referred to as the problem to find a one-to-one
matching between tasks and agents, in order to optimize the total cost of the
23
we wish to find an optimal assignment which maximizes the total cost function. The
classical example of assignment problems is assigning jobs to workers. Hungarian
method is the most popular method which solves the assignment problem in polynomial
time. It was developed and published by Harold Kuhn in 1955. Consider an assignment
problem in which we want to assign tasks to agents where each agent is assigned to
at the most one task. The objective function is to maximize the total cost of assignments.
The mathematical model for the assignment problem may be given as:
∑
∑
(3.1)
Subject to:
∑
∀
∑
∀
Where is the cost of assigning agent i to task j and is the resulting
binary matrix, where = 1 if and only if an agent i is assigned to task j.
In terms of graph theory we can represent this problem as a maximum weight bipartite
matching. A bipartite graph is a graph whose vertices can be divided into
two disjoint sets and such that each edge E connects a vertex and
24
Figure 3.1 Matrix representation of a complete weighted bipartite graph.
In terms of protein interaction networks the weight on the edges of the graph can be a
sequence similarity or a functional similarity score between the proteins. Hence we can
create a matrix using the similarity score and find a matching between two protein
networks. The maximization and minimization problems are essentially the same,
however one can be transformed into the other by replacing the weight on each edge with
an inverse of the weight.
3.2.1Preliminary
Given a weighted complete bipartite graph where ,
and edge has weight we want to find a matching M from X to
Y with the maximum weight.
Before we proceed further we will discuss some theoretical ideas used in the algorithm.
We assume that all the weights are non-negative 1 4 5
5 7 6
5 8 8
c b a
3 2 1 1
4 5
5 7
6
25
∀ ∀ (3.2)
Vertex Labeling: It is defined as a function that assigns a number
called label to each vertex in the graph. A label is called feasible if it satisfies
the following condition
∀ ∀ (3.3)
Vertex and Set neighborhood: Consider a vertex , then all the
vertices that share an edge with the vertex v (neighborhood) can be given by
the equation 3.4
(3.4)
Let . Then all the vertices that share an edge with the vertex in S (neighborhood)
is given by the equation 3.5.
⋃ (3.5)
Equality Graph: A given graph where is a sub-graph of G
is called an equality graph if it consists of only those edges from the bipartite
matching which allow the edges to be perfectly feasible. Thus equality
includes only those edges that satisfy the flowing equation
(3.6)
Alternating path and alternating tree: Consider a
26
unmatched (free/exposed) vertices. A matched vertex can be called
matched if it satisfies the equation otherwise it is called exposed.
(3.7)
Thus a path P is called an alternating path if its edges alternate between .It
begins at a free vertex and alternate between free and matched edges.
An alternating tree is defined as a tree whose root vertex is a free vertex and every path
that starts from that root is alternating.
Augmenting Path: A path is said to be augmenting if it is an alternating path
starting and ending at a free vertex.
3.2.2TheAlgorithm
Below we describe the algorithm to find a maximum matching in the given bipartite
graph.
Step 1: We start with assigning a feasible vertex label to all the vertices in the graph and
determine the equality sub-graph . The initial labelling is calculated by the equation
(3.8)
Step 2: Check if M is perfect then stop as we have our optimal solution. Otherwise, for
some exposed we set and . Here x is considered as the root of the
27
Step 3: If then go to Step 4. Otherwise if then calculate by
equation
(3.9)
After calculating the update the existing labels according to the equation
{
(3.10)
After calculating the updated labels replace the equality graph with .
Step 4: In this step we choose a vertex . If is matched in with some
vertex say add the edge to the alternating tree and update and by following
equations and go to Step 3.
(3.11)
Otherwise if is exposed, there will be an alternating path from to and we use this
path and a larger matching in . We replace by and go to Step 2.
3.2.3RuntimeAnalysis:
The time complexity of Hungarian algorithm is .
The size of the matching M never decreases. At each iteration we either increase the size
of T, or we update the labels, which will cause us to increase the size of T in the next
iteration. So after 2n iterations, the size of T will be n. Since T cannot grow anymore, we
28
finish after at most iteration. An iteration can be executed in time , so the
total running time is bounded by .
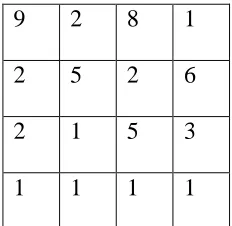
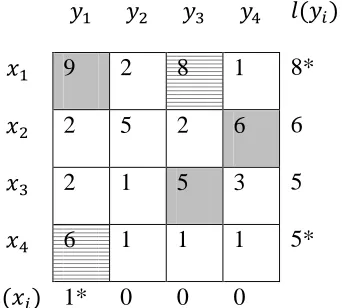
3.2.4AWalkthroughAlgorithm
Consider a weighted bipartite graph. The figure shows the weight matrix for the
given graph
9 2 8 1
2 5 2 6
2 1 5 3
1 1 1 1
Figure 3.2: Example of a weight matrix
Step 1: First we do vertex labeling and find the maximum match M using equality graph
condition.
9 2 8 1 9
2 5 2 6 6
2 1 5 3 5
6 1 1 1 6
0 0 0 0
29
After updating the labels we find the maximum matching in the matrix. From the matrix
we get }. In the following we show the edges
that are matched. The matched edges are shaded and the edges that have not been
matched are dashed.
9 2 8 1 9
2 5 2 6 6
2 1 5 3 5
6 1 1 1 6
0 0 0 0
Figure 3.4: Equality graph of the given example.
Step 2: From the above figure we see that is not matched. Thus according to Step 2 of
the algorithm we set .
Step 3: Here we compute We assign . Since ,go to
Step 4.
Step 4: Now we choose in . We see that the vertex is matched
with in the matching . Thus we add to the set and the vertex to . After
updating the values we get .Go to Step 3 again.
Step 3: We compute . Since , we compute .
30
After calculating the value for we decrement the labels for vertices
according to the equation by 1 and on the other hand we increment the label of vertex
by 1. The figure below shows the updated labels.
9 2 8 1 8*
2 5 2 6 6
2 1 5 3 5
6 1 1 1 5*
1* 0 0 0
Figure 3.5: Updated Labels.
We compute
Step 4: We choose in . We again see that vertex is
matched with in the matching . Thus we add to the set and the vertex to .
After updating the values we get . Go to Step 3
again.
Step 3: We compute . Since , we compute .
After calculating the value for we decrement the labels for vertices
according to the equation by 2 and on the other hand we increment the label of vertex
31
9 2 8 1 6*
2 5 2 6 6
2 1 5 3 3*
6 1 1 1 3*
3* 0 2* 0
Figure 3.6: Updated Labels.
We compute
Step 4: Now we choose in . We see that the vertex is matched
with in the matching . Thus we add to the set and the vertex to . After
updating the values we get .Go to Step
3 again.
Step 3: We compute . Since , we compute .
After calculating the value for we decrement the labels for vertices
according to the equation by 1 and on the other hand we increment the label of vertex
32
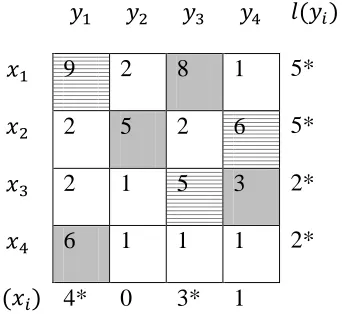
9 2 8 1 5*
2 5 2 6 5*
2 1 5 3 2*
6 1 1 1 2*
4* 0 3* 1
Figure 3.7: Updated Labels.
Step 4: Now we choose in . We see that the vertex is not
matched in the matching . Thus there exists an augmenting path from to . The
following figure shows the tree which has as its root.
‘
Figure 3.8: Alternating Tree. The vertical lines show the non-matched edges whereas the
33 Thus the alternating path is
, }.
Here we construct a new matching by equation
, }
We set and go to Step 2.
9 2 8 1 5*
2 5 2 6 5*
2 1 5 3 2*
6 1 1 1 2*
4* 0 3* 1
Figure 3.9: Final Assignment
Step2:
We see that M is perfect and we get maximum weighted matching with total weight = 22,
34
3.3PINALOG
Several methods have been described for aligning two protein interaction networks. One
of the recent methods proposed by Phan et. al., (2012) for aligning networks of two
species is called PINALOG. It is a global alignment method that takes into account both
the protein sequence as well as the functional similarity between the proteins of two
species. The sequence similarity between the two proteins is calculated using the Blast bit
score whereas the functional similarity is calculated using the Gene Ontology
annotations.
The following section will explain in detail the approach followed by PINALOG method
to align two protein interaction networks. Before describing let us assume and are
two protein-protein interaction networks of two species. The proteins in both the
networks are represented using the notation and where is the protein in
network and is the protein in network . The sequence similarity of two proteins
and is given by the equation
(
)
√ (3.12)
is the BLAST bit score value when aligning and . The functional
similarity ( ) of two proteins is calculated by the method proposed by Schlicker
et al,. (2006). The detailed description of calculating this score is discussed in next
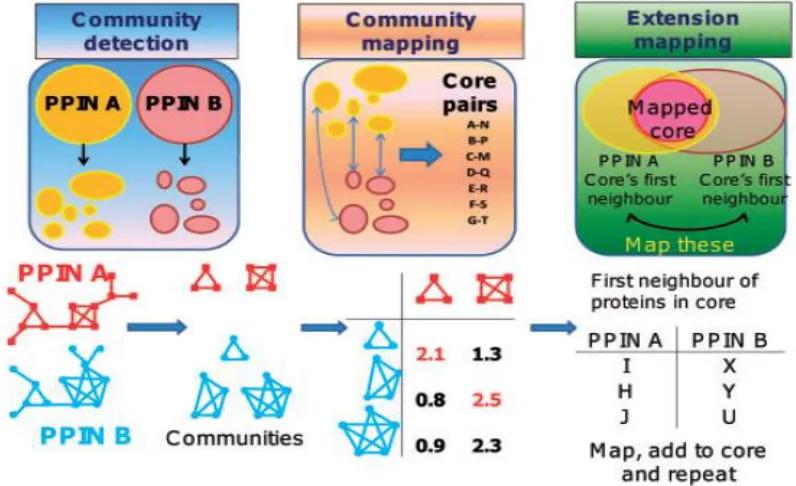
35 3.3.1Methodology
The algorithm for aligning two networks and is divided into three steps.
Figure 3.10: (i) Community Detection (ii) Community Mapping (iii) Extension Mapping
3.3.1.1CommunityDetection
In the first step the algorithm focuses on finding the highly connected sub-networks
within the input networks. The assumption is rather than aligning the whole PPI network
it is efficient and reliable to align two protein interaction networks by first finding highly
similar protein pairs extracted from the highly connected sub-networks.
In biological networks these highly connected sub-networks are referred to as
communities. Thus a community is a sub graph of a network where a set of nodes are
densely connected with each other in comparison with the rest of the network. An
36
Figure 3.11: Example showing three communities in a network.
The process of finding communities from protein interaction networks is called
clustering. Clustering of PPI networks is the task of grouping a set of proteins into groups
(clusters/communities) so that the proteins in the same community are similar to each
other than those in other communities. Several methods have been proposed to detect the
communities. PINALOG uses CFinder (Palla et. al. 2005) which detects overlapping
communities in the given networks. This method of clustering is based on Clique
Percolation method and constructs communities by merging adjacent cliques. The
detailed description of CFinder is given in section 4.2.1.
3.3.1.2CommunityMapping
After the communities have been detected using CFinder this step maps the communities
having the highest similarity score. The communities of two networks are
mapped using Hungarian algorithm. In order to obtain the optimal match between the
37
this matrix are the sum of similarities between the proteins pairs obtained during optimal
mapping (OptMap) of proteins in community in species A with proteins in
community in species B using Hungarian algorithm. Thus the score of community
similarity matrix computed using Hungarian algorithm is given by the equation 3.13
(
) ∑
(3.13)
The matrix constructed using theses scores is then used to obtain optimal assignment of
communities in both the networks and the maximized community scoring
function :
∑
(
)
(3.14)is the total similarity score obtained after matching the communities using
Hungarian algorithm. After obtaining the matched communities, protein pairs matched in
these communities are extracted. These matched proteins are referred to as core proteins.
A filtering step is performed and only 15% of these core pairs are retained and the rest
are discarded.
3.3.1.3:ExtensionMapping
Extension mapping step includes the topology of networks in the alignment. The
neighbors of the core proteins extracted above are considered as candidates for this step
for adding to the alignment. In addition to protein sequence and functional similarity,
topological similarity in the protein interaction networks is also included in the form of
neighborhood similarity. The set of all first neighbors (proteins separated by one
38
in B are denoted by and . Let denote the distance between
in a network. The similarity between and in extension mapping is then
defined as
(
)
(
) ∑
( )
(3.15)
This step aims at adding more protein pair neighbors to the alignment. The optimal
equivalence is obtained by using Hungarian method. These candidates are then added to
the core and this process is repeated until no more pairs can be added.
PINALOG aligns different pairs of protein interaction networks from human , yeast, fly,
worm and mouse and compare its results with IsoRank , MI-GRAAL, Graemlin and
BLAST approach. The dataset is obtained from IntAct database( Aranda et. al. 2010).
PINALOG provides more protein pairs with higher function similarity than IsoRank. This
is because of the combination of sequence, function and network neighborhoods in the
seed-and extension approach of PINALOG. On the other hand, MI-GRAAL, that uses an
integrative approach using sequence, function and topology information, obtains an
alignment with poor function similarity between mapped pairs, less than IsoRank and a
39
CHAPTER 4
MULTIPLE ALIGNMENT OF PROTEIN INTERACTION NETWORKS VIA THREE-INDEX ASSIGNMENT METHOD
4.1Preface
A large amount of data on protein interactions is available which has motivated the
researchers to compare the networks of different species. The alignment of bio-molecular
networks is used for understanding interactions in the networks of different species.
Comparing networks allows us to identify conserved functional modules, predict protein
functions, validate protein interactions, predict protein interactions or discover protein
complexes. To get good results to all of the above advantages we need to formulate an
alignment method that is accurate and efficient. Many researchers have successfully
developed alignment methods for aligning two networks; extending the alignment to
more than two networks becomes difficult as the PPI networks are too large and the
complexity increases at a very high rate. Various methods have been developed for
multiple alignment of PPI networks. In this chapter we propose a method for aligning
multiple PPI network using the solution of Three-Index assignment problem given by
(Huang et. al., 2006).As mentioned in the previous chapter the proposed method is an
extension of a pairwise network alignment method PINALOG.
.
4.2ProposedMethod
In this section we describe a method for aligning three PPI networks using the
methodology followed by PINALOG. PINALOG uses Hungarian algorithm to find
40
to classic two dimensional assignment problem (AP2). Extension of two-dimensional
assignment problem is called a dimensional assignment problem. A
multi-dimensional assignment problem also referred to as multi-index assignment problem is
considered to be a NP-Hard problem. Few algorithms have been proposed for
multi-index assignment problem but most of them focus on the three-multi-index form of the
problem. This is because of the huge computational complexity of the multi-dimensional
form that is N-dimensional assignment problem (AP-N). In this thesis we use a solution
to Three-Index Assignment problem (Huang et. al., 2006) in order to find an optimal
match between the proteins of three species.
Figure 4.1: Summary of proposed method PPI network dataset (three networks as input)
4.2.1.Community Detection (Find communities)
4.2.3.Extension Mapping(Adding neighbors of proteins mapped in community mapping)
41
Using PINALOG methodology as a reference, the above figure shows the steps involved
in alignment of three PPI networks.
4.2.1CommunityDetection
As discussed in previous chapter this step identifies the highly connected sub-networks of
the input PPI networks. The mapped proteins resulting from aligning protein interaction
networks helps us in predicting protein complexes present in the networks and also to
identify functions of the proteins present in these networks. It is known that the highly
connected sub-networks in PPI networks are formed by protein complexes or functional
modules. These identified dense sub-networks are said to be enriched with biological
function. Hence, it is better to find the highly connected sub-graphs of these networks and
align them first. Many algorithms have been proposed to detect these sense sub-networks
in PPI networks called communities. A community is defined as a group of proteins that
are more closely associated with themselves than with the rest of the network (Figure
3.10). The process of finding communities is referred to as clustering. Many clustering
methods have been proposed .In our method we use quite popular clustering method
called CFinder (Palla et.al., 2005) which helps in locating overlapping groups of dense
sub-networks in the PPI networks. This method finds overlapping communities in the
42 4.2.1.1CliquePercolationMethod
Communities are usually defined as dense parts of networks. Majority of the community
detection approaches separate these regions from each other by a relatively small number
of links in a disjoint manner. However, in reality communities may even overlap as well.
If overlapping takes place, a node in the overlap are considered as members of more than
one community. CPM allows in identifying the community overlaps based on
link-density.
In this approach a community is built up from adjacent blocks of the same size k. These
blocks also called as cliques is a maximum complete sub-graph in which all the nodes are
connected to each other thus having the highest possible density. The cliques consist of k
members where each of the k members of the k-clique is linked to every other member.
Two blocks are considered adjacent if they overlap with each other as strongly as
possible, i.e., if they share nodes. Note that removing one link from a k-clique
leads to two adjacent cliques sharing nodes. The k parameter can be chosen
according to the need of the user (suggested value is between 4 and 6). The figure 4.2
(Tang et. al., 2010) shows an example of CPM. In this method a block can be a part of
only one community; however, the nodes may belong to several communities at the same
43
Figure 4.2: Example of clique percolation method
4.2.2CommunityMapping
After the communities have been detected using CFinder this step maps the communities
having the highest similarity score and later extracts the mapped proteins in those
mapped communities. As discussed earlier, in PINALOG the mapping of
communities/proteins is done using Hungarian method. It is an optimization technique
that assigns the proteins of two species in an alignment by maximizing the total score in
polynomial time. PINALOG is a pairwise network alignment method and hence it uses
Hungarian algorithm which deals with two-dimensional assignment problem. Since our
algorithm deals with multiple alignment of protein interaction networks we need to
extend from two-dimensional assignment method to a multi-dimensional (index)
assignment method. A very few algorithms have been proposed for multi-dimensional A sample network
Cliques (k = 3):
{1, 2, 3} , {1,3, 4}, {4, 5, 6},
{5, 6, 7}, {5, 6, 8}, {5, 7, 8},
Communities:
{1, 2, 3, 4}, {4, 5, 6, 7, 8}