Scholarship at UWindsor
Scholarship at UWindsor
Electronic Theses and Dissertations Theses, Dissertations, and Major Papers
2011
Assessment of Suboptimal Effort Using the CVLT-II Recognition
Assessment of Suboptimal Effort Using the CVLT-II Recognition
Foils: A Known-Groups Comparison
Foils: A Known-Groups Comparison
Matias Mariani
University of Windsor
Follow this and additional works at: https://scholar.uwindsor.ca/etd
Recommended Citation Recommended Citation
Mariani, Matias, "Assessment of Suboptimal Effort Using the CVLT-II Recognition Foils: A Known-Groups Comparison" (2011). Electronic Theses and Dissertations. 491.
https://scholar.uwindsor.ca/etd/491
This online database contains the full-text of PhD dissertations and Masters’ theses of University of Windsor students from 1954 forward. These documents are made available for personal study and research purposes only, in accordance with the Canadian Copyright Act and the Creative Commons license—CC BY-NC-ND (Attribution, Non-Commercial, No Derivative Works). Under this license, works must always be attributed to the copyright holder (original author), cannot be used for any commercial purposes, and may not be altered. Any other use would require the permission of the copyright holder. Students may inquire about withdrawing their dissertation and/or thesis from this database. For additional inquiries, please contact the repository administrator via email
Assessment of Suboptimal Effort Using the CVLT-II Recognition Foils:
A Known-Groups Comparison
by
Matias Mariani, M.A.
A Dissertation
Submitted to the Faculty of Graduate Studies through the Department of Psychology in Partial Fulfillment of the Requirements for
the Degree of Doctor of Philosophy at the University of Windsor
Windsor, Ontario, Canada 2009
Author’s Declaration of Originality
I hereby certify that I am the sole author of this thesis and that no part of this
thesis has been published or submitted for publication.
I certify that, to the best of my knowledge, my thesis does not infringe upon
anyone’s copyright nor violate any proprietary rights and that any ideas, techniques,
quotations, or any other material from the work of other people included in my thesis,
published or otherwise, are fully acknowledged in accordance with the standard
referencing practices. Furthermore, to the extent that I have included copyrighted
material that surpasses the bounds of fair dealing within the meaning of the Canada
Copyright Act, I certify that I have obtained a written permission from the copyright
owner(s) to include such material(s) in my thesis and have included copies of such
copyright clearances to my appendix.
I declare that this is a true copy of my thesis, including any final revisions, as
approved by my thesis committee and the Graduate Studies office, and that this thesis has
Abstract
The present study sought to generate an embedded effort index within the
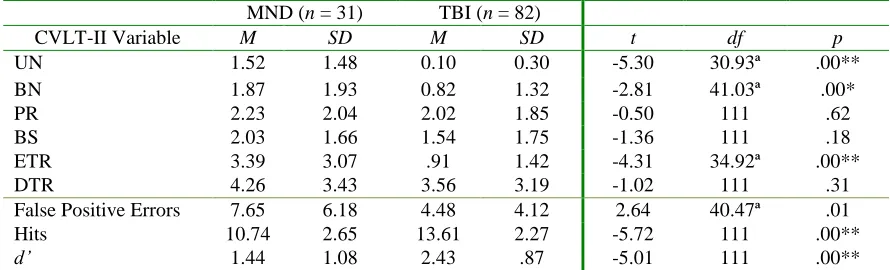
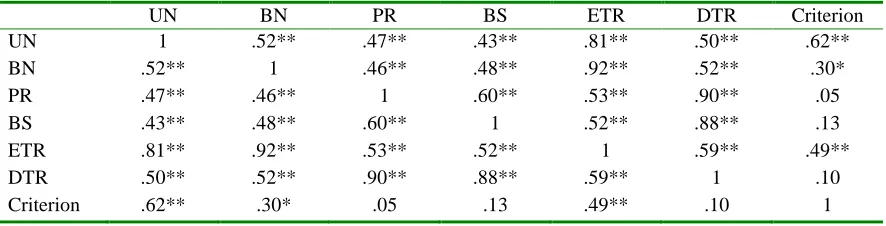
CVLT-II yes/no recognition trial using a known-groups design. Four types of recognition
foils—i.e., novel/semantically unrelated (UN), novel/semantically related (PR), list
B/semantically unrelated (BN), and list B/semantically related (BS)—as well as two
composites—i.e., easy to reject foils (ETR) and difficult to reject foils (DTR)—were
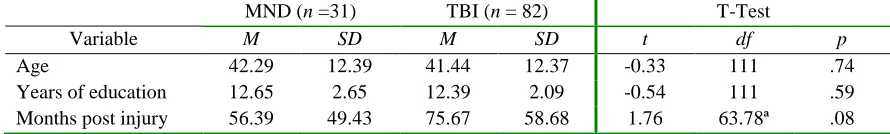
evaluated on their ability to distinguish between a group of 82 outpatients with
moderate-severe traumatic brain injuries (TBI) and a group of 31 litigants meeting Slick et al.
(1999) criteria for malingered neurocognitive dysfunction (MND). Separate multiple
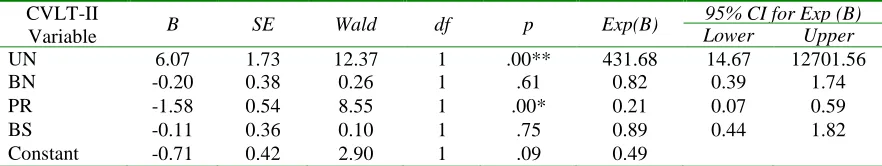
logistic regression analyses were performed. The full model based on the 4 foils
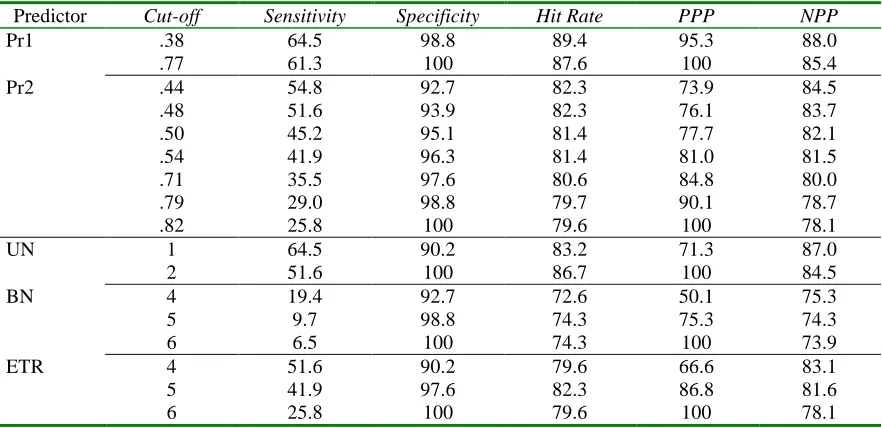
correctly classified 88.5% of cases (61.3% sensitivity/98.8% specificity). The full model
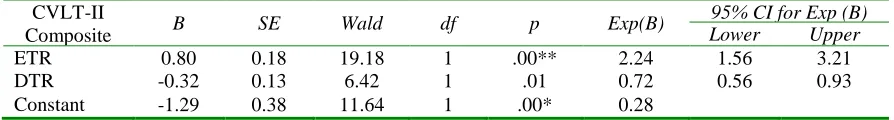
based on the composites correctly classified 81.4% of cases (45.2% sensitivity/95.1%
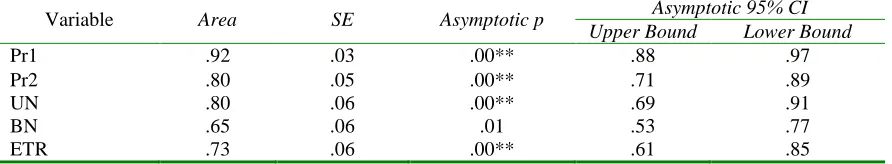
specificity). With respect to univariate predictors, UN correctly classified 51.6-64.5% of
MND cases and 90.2-100% of TBI cases depending on the diagnostic cut-off used. ETR
also showed good classification accuracy (25.8-51.6% sensitivity/90.2-100% specificity).
Three different ratios were generated from the original analyses—UN/PR,
UN/(PR+BN+BS), and ETR/DTR. All three ratios yielded good to excellent diagnostic
accuracy (87% sensitivity/98.4% specificity, 70.4% sensitivity/97% specificity, and
38.5% sensitivity/95.5% specificity, respectively). In addition, UN, ETR, and the
multivariate equations were cross-validated with a group of 19 patients with complicated
mild TBI supplying adequate effort (MTBI) and a group of 23 patients with complicated
mild TBI performing poorly on effort measures (SE), resulting in high specificity values
(Coleman et al., 1998; Curtis et al., 2006; Millis et al., 1995; Millis et al., 2007; Sweet et
al., 2000) was replicated.
Overall, the UN variable, the ETR composite, both multivariate equations, and all
three ratios derived from the foils of the CVLT-II yes/no recognition trial show
considerable merit as embedded effort indices. Positive and negative predictive power
values are provided for all predictors at various diagnostic cut-offs across 5 hypothetical
base rates in order to facilitate generalization of findings to different settings. Clinical
Dedications
This manuscript is dedicated to my wife Melanie, my parents Aldo and Edith, and
my siblings Marcos, Carolina, and Lucas. My accomplishments could not have been
Acknowledgements
The author gratefully acknowledges Dr. D. Shore for his mentorship and support
throughout the author’s graduate career.
In addition, the author is appreciative of Dr. R. Hanks for allowing access to her
office resources and case files at the Research Institute of Michigan (Detroit, MI) and
Psychological Systems Inc. (Royal Oak, MI); Dr. S. Millis for providing valuable
statistical advice and comments; and Mr. R. Kotasek for assisting with the initial steps of
database preparation.
Finally, the author would like to thank Dr. A. Baird, Dr. D. Jackson, Dr. P.
Graniero, and Dr. B. Axelrod for their constructive feedback and recommendations
throughout the different stages of the dissertation process, Dr. T. Snyder, Ms. J. Koushik,
and Ms. M. Fielding for their comments on the manuscript, and Dr. N. Fisher for her
Table of Contents
Author’s Declaration of Originality iii
Abstract iv
Dedications vi
Acknowledgements vii
List of Abbreviations ix
I. Introduction 1
TBI 3
Malingering 9
Symptom Validity Testing 15 Floor Effect Analyses 20
Embedded Indices 21
CVLT and CVLT-2 Research 28
II. Method 35
Participants 35
Materials and Procedure 41
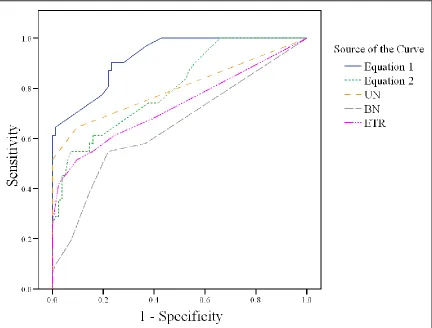
III. Results 42
Logistic Regression Analyses for CVLT-II Foils 43 Logistic Regression Analyses for CVLT-II Composite Scores 49 Receiver Operating Characteristics (ROC) Curve 52 Cut-off Scores Analyses 53 Examination of Misclassified TBI Cases 56 Examination of Misclassified MND Cases 57 Post-hoc Ratio Analyses 60 Analyses of MVA Subsample 64 Cross-Validation of Original Sample with Other Models 69 Cross-Validation of Predictors with Other Samples 71
IV. Discussion 74
References 89
Appendix 104
List of Abbreviations
ACRM American Congress of Rehabilitation Medicine AF Affective Disorders Scale, SIMS
AM Amnestic Disorders Scale, SIMS APA American Psychiatric Association BMA Bayesian Model Averaging
BN Semantically Unrelated List B Recognition Item, CVLT-II BS Semantically Related List B Recognition Item, CVLT-II CIA Critical Item Analysis, CVLT-II
CDC Centre for Disease Control and Prevention
CVLT California Verbal Learning Test, (-II) Second Edition d’ Recognition Discriminability, CVLT and CVLT-II
DSM-IV TR Diagnostic and Statistical Manual of Mental Disorders, Fourth Edition, Text Revision
DR Delayed Recognition, WMT
DTR Difficult to Reject Composite, CVLT-II ETR Easy to Reject Composite, CVLT-II FBS Fake Bad Scale, MMPI-II
FCR Forced-choice Recognition Total, CVLT-II FMS Failure to Maintain Set, WCST
FTT Finger Tapping Test, (-d) dominant hand, (-nd) non-dominant hand GCS Glasgow Coma Scale
IR Immediate Recognition, WMT JOLO Judgment of Line Orientation
LDCR Long-Delay Cued Recall, CVLT and CVLT-II LDFR Long-Delay Free Recall, CVLT and CVLT-II LI Low Intelligence Scale, SIMS
LOC Loss of Consciousness
MMPI-II Minnesota Multiphasic Personality Inventory, Second Edition MND Malingered Neurocognitive Dysfunction
NIM Negative Impression Management Scale, PAI NPP Negative Predictive Power
P Psychosis Scale, SIMS
PAI Personality Assessment Inventory PPP Positive Predictive Power
PR Prototypically Related Novel Recognition Item, CVLT-II PTA Post-traumatic Amnesia
PTSD Post-traumatic Stress Disorder
RDS Reliable Digit Span, WAIS-R and WAIS-III RIM Rehabilitation Institute of Michigan
RMT Recognition Memory Test
ROC Receiver Operating Characteristic
SDCR Short-Delay Cued Recall, CVLT and CVLT-II SDFR Short-Delay Free Recall, CVLT and CVLT-II
SDMT Symbol Digit Modality Test, (-O) Oral Version, (-W) Written Version SEMTBIS South-eastern Michigan Traumatic Brain Injury System
SIMS Structured Inventory of Malingered Symptomatology SR Sentence Repetition
SVT Symptom Validity Test TBI Traumatic Brain Injury
TMT Trail Making Test, (-A) Part A, (-B) Part B TT Token Test
TOMM Test of Memory Malingering
UN Semantically Unrelated Novel Recognition Item, CVLT-II V-DS Vocabulary-Digit Span Discrepancy, WAIS-R and WAIS-III VFD Visual Form Discrimination
WAIS Wechsler Adult Intelligence Scale, (-R) Revised, (-III) Third Edition WCST Wisconsin Card Sort Test
Introduction
A traumatic brain injury (TBI)is any damage to the brain caused by an external
mechanical force applied to the head (South-eastern Michigan Traumatic Brain Injury
System [SEMTBIS], 2004). TBIs can occur from acceleration or deceleration forces
and/or physical deformation of the skull from blunt trauma to the head (i.e., closed head
injury; e.g., via motor vehicle accidents, falls, sports collisions, etc.), which may
subsequently cause diffuse axonal injury, focal axonal shearing, contusions, subdural
haematomas, and intracerebral haemorrhages (Bigler, 2001; Greenberg, Aminoff, &
Simon, 2002; Rao & Lyketsos, 2000). Alternatively, TBIs can result from penetrating
objects (e.g., gunshot wounds, open skull fractures, etc.), which result in severe
lacerations of brain tissue (Blumenfeld, 2002; Grubb & Coxe, 1974). Secondary damage
from TBIs can result from cerebral oedema, hypoxia, ischemia, compromised cerebral
vasculature, and increased intracranial pressure, which may consequently cause a
herniation syndrome (Bigler, 2001; Blumenfeld, 2002). Due to the range of mechanisms
of injury, the clinical presentation of TBI can vary. In addition, TBI appears highly
susceptible to feigning and exaggeration because its symptoms are generally non-specific
and diffuse, and because there is a wealth of information readily accessible to the public
(Tan, Slick, Strauss, & Hultsch, 2002; Wise, Oliveira, Lacy, Han, & Pyykkonen, 2006).
Thus, it is imperative for clinicians to conduct thorough assessments and consider all
possible differential diagnoses when formulating cases presenting with possible head
trauma.
Consequently, the aims of this paper are as follows. First, this paper reviews the
commonly used to stage severity of injury—namely, loss of consciousness (LOC),
post-traumatic amnesia (PTA), Glasgow Coma Scale score (GCS; Teasdale & Jennett, 1974),
and significant findings on neuroimaging. Second, this paper examines the definition of
malingering, its prevalence in medical and forensic settings, its diagnostic criteria, and its
differential diagnoses. Third, it highlights the stand-alone tests and embedded indices
that are most frequently used to determine suboptimal effort output, symptom
exaggeration, and negative response bias. Fourth, an emphasis is placed on evaluating
the California Verbal Learning Test – second edition (CVLT-II; Delis, Kaplan, Kramer,
& Ober, 2000) as a potential tool for detecting suboptimal effort output. More
specifically, this study investigates the utility of the CVLT-II yes/no recognition foils to
differentiate between patients with moderate-severe TBI and litigants with questionable
head injuries putting forth suboptimal effort. From the yes/no recognition foils, it is
hypothesized that those novel and semantically unrelated to the target list items will be
the best predictors of suboptimal effort output in this known-groups design. Finally, the
variables found to distinguish between moderate-severe TBI and litigants with
insufficient effort are cross-validated with two additional samples—patients with
complicated mild TBI supplying adequate effort and patients with complicated mild TBI
performing poorly on effort measures—in an effort to generalize the findings.
Collectively, the overarching goals of this study are to develop a new effort index
embedded within the CVLT-II yes/no recognition trial that has high sensitivity and
specificity and can help reduce time spent administering stand-alone symptom validity
TBI
The paramount feature of TBI is a loss of consciousness (LOC) following trauma,
with increased lengths of LOC being associated with poorer prognosis. In general, the
symptoms that accompany a TBI may include headaches and neck pain, confusion and
disorientation, dizziness, fatigue, sleep disturbances, memory problems, mood changes,
slowed processing, and difficulties with attention and concentration, as well as nausea,
blurred vision, tinnitus, hypersensitivity to stimuli, and loss of smell or taste (Centers for
Disease Control and Prevention [CDC], 1999; Rao & Lyketsos, 2000; Ziino & Ponsford,
2005). With this extensive list of symptoms, differential diagnosis can be a daunting
task. In addition, the nomenclature of injury severity in TBI is somewhat inconsistent,
especially when dealing with cases at the mild end of the severity spectrum. Because of
the ambiguity in symptomatology and inconsistency in classification of injury severity
and prognosis, Teasdale and Jennett (1974) devised the Glasgow Coma Scale (GCS).
The GCS is a widely used instrument that quantifies the depth and length of a coma based
on 3 types of responses to external stimuli (i.e., eye, verbal, and motor) that are assessed
as early as possible following trauma. Based on the patient’s score, the brain injury can
be classified as mild (13-15), moderate (9-12) and severe (3-8) (Teasdale & Jennett,
1974). By formulating a standard for injury indexing, Teasdale and Jennett afforded
professionals from different fields the ability to communicate information easily between
each other when treating a comatose patient. However, because the GCS is
time-dependent (i.e., it is administered during triage) and because the arrival of medical
assistance varies widely, the time between the point of injury and test administration
injuries than they may have (Ruff & Jurica, 1999). Moreover, because the symptoms of
TBI may not surface immediately following injury (Reitan & Wolfson, 2000), some
patients may be undiagnosed altogether if the GCS is used as the sole severity indexing
tool. In addition, GCS scores tend to be poorer with the presence of alcohol intoxication
(Jagger, Fife, Vernberg, & Jane, 1984), indicating that some patients may receive worse
scores during the initial assessment but may show an improvement in neurocognitive
status once their inebriation has subsided. Thus, although the GCS was a vast
improvement towards the standardization of injury classification, the variability of
contextual factors surrounding the time of injury makes its use somewhat limited with
respect to atypical cases. Finally, because the GCS is meant to be used in the first few
hours following injury (i.e., acute phase), its purpose is limited when used retroactively.
These caveats notwithstanding, GCS is the most widely used tool in the literature for
estimating severity of brain injury following trauma.
Alternatively, some clinicians rely on LOC and posttraumatic amnesia (PTA) to
base their estimates of severity of injury because these variables can be used
retrospectively. LOC is normally calculated by the time it takes for the patient to be able
to follow commands such as ―raise your hand‖ or ―stick out your tongue.‖ PTA is
defined as the period of time from the point of injury until the individual has continuous
recall of ongoing events (Whyte & Rosenthal, 1988). Because PTA is assessed through
direct querying, it can only be determined after LOC has subsided. Unfortunately, as
with many aspects of assessment, there is a degree of clinical judgment involved in
determining when responses are ―continuous‖ enough for PTA to be considered lifted,
reported as correlating well with GCS (Levin, Grossman, & Benton, 1982, as cited in
Lezak, 1995) and as being a strong predictor of outcome at 18 months and 3 years
post-injury (Tate, Harris, Cameron, Myles, Winstanley, Hodgkinson, Baguley, & Harradine,
2006). Overall, depending on the duration of a LOC and PTA as well as the presence of
focal neurological signs, the prognosis of a TBI can vary from mild and transient to
severe and permanent (Blumenfeld, 2002; Dikmen, Machamer, Winn, & Temkin, 1995;
Reitan & Wolfson, 2000).
Bigler (1988) classifies individuals as having sustained a moderate TBI if they
present with LOC lasting at least 1 hour and PTA lasting up to 24 hours. In the event that
the individual is alert but displays focal neurological signs and PTA, a moderate TBI
classification is also warranted. A TBI is considered severe when a patient is fully
comatose for more than 1 day, has PTA lasting between 1 and 7 days or more, and shows
motor deficits and pathologic reflexes (Bigler, 1988; Rao & Lyketsos, 2000). Recovery
following a moderate TBI is favourable but not complete, whereas recovery following a
severe TBI is more limited, particularly in older adults (Goleburn & Golden, 2001;
Goldstein & Levin, 2001). Although there is some improvement expected to occur in
cognitive functioning in patients with moderate-severe TBI within the first two years
after injury, their cognitive profiles remain significantly impaired compared to controls
beyond two years post-injury (Schretlen & Shapiro, 2003). In general, there appears to
be a consensus as to what constitutes moderate and severe TBI. With respect to the
classification of mild TBI, however, the inclusion criteria differ slightly depending on the
stringency employed by specific studies as well as depending on the different settings
Mild TBI, also known as a concussion, is defined as a ―reversible impairment of
neurological function for minutes to hours following a head injury‖ (Blumenfeld, 2002,
p. 142). Bigler (1988) defines it as a transient loss or alteration in consciousness in the
absence of definite localizing or lateralizing signs, and accompanied by an amnesic
period lasting no longer than 1 hour. Additionally, although the text revision of the 4th
edition of Diagnostic and Statistical Manual of Mental Disorders (DSM-IV-TR;
American Psychiatric Association [APA], 2000) does not have a classification
specifically for mild TBI (or any TBI except for ―dementia due to head trauma,‖ p. 164),
the proposed diagnostic criteria for postconcussional disorder appear comparable to other
mild TBI classifications. Specifically, the DSM-IV-TR criteria involve a transient LOC
lasting no longer than 5 minutes, followed by PTA lasting less than 12 hours (APA,
2000). Conversely, other researchers define mild TBI as a period of LOC less than or
equal to 20 minutes and/or accompanied by brief PTA, a GCS of 13 and above, no focal
neurological deficit, no intracranial complications (e.g., haemorrhage), and normal
findings on neuroimaging (Alexander, 1995; Gennarelli, 1986; Goldstein & Levin, 2001).
Finally, the American Congress of Rehabilitation Medicine (ACRM; 1993) also
established guidelines to classify mild TBI in efforts to clear the diagnostic picture. The
criteria used by the ACRM included at least one of the following characteristics: any
LOC or alteration of mental state following trauma that is less than 30 minutes in length,
any loss of memory immediately before or after the trauma lasting less than 24 hours,
focal neurological deficit that may or may not be transient, and a GCS score of at least 13
as assessed 30 minutes post-trauma (ACRM, 1993). However, taking any of these
potential discrepancies in the classification systems. For example, if an individual
presents with 20 minutes of LOC, they would not be considered to have mild TBI
according to the DSM-IV-TR but they would still meet the mild TBI criteria as defined
by Alexander (1995). In addition, a person displaying a PTA period lasting 22 hours
would be considered to have a moderate TBI according to Bigler (1988) but a mild TBI
according to the ACRM. Thus, there appears to be quite a bit of overlap between injury
labels depending on the different classification systems. As a result, Dikmen, Machamer,
and Temkin (2001) compared the different indexing cut-offs used by different researchers
and clinicians in efforts to clear the ambiguity regarding the definition of mild TBI as
well as to assess how well those specific injury severity variables correlate with
neuropsychological tests sensitive to brain injury. Specifically, they divided a sample of
individuals with mild TBI into four groups according to different measures of head injury
severity and evaluated the neuropsychological profiles of each group against a group of
trauma patients without head injuries. Group 1 consisted of individuals with GCS scores
13-15 but no other restrictions, whereas Groups 2 through 4 had additional criteria (LOC
< 1 hour, negative CT scans, and PTA <= 24 hours) increasing in stringency whereby
Group 4 individuals had to meet all the aforementioned criteria. The results showed that
Group 1 differed from the control group on verbal recall, but on no other task at 1 month
post-injury. Additionally, there were no other significant differences between the
experimental groups and the control group on any measures at 1 month or 12 months
post-injury. In general, the more stringent the criteria used to define mild TBI, the less
likely there were any differences in neuropsychological performance compared to the
would involve a GCS score of 13 or higher, LOC less than 1 hour, negative findings on
neuroimaging, and PTA up to 24 hours. Groups meeting these criteria would be expected
to have complete recovery of neuropsychological functioning beyond 1 month
post-injury.
On somewhat rare occasions, individuals have been reported as experiencing
prolonged effects following a mild TBI—known as persistent post-concussive syndrome
(Alexander, 1995; Blumenfeld, 2002)—which may be caused and/or maintained by
premorbid factors such as chronic emotional or psychological distress, neurological or
psychiatric illness, learning disability, alcohol abuse, and tendency for somatization, as
well as low pre-injury baseline functioning (Babin, 2002; Dikmen et al., 2001; Millis &
Volinsky, 2001; Rao & Lyketsos, 2000; Reitan & Wolfson, 2000). Likewise, when an
individual’s measures of acute injury severity fall within the mild TBI range but there is
evidence of neurological insult, the TBI is classified as ―complicated‖ mild because its
effect on neuropsychological sequelae is comparable to moderate TBI (Heinly, Greve,
Bianchini, Love, &Brennan, 2005; Millis, Putnam, Ricker, & Adams, 1995).
However, with respect to uncomplicated mild TBI, complete recovery to
premorbid levels of functioning is typically reached within 1 to 3 months post-trauma,
with most rapid recovery occurring within the first few weeks post-injury (Dikmen et al.,
1995; Gentilini, Nichelli, & Schoenhuber, 1989; Goldstein & Levin, 2001; Ponsford et
al., 2000). As a rule of thumb, there is a dose-response relationship between injury
severity and cognitive impairment (Rohling, Meyers, & Millis, 2003; Schretlen &
Shapiro, 2003), whereby more impaired patients tend to perform worse on
symptoms beyond the 3-month time frame that are inconsistent with the severity of injury
after all complications have been ruled out, a secondary explanation (e.g., psychological,
motivational, etc.) must be entertained as the possible source of the symptomatology.
Above all, the question of suboptimal effort output must be raised when individuals who
sustained an uncomplicated mild TBI are in litigation or there is a potential for external
incentive, because these contextual factors have been found to account for moderate
effect sizes on negatively biased neuropsychological performance (Bianchini, Curtis, &
Greve, 2006; Binder & Willis, 1991; Millis & Volinsky, 2001).
Malingering
Malingering has been defined as a negative response bias ―designed to achieve
some identifiable incentive‖ (Iverson & Binder, 2000, p. 832). The negative response
bias can be in the form of exaggerated physical or psychological symptoms, while the
external incentive can take the form of receiving financial compensation, avoiding
military duty, avoiding work responsibility, obtaining drugs, escaping criminal
prosecution, or evading liability in some way (APA, 2000; Slick, Sherman, & Iverson,
1999). With respect to TBI, malingering is typically manifested as diffuse and
nonspecific neurological complaints, such as deficits in processing speed, memory, motor
skills, sensation, abstract problem-solving skills, and fund of knowledge, as well as
emotional disruption and non-epileptic seizures (Franzen & Iverson, 1998; Lynch, 2004).
The key to a classification of malingering is that the exaggeration behaviour must be
rational and intentional, and not due to an alternative explanation such as a psychiatric or
neurological disorder (Iverson & Binder, 2000). Thus, when performing a differential
conditions that may be contributing to or exacerbating the observed behaviour.
Explicitly, conversion disorder, factitious disorder, major depression disorder, and
post-traumatic stress disorder (PTSD) tend to have profiles that overlap greatly with symptoms
routinely observed in TBI as well as with deficits commonly exaggerated by malingerers.
Factitious disorder, conversion disorder, and other somatoform disorders consist of
symptom fabrication, but, unlike malingering, these disorders involve psychological
rather than external incentives (APA, 2000; Iverson & Binder, 2000; Slick et al., 1999).
In addition, conversion disorder and other somatoform disorders are distinguished from
malingering and factitious disorder by the fact that the motivation of the behaviour is
unconscious in nature (APA, 2000; Babin, 2002).
Major depression must be ruled out when performing differential diagnoses
because it may mimic some aspects of malingering and TBI such as low motivation, lack
of cooperation, apathy, negative views of personal functioning, long response lags,
distractibility, cognitive slowing, and memory problems as well as headaches, excessive
worry over health, and irritability (APA, 2000; Bordini, Chaknis, Ekman-Turner, &
Perna, 2002; Iverson & Binder, 2000; Rao & Lyketsos, 2000). Lastly, individuals with
PTSD tend to present with low cooperation, altered recall of aspects of the traumatic
event, difficulties with concentration and memory, mood disturbance, irritability, absent
―organic indicators,‖ avoidance behaviour, and other apparent inconsistencies that might
be misinterpreted as displays of suboptimal effort or malingering (Bordini et al., 2002, p.
94). In the case of PTSD, a lack of purposeful exaggeration or fabrication of symptoms
would differentiate it from malingering. Lastly, some of these disorders can actually
malingering should be very thorough because of the potentially aversive consequences
carried by a misdiagnosis (e.g., delayed treatment) and because of the negative
implications carried by such a label.
The DSM-IV-TR does not have a formal diagnosis for malingering; instead,
malingering is in the ―additional conditions that may be a focus of clinical attention‖
section (APA, 2000, p. 739). Although there were several tentative criteria for
identifying malingering prior to 1999 (e.g., Greiffenstein, Baker, & Gola, 1994; Nies &
Sweet, 1994; Pankratz, 1988), a uniform classification system was lacking, which
prompted Slick et al. (1999) to formulate a set of comprehensive criteria based on test
performance and specific contextual factors. Specifically, the proposed criteria for a
diagnosis of Malingered Neurocognitive Dysfunction (MND) involve the presence of
substantial external incentive (i.e., criterion A), as well as evidence of suboptimal
performance from neuropsychological test data (i.e., criterion B) and/or self-report data
suggestive of symptom exaggeration (i.e., criterion C) that cannot be due to psychiatric,
neurological or developmental factors (i.e., criterion D).
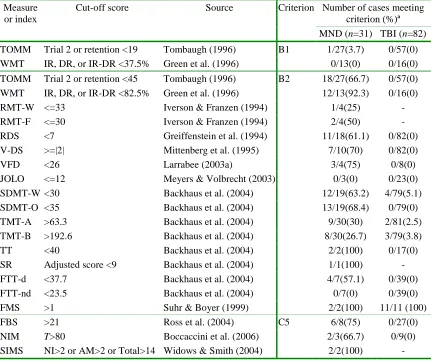
Within criterion B, an individual can be classified as displaying a definite
response bias (B1) if they perform below chance levels (p < .05) on tests specifically
designed to detect feigned cognitive dysfunction, such as the Test of Memory
Malingering (TOMM; Tombaugh, 1996). A classification of probable response bias (B2)
results when the individual’s performance is consistent with feigning on one or more
well-validated psychometric tests or indices designed to measure exaggeration or
fabrication of cognitive deficits (e.g., Digit Span-Vocabulary discrepancy; Mittenberg,
exhibiting a probable response bias when there is a discrepancy between test data and
known patterns of brain functioning (B3), observed behaviour (B4), the reports of
trustworthy collaterals (B5), or documented background history (B6; Slick et al., 1999).
Evidence satisfying criterion C can take the form of discrepancy between reported and
documented history (C1); discrepancy between reported symptoms and known patterns of
brain functioning (C2); discrepancy between reported symptoms and behavioural
observations (C3); discrepancy between reported symptoms and information from
collateral informants (C4); and evidence of exaggerated or fabricated psychological
dysfunction (C5) from well-validated validity scales or indices from self-report measures,
such as the Fake Bad Scale (Lees-Haley, English, & Glenn, 1991). Because there are no
actual ―gold standard‖ tests available to classify someone as malingering with 100%
certainty, Slick et al. (1999) formulated their criteria to account for different degrees of
certainty—namely, ―possible MND‖, ―probable MND‖, and ―definite MND‖—
depending on the amount of evidence available. Consequently, these researchers have
suggested using several sources of data as converging lines of evidence for a diagnosis of
malingering (see Table 2 of Slick et al., 1999, for complete list of diagnostic criteria).
Unfortunately, but not surprisingly, it is very unlikely that an individual will
divulge that they are feigning or exaggerating their symptoms during testing, especially
when they are in litigation and there is a potential for secondary compensation (i.e.,
external incentive). Because of this absence of candour, actual prevalence rates of
symptom over-reporting or feigning are unknown and must be estimated from base rates
depending on the setting (Millis & Volinsky, 2001). Base rates are the number of cases
specific setting. From different studies, the prevalence of suboptimal effort output has
been reported as falling between 2-26% in clinical settings (Meyers & Volbrecht, 2003;
Schretlen, 1988, as cited in Root, Robbins, Chang, & Van Gorp, 2006) and as ranging
between 25% and 59% in forensic-based practices or in settings with potential for
secondary gain (Greiffenstein & Baker, 2006; Greiffenstein et al., 1994; Larrabee, 2003a;
Millis et al., 1995; Root et al., 2006). Slick, Tan, Strauss, and Hultsch (2004) conducted
a recent survey on 24 neuropsychologists that specialize in detecting suboptimal effort
output, which showed that the majority of them estimate the base rate of suboptimal
effort output to be at least 10%. In comparison, Mittenberg, Patton, Canyock, and Condit
(2002) surveyed 131 neuropsychologists and found that their estimates of suboptimal
effort output ranged widely depending on their practice setting. Specifically, the base
rates of probable malingering were noted as 8% for medical cases, 19% for criminal
cases, 29% for personal injury claims, and 30% for disability claims. In the same vein,
when Larrabee (2003a) pooled the results of 11 studies on suboptimal effort output, he
found an average base rate of 40% for cases in neuropsychological settings with potential
for secondary compensation. Thus, it appears that the prevalence of malingering may
have been underestimated by the neuropsychologists surveyed by Slick et al. (2004).
Because of the high incidence of TBI in North America (CDC, 1999; Canadian
Institute for Health Information, 2006) and because it is commonplace for individuals to
seek some type of compensation following injury (Etcoff & Kampfer, 1996), there has
always been a need to develop techniques to adequately assess the validity of reported
symptoms. Thus, to address this issue, clinicians and researchers have employed several
the inconsistencies mentioned above, the most common performance-based approaches
used to identify negative response bias consist of evaluating specialized tests of effort and
atypical patterns of performance on conventional neuropsychological tests (Iverson &
Binder, 2000; Millis & Volinsky, 2001; Slick et al., 1999; Slick et al., 2004). Prior to
examining the different types of symptom validity measures and indices, however, it is
important to address the terms commonly used to assess each test’s validity. Essentially,
a test or procedure is assessed by its diagnostic hit rate, sensitivity, specificity, and
predictive power (Altman & Bland, 1994; Etcoff & Kampfer, 1996; Larrabee, 2003a;
Mathias, Greve, Bianchini, Houston, & Crouch, 2002; Millis et al., 1995; Millis &
Volinsky, 2001).
The hit rate is the total percentage of individuals correctly classified by the test.
Sensitivity is the true positive rate for a test—i.e., the proportion of individuals supplying
poor effort correctly classified as malingering. Specificity, on the other hand, is the true
negative rate for a test—i.e., the percentage of individuals giving good effort correctly
classified as not malingering. Positive predictive power (PPP) is calculated as the true
positive value over the total number of individuals in the population receiving positive
scores on a test (i.e., true and false positives; see equations A1 and A2 in the Appendix).
It denotes the probability that an individual who received an abnormal test score on a test
actually has the purported condition. In the case of malingering, PPP signifies the
proportion of individuals receiving positive scores on a malingering test that were
accurately labelled as malingerers. Negative predictive power (NPP) is calculated as the
true negative value over the total number of individuals receiving negative scores (i.e.,
malingering, it represents the proportion of individuals receiving malingering-negative
scores that were accurately labelled as non-malingerers. Both PPP and NPP are
dependent on the accuracy of the test as well as the base rate of malingering in the
population of interest (Heinly et al., 2005).
When developing tests or indices of insufficient effort, the goal is to achieve high
sensitivity while minimizing the number of individuals falsely identified as malingering
(i.e., reducing false positive errors). As mentioned, because there are no gold standards
available with 100% sensitivity and 100% specificity, each clinician must decide the
degree of accuracy with which to judge an individual’s effort output. Consequently, the
general practice is to judge tests and their respective cut-offs as optimal if they produce
false positive error rates less than or equal to 10% (Ashendorf, O’Bryant, & McCaffrey,
2003; Greiffenstein, et al., 1994; Mathias et al., 2002; Millis, 1992; Millis et al., 1995).
Stated differently, the goal of effort-based diagnostic tests is to achieve at least 90%
specificity. With respect to PPP, there are no specific cut-offs to determine what is
adequate but there is a consensus that any value above 50% suffices because it indicates
that there is more than .50 probability that the person is exaggerating their
symptomatology (i.e., ―more probable than not‖; Curtis, Greve, Bianchini, & Brennan,
2006, p. 59; see also Heinly et al., 2005). Moreover, it is important to note that any test
yielding a false positive error rate of 0% (i.e., 100% Specificity) is associated with a PPP
of 100% regardless of the test’s sensitivity as long as its sensitivity is greater than zero
(Coleman, Rapport, Millis, Ricker, & Farchione, 1998; Heinly et al., 2005; Millis, 2003).
Symptom validity testing. The vast majority of neuropsychologists (79%) recently
al., 2004). SVTs are tools specifically designed to assess symptom exaggeration and
negative response bias. Their format usually involves the presentation of some type of
stimulus, which the participant must select after a delay from a series of forced choices
with two alternatives (Lynch, 2004). Many of the items making up SVTs appear difficult
at face value but are often very simple and largely unaffected by neurological disorders
(Iverson & Binder, 2000; Millis et al., 1995). Consequently, malingerers tend to
overestimate the degree to which they must feign their responses, resulting in poorer
scores than those from patients with genuine head injuries or severe neuropathology, who
actually tend to perform well (Frederick & Speed, 2007; Green, Allen, & Astner, 1996;
Tombaugh, 1996).
There are two ways to analyze the results from SVTs in order to determine
whether an individual is exaggerating symptoms or expending suboptimal effort—(1)
evaluating whether the score is significantly below chance (Binder & Willis, 1991) or (2)
evaluating whether the score is below an experimentally set cut-off derived from known
samples (Iverson & Binder, 2000). Because performing significantly below chance is
very uncommon and very unlikely to be due to variability in responding, such low scores
tend to occur only when the examinee is purposely exhibiting a negative response bias,
and receiving such scores are as close to a ―gold standard‖ as malingering diagnostic tests
get (Slick et al., 1999). However, using below chance cut-offs (i.e., 2 SDs) tends to yield
high specificity at the expense of low sensitivity, resulting in many false negatives
(Franzen & Iverson, 1998; Millis et al., 1995). Alternatively, the experimental cut-off
approach consists of establishing floor performances for persons with brain injuries and
2000). Scores below these floor cut-offs are suggestive of exaggerated symptom
reporting because they are ―inconsistent with the performance of that population‖ (p.
838). Although there are several SVTs available, the following three measures are
well-validated and among the most widely used (Slick et al., 2004).
The Test of Memory Malingering (TOMM) is an SVT designed to assess memory
complaints (Tombaugh, 1996). It consists of two consecutive trials in which the
individual is presented with visual stimuli consisting of 50 line drawings of common
objects followed by a two-choice discrimination task where they are required to pick the
target response. If the individual identifies fewer than 45 items on trial 2, an optional
retention trial is administered 15 minutes later without the benefit of another learning
trial. Scores below 45 on trial 2 or on the retention trial are suggestive of suboptimal
effort output. Through a series of studies, Tombaugh (1997) showed that using the
criterion of 45 correct responses, the TOMM readily detected simulators told to
exaggerate memory deficits (i.e., 100% sensitivity) while correctly classifying 99% of
cognitively intact community dwellers and 95% of neurologically impaired outpatients,
including patients with TBI, amnesia, and aphasia. In contrast, Tan et al. (2002) found
lower classification rates (i.e., 74.1-80.8% sensitivity and 96.4% specificity) when using
a simulation-based study design with the TOMM. Nonetheless, Tombaugh and others
have shown that the TOMM is unaffected by differences in age, education, depression,
psychosis, or severe neuropathology, and is only moderately affected by moderate to
severe dementia (Duncan, 2005; Rees, Tombaugh, Gansler & Moczynski, 2002;
Another commonly used two-alternative SVT is the Recognition Memory Test
(RMT; Warrington, 1984). It consists of two 50-item subtests—one with faces as stimuli
and the other with words—and it uses a recognition paradigm much like the TOMM. It
has previously been used to detect potential malingerers complaining of mild TBI (Millis,
1992) as well as malingering simulators (Iverson & Franzen, 1994). The scores,
however, may be affected by brain impairment, especially dementia (Strauss, Sherman, &
Spreen, 2006).
The Word Memory Test (WMT; Green et al., 1996) is an SVT that was originally
designed to assess verbal memory but that is frequently used to assess effort output
because of its built-in indices of negative response bias (Iverson & Binder, 2000). The
WMT consists of 20 semantically related word pairs that the examinee is required to
recognize immediately after presentation while paired with foils (immediate recognition;
IR), after a 30-minute delay while paired with new foils (delayed recognition; DR), and
then from multiple choices (MC). Following these subtests, there is a paired-associates
trial (PA), a delayed free recall procedure (DFR), and a long delay free recall procedure
(LDFR), all of which are intended to evaluate verbal memory. Because
memory-impaired individuals tend to complete the IR and DR subtests relatively easily, these—in
conjunction with a consistency composite score (IR-DR consistency)—are used as
measures of effort output (Green et al., 1996). Overall, the WMT has been shown to be
very reliable in detecting malingering simulators (92.6% sensitivity and 100% specificity;
Tan et al., 2002) as well as in differentiating between groups of TBI patients involved in
litigation (Green, Iverson, & Allen, 1999). Recently, Flaro, Green, and Robertson (2007)
trying to gain custody of their children and mild TBI patients with average intelligence
seeking compensation. In fact, less than 2% of the former group performed below the
effort cut-offs for IR, DR or IR-DR consistency, whereas 40% of the latter group failed
the same cut-offs. Thus, the WMT shows merit as a measure of suboptimal effort output
in litigants.
However, there are several caveats involved in using SVTs or any other measure
specifically designed to assess suboptimal effort. First, they tend to be somewhat
repetitious and lengthy which may cause some individuals to ―become annoyed, stop
attending, and, in so doing, perform poorly‖ (Bordini et al., 2002, p. 97). Second,
although they are sensitive to obvious symptom magnification, they may not be sensitive
enough to detect subtle or intricate malingering strategies or variations of effort output
throughout the assessment (Franzen & Iverson, 1998). Moreover, because specialized
tests of malingering tend to focus on one type of symptom exaggeration (e.g., memory),
variable patterns of symptom exaggeration may go undetected (e.g., sensory loss, motor
impairment, reduced processing speed, etc.; Meyers & Volbrecht, 2003). Another
problem with some SVTs is that their cut-off scores are well-known in litigation, which
makes them susceptible to coaching by attorneys (Ben-Porath, 1994; Gunstad & Suhr,
2001). Lastly, because of their face validity, SVTs can easily be identified as effort tests
(Tan et al., 2002), especially if individuals are expecting the administration of such tests
(Suhr & Gunstad, 2000), which may prompt them to employ more subtle and believable
malingering strategies (Youngjohn, Lees-Haley, & Binder, 1999). As a result, over the
past 10 to 15 years, there has been a push to investigate alternate and covert ways of
performance from neuropsychological tests normally used in clinical practice; in
particular, the drive has been to formulate and validate indices embedded in clinical tests.
Floor effect analyses. Apart from SVTs, another method of assessing suboptimal
effort is known as the floor effect analysis. Along the lines of the second approach of
interpreting SVTs, the principal feature in floor effect analyses is to compare the
performance of a group of individuals with genuine head injuries to the performance of a
group of individuals with questionable injuries and suboptimal effort (i.e., known-groups
design; Millis & Volinsky, 2001). An important study exemplifying the floor effect
method using a known-groups design was performed by Backhaus, Fichtenberg, and
Hanks (2004), whereby the authors calculated the performance levels (i.e., 10th, 25th, and
50th percentiles) of a group of moderate-severe TBI outpatients on standard
neuropsychological tests and designed cut-offs based on these scores. Then, they
determined the classification accuracy of these floor cut-off scores by comparing the
performance of a mild TBI group to that of a group of litigants with poor effort as
classified by the RMT and the TOMM as well as by other Slick et al.’s (1999) criteria. In
general, Backhaus et al. (2004) found that standard neuropsychological tests do a good
job of distinguishing between patients with mild TBI and litigants putting forth
insufficient effort when using at least a 50th percentile floor level cut-off. In fact, the PPP
values for the tests used were all above 73.7% and NPP values ranged between 52.1%
and 88.5% depending on the floor level and the base rate. More specifically, using a
basal cut-off of 50th percentile, the results for some of the tests were: 48% sensitivity
(84% specificity) for the Finger Tapping Test using the dominant hand (FTT-d) and 56%
1985); 40% sensitivity (92% specificity) for the Trail Making Test part A (TMT-A) and
56% sensitivity (80% specificity) for part B (TMT-B; Reitan & Wolfson, 1985); 56%
sensitivity (100% specificity) for the written version of the Symbol Digit Modality Test
(SDMT-W) and 64% sensitivity (96% specificity) for the oral version (SDMT-O; Smith,
1973 as cited in Backhaus et al., 2004); 80% sensitivity (84% specificity) for the
Judgment of Line Orientation (JOLO; Benton, Hamsher, Varney, & Spreen, 1983); in
addition to 68% sensitivity (80% specificity) for the Token Test (TT) and 76% sensitivity
(84% specificity) for the Sentence Repetition (SR) subtests of the Multilingual Aphasia
Examination (Benton & Hamsher, 1989) (see Table 4 of Backhaus et al., 2004, for
complete data). Thus, it appears that using the 50th percentile cut-offs suggested by
Backhaus et al. (2004) have good sensitivity when used to discriminate individuals
putting forth suboptimal effort from those with mild TBI. However, given that the
specificity values were calculated using a mild TBI group, applying the aforementioned
cut-offs to a moderate-severe TBI group would likely result in lower specificity due to
increased impairment. Thus, a prudent practice might be to use cut-off values at the 10th
percentile when evaluating patients with moderate-severe TBI as a reference group in
order to maintain specificity at 90%. Using such a cut-off on Backhaus et al.’s (2004)
mild TBI sample would yield PPP values above 96% for all measures used. Thus, it
appears that standard neuropsychological tests hold considerable promise in determining
suboptimal effort output when well-validated cut-offs are used.
Embedded indices. Much like stand-alone SVTs, analyses using the floor effect
approach have also been shown to be susceptible to coaching, as informed simulators
(Wise et al., 2006). An alternative method to the floor effect analysis is to examine an
individual’s performance on empirically-validated indices that are generated from parts
of standard tests. This procedure has several advantages over using stand-alone SVTs.
First, by using an embedded index, the clinician does not need to administer any
additional tests, which subsequently makes the assessment battery more efficient by
minimizing the total administration time (Meyers & Volbrecht, 2003). Second, because
these indices are calculated from parts of standard tests, they are less obvious than SVTs,
which makes them less susceptible to coaching (Coleman et al., 1998; Suhr & Gunstad,
2000). Moreover, having multiple check points during testing allows for validity
assessment throughout the evaluation rather than solely at the beginning of the day,
which is when most SVTs tend to be administered (Slick et al., 2004). Likewise, having
multiple indices allows for assessment of negative response bias across several cognitive
domains (e.g., processing speed, attention, etc.) rather than simply assessing exaggeration
of memory deficits (Meyers & Volbrecht, 2003). Thus, because of the sheer number of
potential indices that can be incorporated in a standard battery, it is more difficult for the
dishonest responder to track their answers across tests, resulting in more inconsistencies
and a higher likelihood that the clinician will suspect suboptimal effort output or
exaggerated symptom reporting.
One of the earliest effort indices developed was derived from the Digit Span
subtest of the Wechsler Adult Intelligence Scale-Revised (WAIS-R; Wechsler, 1981). In
particular, Greiffenstein et al. (1994) devised the Reliable Digit Span (RDS), which
consisted of the sum of the last forward string repeated with both trials correct and the
reliably distinguished between a group of individuals giving incomplete effort and groups
with persistent post-concussive syndrome (68% sensitivity and 89% specificity) and
severe TBI (70% sensitivity and 73% specificity). However, the ―probable malingering‖
group used in this study was defined according to less stringent criteria than those
proposed by Slick et al. (1999). As a follow-up using better defined groups, Mathias et
al. (2002) found that the RDS adequately discriminated a group of individuals with
external incentive giving suboptimal effort from a group of patients with various degrees
of TBI without external incentive (i.e., 67% sensitivity and 93% specificity). In the same
vein, Heinly et al. (2005) demonstrated that, using the standard cut-offs, the RDS
detected 39% of individuals making up their MND group while correctly classifying 96%
of their non-MND group. Moreover, these investigators found that the PPP values for
RDS ranged between 52% and 91% when using base rates from 10 to 50% (Heinly et al.,
2005).
Another index derived from the WAIS-R is the Vocabulary-Digit Span difference
in scaled scores (V-DS; Mittenberg et al., 1995), which was formulated on the premise
that large discrepancies between these subtests are rare. Using a discriminant function,
they found that a V-DS discrepancy greater or equal to 2 detected 71% of malingering
simulators while correctly classifying 79% of non-litigating patients with mild to severe
head injuries. Millis, Ross, and Ricker (1998) confirmed the utility of V-DS to detect
malingering (i.e., 79% sensitivity and 90% specificity) by comparing the performance of
a sample of financially compensable mild TBI individuals giving incomplete effort
against the performance of a group with moderate-severe TBI. Finally, Schwarz, Gfeller,
was sensitive enough to detect coached simulators (85.7% sensitivity) but at the expense
of low specificity (i.e., 63.4%). However, this study was somewhat superficial as all
groups were composed of randomly assigned undergraduate students, suggesting that the
classification rates might have been different under more stringent and externally valid
parameters.
One of the few effort indices derived from tests of cognitive flexibility and
abstract reasoning is the Failure to Maintain Set (FMS) score from the Wisconsin Card
Sort Test (WCST; Heaton, Chelune, Talley, Kay, & Curtiss, 1993). Using a cut-off score
of greater than one, Suhr and Boyer (1999) found that the FMS correctly discriminated
between ―malingering‖ undergraduates and their ―normal‖ counterparts (i.e., 70.7%
sensitivity and 87.1% specificity) as well as between patients giving suboptimal effort
and patients with mild to moderate TBI (i.e., 82.4% sensitivity and 93.3% specificity).
Similar findings have been reported in other studies (Heinly, Greve, Love, & Bianchini,
2006; King, Sweet, Sherer, Curtiss, and Vanderploeg, 2002). In a study focussing solely
on specificity using regression formulae including FMS and number of categories
completed in the WCST, the values ranged between 98.7-100% in college students,
79.5% in substance abusers, 86.7-92.2% in mixed neurological samples, 88% in patients
following stroke, and 58.3% in severe TBI patients (Greve & Bianchini, 2002).
Self-report measures of psychopathology—such as the Minnesota Multiphasic
Personality Inventory, 2nd ed. (MMPI-II; Butcher, Dahlstrom, Graham, Tellegen, &
Kaemmer, 1989) and the Personality Assessment Inventory (PAI; Morey, 1991)—have
also been studied as possible predictors of dissimulation. In particular, Lees-Haley et al.
injury litigants and found that it correctly classified 96% of them, while correctly
identifying 90% of claimants with genuine injuries. This scale has proven valuable in
differentiating between litigants exaggerating symptoms and persons with various
degrees of TBI severity (i.e., 90% sensitivity and 90% specificity; Ross, Millis,
Krukowski, Putnam, & Adams, 2004; see also Meyers, Millis, & Volkert, 2002) as well
as between litigating and non-litigating patients with moderate-severe closed head
injuries (i.e., 80.8% sensitivity and 86.2% specificity; Larrabee, 2003b; Larrabee, 2003c).
In the same vein, the PAI Negative Impression Management scale (NIM) has been shown
to distinguish between defendants malingering in court-ordered pre-trial evaluations (for
competence and sanity) and honest responders (i.e., 91% sensitivity and 72% specificity;
Boccaccini, Murrie, & Duncan, 2006).
Recently, Smith and Burger (1997) developed the Structured Inventory of
Malingered Symptomatology (SIMS) to assess feigned or exaggerated psychiatric
symptoms (e.g., depression) or cognitive dysfunction (e.g., memory loss). This
specialized self-report SVT consists of five distinct scales encompassing commonly
feigned conditions —Psychosis (P), Affective Disorders (AF), Low Intelligence (LI),
Amnestic Disorders (AM), and Neurological Impairment (NI). Each scale consists of 15
non-overlapping items and has an independent cut-off to denote over-reporting of
symptoms within that domain. Using a Dutch translation of the SIMS, Merckelbach and
Smith (2001) demonstrated that it accurately distinguished undergraduate simulators
from normal controls and psychiatric inpatients with PPP scores falling above 90%. On a
separate analog study, Jelicic, Hessels, and Merckelbach (2005) used the SIMS to
exaggerate psychotic symptomatology (93% sensitivity), simulators provided with
information about psychotic symptoms (100% sensitivity), and simulators given
information about psychotic symptoms and warned not to exaggerate (80% sensitivity).
Although the overall hit rate was 94.6% and overall sensitivity was 91%, the authors used
an unrealistic base rate of 75%, making the results difficult to generalize. Finally, Lewis,
Simcox, and Berry (2002) used a known-groups design to assess the ability of the SIMS
and MMPI-2 to differentiate between two groups of individuals participating in pre-trial
psychological evaluations. These investigators found that both the SIMS and MMPI-2
validity scales yielded very high NPPs when the predetermined cut-offs were used (i.e.,
100% and 92% respectively). Thus, although further research with this measure using
known-groups designs is warranted, the SIMS appears effective for screening feigned
reporting in forensic samples.
Lastly, Meyers and Volbrecht (2003) used patterns of performance from standard
neuropsychological tests to distinguish between a group instructed to simulate
neuropsychological impairment (i.e., analog design; Millis & Volinsky, 2001) and a
group of individuals with varying degrees of TBI severity. In particular, Meyers and
Volbrecht (2003) found that performance of any two measures below empirically derived
cut-offs—including TT, SR, and JOLO—was suggestive of suboptimal effort output
especially in the context of litigation. By means of similar methodology, Larrabee
(2003a) used pair-wise combinations of test failures to discriminate between a group of
patients with moderate-severe closed head injury and a group of definite MND
individuals with potential for secondary gain. The indices and measures used included
classification accuracy of 91.6% (87.7% sensitivity and 94.4% specificity). In a
follow-up study using likelihood ratios, Larrabee (2008) demonstrated that failing two or three
SVTs resulted in very good PPPs (ranging from 73.5% to 99.9%) depending on the base
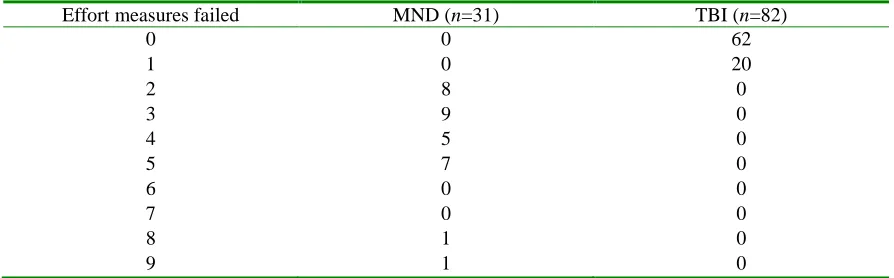
rate used (i.e., 10 to 90%). In general, consistent with Meyers and Volbrecht (2003),
Larrabee (2003a, 2008) found that using multiple indicators to determine suboptimal
effort resulted in much higher classification rates than using a single measure. Thus,
defining suboptimal effort as two or more failed effort measures appears to distinguish
effectively between individuals feigning or exaggerating symptoms and individuals with
genuine moderate-severe TBI.
Taken as a whole, indices embedded in standard neuropsychological measures
appear to be worthwhile in detecting effort output, especially in litigants. These
measures are not as sensitive as stand-alone effort tests but because the former do not
require additional administration time, they are more efficient and allow the clinician to
make preliminary diagnostic decisions quickly in order to maximize the utility of the
assessment. In addition, these embedded indices have low face validity with respect to
effort detection because they are derived from actual clinical tests measuring cognitive
performance, which subsequently makes them less susceptible to coaching practices.
Lastly, using embedded indices throughout the examination and across modalities makes
it more difficult for a dishonest responder to keep track of their exaggerated response
style, thereby increasing the likelihood that their negative response bias will be detected.
Of all tests used to derive embedded effort indices, the CVLT and CVLT-II (discussed in
the next section) appear to hold the most promise because of their adequate difficulty
multiple variables and testing points to assess not only different aspects of learning and
memory but also effort output.
CVLT and CVLT-2 research. The CVLT (Delis, Kramer, Kaplan, & Ober, 1987)
and its successor, the CVLT-II (Delis et al., 2000), are popular clinical tests of verbal
learning, encoding, and retrieval. Although both editions share the majority of test
components (i.e., 5 learning trials, a distractor list, immediate and delayed free and cued
recall trials, and a delayed yes/no recognition trial), the CVLT-II has new word lists that
are easier to comprehend, a better conceptualized yes/no recognition trial, additional
validity measures, and a larger normative sample (Delis et al., 2000; Strauss et al., 2006).
A full discussion of the CVLT components and procedures falls outside the scope of this
paper; consequently, only the CVLT-II will be described in detail. Nonetheless, a review
of research on malingering involving both the CVLT and the CVLT-II will follow.
The CVLT-II consists of a list of 16 words—comprised of 4 words for each of 4
semantic categories (i.e., animals, furniture, modes of transportation, and vegetables)—
that are initially read 5 times while the individual recalls as many words as they can
immediately following each presentation (i.e., list A ; trials 1-5). Then, the individual is
provided with a distractor list of 16 different words (i.e., list B), which they are supposed
to recall immediately after their presentation. After this task, they must recall as many
words as they can from list A without and with semantic cueing (i.e., Short-Delay Free
Recall and Short-Delay Cued Recall, respectively). After a 20-minute delay filled with
tasks assessing other domains (i.e., not memory or verbal material), the participant is
asked to recall as many words as they can from list A without and with semantic cueing
delayed cued recall trial, they are presented with a yes/no recognition task composed of
the 16 target items from list A as well as 32 additional foils made up of four different
categories—UN, BN, PR, and BS. The UN variable consists of novel false positive foils
that are semantically unrelated to the previously presented list A items. The BN group of
foils consists of words that were presented as part of the distractor list (i.e., list B) but that
are not semantically related to any of the list A items. The PR foils are novel but
semantically or ―prototypically‖ related to the target items. Lastly, the BS group consists
of foils that were presented as part of the distractor list and that are semantically related
to target items. Finally, an optional forced-choice recognition task may be administered
to the individual after a 10-minute delay in order to screen for effort output (Delis et al.,
2000; Donders & Moore, 2004; Root et al., 2006).
Although not typically generated from the CVLT-II, the yes/no recognition foils
lend themselves to be pooled into two separate composite scores based on their
categorical properties. The first composite is made up of items semantically unrelated to
the target items (i.e., pooled from the UN and BN categories) and can be considered
―easy to reject‖ (ETR) because its foils are not part of any of the target categories (i.e.,
animals, furniture, modes of transportation, and vegetables), which makes them more
easily discernable from target items. Contrastingly, the second composite consists of
items that are semantically related to the target items (i.e., pooled BS and PR items) and
are consequently hypothesized to pose more difficulty to inhibit for the participant (i.e.,
―difficult to reject‖; DTR).
Overall, the output generated from a CVLT or CVLT-II protocol yields over 30
suboptimal effort (Millis et al., 2007). Several researchers (Ashendorf et al., 2003;
Coleman et al., 1998; Curtis et al., 2006; Demakis, 1999; Millis et al., 1995; Millis et al.,
2007; Moore & Donders, 2004; Root et al., 2006; Sweet et al., 2000) have conducted
many different studies examining the utility of variables from the CVLT and CVLT-II in
detecting insufficient effort. The CVLT and CVLT-II variables that have been studied
most extensively include: total number of words learned across five trials (Total 1-5),
Short-Delay Free Recall (SDFR), Short-Delay Cued Recall (SDCR), Long-Delay Free
Recall (LDFR), Long-Delay Cued Recall (LDCR), Recognition Hits (Hits), Recognition
Discriminability (d’), Forced-Choice Recognition total (FCR; CVLT-II only), and
Critical Item Analysis (CIA; CVLT-II only). Of these variables, those derived from the
yes/no recognition trial have shown the most consistency in detecting suboptimal effort.
More specifically, Millis et al. (1995) performed both linear and quadratic discriminant
functions using Total 1-5, Hits, d’, and LDCR from the CVLT and found that either
discriminant function yielded good accuracy in differentiating a moderate-severe TBI
group from a mild TBI group with insufficient effort (i.e., 83-96% sensitivity and 91-96%
specificity). Then, they conducted univariate frequency distributions to determine
adequate cut-offs for each variable (set at a maximum of 10% false positive rate) and
found that d’ and Hits yielded very good accuracy rates that were comparable to the more
complex discriminant function, whereas the Total 1-5 and LDCR variables yielded lower,
but still suitable, rates. These authors also examined the pattern of hits and false-positive
errors in the yes/no recognition trial to determine whether the d’ variable was sensitive to
more than one type of malingering strategy—denial response style (low hits, low false
hits, high false positives). Of the participants in the group putting forth insufficient
effort, 12, 10, and 1 participant used the above strategies, respectively. Thus, the Millis
et al. (1995) study gave some preliminary evidence for the presence of different
malingering strategies used in the yes/no recognition trial. Sweet et al. (2000) expanded
on Millis et al.’s (1995) study by adding malingering simulators and normal controls to
the TBI group and the group of clinical malingerers. With respect to the classification
accuracy that resulted from the study by Sweet et al. (2000), the specificity values were
comparable to the Millis study (i.e., Total 1-5: 76-100%; LDCR: 74-95%; Hits: 83-100%;
d’: 81-100%) but the sensitivity values were slightly lower (i.e., Total 1-5: 52-80%;
LDCR: 48-62%; Hits: 48-88%; d’: 57-68%), depending on the group and cut-offs used.
The classification rates found in the Sweet study were comparable to those found by
Ashendorf et al. (2003) as well as Curtis et al. (2006) when these authors assessed the
classification accuracies of the aforementioned variables as well as several regression
models and the Millis discriminant function.
With respect to the CVLT-II, Bauer, Yantz, Ryan, Warden, and McCaffrey (2005)
constructed a discriminant function using Total 1-5, d’ scaled score, Hits, LDCR, and
FCR in an attempt to differentiate between two groups of patients with mild-moderate
TBI—one putting forth adequate effort and one giving insufficient effort. Although the
authors found specificity scores similar to those found using the CVLT (i.e., 95.6%),
sensitivity was much lower than in previous research (i.e., 13.8%). To address the need
for new CVLT-II validity indicators, Millis et al. (2007) used Bayesian model averaging
(BMA), a multivariate logistic regression model, to investigate which of 18 CVLT-II