1 King’s College London, School of Medicine, Department of Palliative Care, Policy and Rehabilitation, Cicely Saunders Institute, London, UK
2 Huazhong University of Science & Technology, Tongji Medical College, Department of Epidemiology and Health Statistics, Wuhan, China
3 General Hospital of Pingdingshan Coal Mining District, Department of Internal Medicine, Pingdingshan, China [email protected]
Using neural network as a screening and educational
tool for abnormal glucose tolerance in the community
by
Gao W1,2, Dong F3, Nie S1, Shi L1
Abstract
Background
Accurate, simple and non-invasive tools are needed for efficient screening of abnormal glu-cose tolerance (AGT) and educating the general public.
Aim
To develop a neural network-based initial screening and educational model for AGT. Data and methods
230 subjects with AGT and 3,243 subjects with normal glucose tolerance (NGT) were allo-cated into training, validation and test sets using stratified randomization. The ratios of AGT versus NGT in three groups were 150:50, 30:570 and 50:950, respectively. A feed-forward neural network (FFNN) was trained to predict 2-hour plasma glucose of 75g Oral Glucose Tolerance Test (OGTT) using age, family history of diabetes, weight, height, waist and hip circumference. The screening performance was evaluated by the area under the receiver operating characteristic (ROC) curve (AUC) and the partial AUC (in the range of false posi-tive rates between 35 and 65%) and compared to those from logistic regression, linear regression and ADA Risk Test.
Results
Sensitivity, specificity, accuracy and percentage that needed further testing at 7.2mmol/L in test group were 90.0 %( 95%CI: 78.6 to 95.7%), 47.7% (95%CI: 44.5 to 50.9%), 49.8% (95%CI: 46.7 to 52.9%) and 54.2% (95%CI: 51.1 to 57.3%) respectively. The entire and par-tial AUCs were 0.70 (95%CI: 0.62 to 0.78) and 0.26 (95%CI: 0.22 to 0.30). The parpar-tial AUC of the NN was higher than those of logistic regression (p=0.06), linear regression (p=0.06) and ADA Risk Test (P=0.006).
Conclusion
Keywords
Screening, diabetes mellitus, Abnormal Glucose Tolerance, risk factors, neural networks
Introduction
Identification of unrecognized abnormal glucose tolerance (AGT), including undiagnosed diabetes (UDM) and impaired glucose tolerance (IGT), is important in reducing the risk of diabetes complications. It is also important to prevent or postpone the occurrence of diabetes (1-3). The Oral Glucose Tolerance Test (OGTT) is the standard diagnostic test for AGT but it is invasive, labour-intensive and impractical as a standalone screening test (4). Targeted screening has been recommended as a cost-effective alternative to the universal screening (5-8). Under this strategy, an initial test is needed to decide who should take OGTT. For an initial test to be of value, the sensitivity should be high enough to ensure as many asympto-matic patients recommended for OGTT as possible. Meanwhile, its specificity should be at a reasonable level to avoid unnecessary OGTT in low-risk groups. An ideal initial test should also be simple, non-invasive and objective which means less vulnerable to various biases when applied in large-scale populations (1;3-6;8;9).
It appears that only a small set of risk factors would satisfy aforementioned requirements. Therefore, the model for developing an initial test using only these factors should have a strong ability to recognize the subtle differences between individual risk profiles. Neural net-works (NNs) are models that are patterned after the structure of the human brain (10). They contain a series of mathematical equations that are used to simulate biological processes such as learning and memory. NNs have the ability to automatically ‘learn’ mathematical re-lationships between input and output variables, and could model virtually almost all the complex and non-linear relationships. They have been successfully applied to a variety of medical problems that require pattern recognition and complex classification (ie. disease screening, disease prediction, assessing the prognosis) (11-15).
Our objective is to develop a sensitive, simple and non-invasive model which can be used as the initial test for targeted screening of AGT and for educating the general public. The NN will be used to predict the 2-hour plasma glucose (2hPG) after 75g OGTT, based on six risk fac-tors.
Research design and methods
Subjects selection and exclusion criteria
Prior to the survey, signed informed consents were obtained from all participants. Partici-pants were asked to complete a standard questionnaire and were invited for health check-up. Data on family history of diabetes, age, weight, height, hip and waist circumference were col-lected; each subject also underwent a standard OGTT recommended by the World Health Organization (WHO). A cutoff point of 7.8mmol/L (140mg/dl) was used to diagnose abnormal or normal glucose tolerance (NGT). In total, 3380 subjects were recruited for the survey. In-dividuals with previously diagnosed diabetes (n=84) and with missing data on 2hPG (n=23) were excluded. The final data consisted of 3,273 subjects, among whom 230 had abnormal 2hPG.
Neural Network model design and development
We chose feed-forward neural network (FFNN) to develop the prediction model because of its flexibility and straightforward design, and its successful applications in medical problems (10;12-15). Its structure and detailed theories have been well-documented elsewhere (10;16). Briefly, artificial neurons, the basic units of the network, are organized into input, hidden and output layers. The input layer is responsible for passing information from predic-tors to the hidden layer. The number of neurons in the input layer corresponds to the number of predictors. The hidden layer is the core of the entire network, the network’s ability of data modelling is closely related to the design of this layer. The output layer produces the pre-dicted outputs. Layers are interconnected by weights, which will be adjusted during the training process. Before the training process starts, initial random values are assigned to the weights connecting input neurons to hidden neurons. Then input-output patterns will be pre-sented to the network iteratively. The predicted output will be compared with the target output at each presentation. The error information then will be ‘back propagated’ to the network and the weights are adjusted according to predefined learning rules. Training will continue until the difference between predicted and target outputs arrive at a desired level (10;16). NNs tend to overfit the data, which means that if a network has been trained too long, it will gradually lose the ability to generalize (10;16). So to develop an appropriate NN model, we need: 1) a training group to train the network; 2) a validation group to monitor the training process to prevent overtraining and select optimal networks, and 3) a test group which has never ‘been seen’ by the network in the training process to evaluate the performance.
For meeting the practical needs in mass screening, we selected the input variables according to the following criteria: closely related to AGT, easy to obtain, and could be measured objec-tively. Through literature review, six variables were selected as the predictors for 2hPG (17-22).
with one hidden layer (23). Another report stated that the approximations of continuous func-tions may require the network with two hidden layers for full generality (24). Therefore, we used a two-hidden-layer network with smaller numbers of neurons in each layer. The number of neurons in hidden layers was determined by experiments comparing network perform-ances with different number of neurons in two hidden layers. During the experiment, networks were tested with two to ten neurons in the hidden layers, and for every structure several trainings with the same training set were performed so that the performances of every structure could be estimated as objectively as possible (23). The final structure of the FFNN from input to output layers, in turn, was 6-8-10-1. We used hyperbolic tangent sigmoid transfer function in all layers.
Normal and abnormal subjects were allocated into training, validation and test groups using stratified randomization, the size and the partition for abnormal and normal individuals in three groups were 150:50, 30:570 and 50:950. The proportion of abnormal to normal cases in the training group was determined by trial and error; for the remaining subjects, validation and test groups were formed according to estimated prevalence rate (5%) of AGT in central China (25). The procedure to form the training group was: firstly, we randomly selected 150 abnormal cases, then used the validation group as the hypothetical target population and tested numerous different ratios of abnormal to normal in the training group on a set of one-hidden-layer FFNN. We found it was relatively easier to train the network to achieve better performance if the ratio of abnormal to normal cases was 3:1.
All numeric variables were normalized to [-1, 1] scale before being fed into the neural net-work. The error function was the mean squared error (MSE). Weights were adjusted according to the Levenberg-Marquardt optimization (26). Training was stopped when the MSE in the validation group began to rise (10;16;27). Predicted normalized 2hPG were then back-transformed to the original unit to classify as normal or abnormal 2hPG with 7.8mmol/L as the cutoff value. Training was repeated 100 times with different initializations, and the network with the best performance on the validation group saved for later use.
The ANN model development and construction were done by neural network toolbox in Mat-lab 6.5 (The MathWorks Inc., USA).
Neural network model performance analysis
discrimi-native test is considered perfect if AUC=1.0, good if AUC=0.8 to 1.0, moderate if AUC=0.6 to 0.8, poor if AUC=0.5 to 0.6, an area of 0.5 reflects a random rating model (28). The entire AUC provides a useful measure of test accuracy. However, the partial AUC is a more mean-ingful index in mass initial screening settings. Because we would never need to use points with too low (when you will miss most of abnormal individuals) or too high a level of false positive rates (when almost all participants will be recommended for further tests), we esti-mated the partial AUCs in the range of false positive rates between 35% and 65% (29). Confidence intervals of entire and partial AUC were calculated using the method proposed by Zhang et al. (30).
To suit the needs of practice, we visually chose two other cutoff points from the ROC curve of validation group using the following strategies: the sensitivity higher than 90% and the false positive rate as low as possible; the false positive rate smaller than 50% and the sensi-tivity as high as possible. The sensisensi-tivity (ratio of true positive diagnoses to true positive plus false negative), specificity (ratio of true negative to true negative plus false positive), accu-racy (ratio of the number of correct diagnoses to the total number of subjects), and percentage that needed further tests (ratio of true positive plus false positive to the total number of subjects) were calculated for the training, validation and test groups at three cutoff points.
For comparisons, the relationship between glucose tolerance and six predictors was mod-elled using linear regression and logistic regression. The dependent variable was the continuous 2hPG for linear regression and the binary status of glucose tolerance for logistic regression. Both models were constructed by combining training and validation groups. In addition, the risk score was calculated for each subject in the test group using ADA Risk Test (31); because the information on childbearing was not available in our data, we assigned 1 point to all women. We used 25kg/m2 as the cutoff point for the BMI (32). The overall
per-formances of four tests were examined and compared with the entire AUCs and partial AUCs in the range of false positive rates between 35% and 65%.
The analyses were conducted using SAS 8.2 (SAS Institute, Inc., Cary, NC).
Results
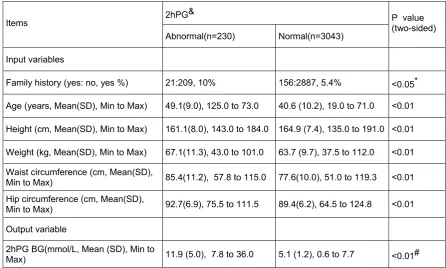
Table 1 Descriptive statistics of the input and output variables used in neural network-based initial screening model
2hPG& Items
Abnormal(n=230) Normal(n=3043)
P value (two-sided)
Input variables
Family history (yes: no, yes %) 21:209, 10% 156:2887, 5.4% <0.05* Age (years, Mean(SD), Min to Max) 49.1(9.0), 125.0 to 73.0 40.6 (10.2), 19.0 to 71.0 <0.01 Height (cm, Mean(SD), Min to Max) 161.1(8.0), 143.0 to 184.0 164.9 (7.4), 135.0 to 191.0 <0.01 Weight (kg, Mean(SD), Min to Max) 67.1(11.3), 43.0 to 101.0 63.7 (9.7), 37.5 to 112.0 <0.01 Waist circumference (cm, Mean(SD),
Min to Max) 85.4(11.2), 57.8 to 115.0 77.6(10.0), 51.0 to 119.3 <0.01 Hip circumference (cm, Mean(SD),
Min to Max) 92.7(6.9), 75.5 to 111.5 89.4(6.2), 64.5 to 124.8 <0.01 Output variable
2hPG BG(mmol/L, Mean (SD), Min to
Max) 11.9 (5.0), 7.8 to 36.0 5.1 (1.2), 0.6 to 7.7 <0.01# & 2-hour plasma glucose after 75-g oral glucose tolerance test, referring to the standard of WHO 1998 to diag-nose normal and abnormal glucose tolerance
* Chi-square test # Wilcoxon rank sum test
all other variables were near-normal distribution and compared by using two-sample t-test.
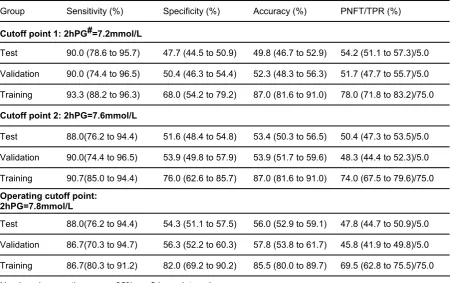
Table 2. Performance of neural network-based model for initial screening abnormal glucose tolerance Group Sensitivity (%) Specificity (%) Accuracy (%) PNFT/TPR (%)
Cutoff point 1: 2hPG#=7.2mmol/L
Test 90.0 (78.6 to 95.7) 47.7 (44.5 to 50.9) 49.8 (46.7 to 52.9) 54.2 (51.1 to 57.3)/5.0 Validation 90.0 (74.4 to 96.5) 50.4 (46.3 to 54.4) 52.3 (48.3 to 56.3) 51.7 (47.7 to 55.7)/5.0 Training 93.3 (88.2 to 96.3) 68.0 (54.2 to 79.2) 87.0 (81.6 to 91.0) 78.0 (71.8 to 83.2)/75.0
Cutoff point 2: 2hPG=7.6mmol/L
Test 88.0(76.2 to 94.4) 51.6 (48.4 to 54.8) 53.4 (50.3 to 56.5) 50.4 (47.3 to 53.5)/5.0 Validation 90.0(74.4 to 96.5) 53.9 (49.8 to 57.9) 53.9 (51.7 to 59.6) 48.3 (44.4 to 52.3)/5.0 Training 90.7(85.0 to 94.4) 76.0 (62.6 to 85.7) 87.0 (81.6 to 91.0) 74.0 (67.5 to 79.6)/75.0
Operating cutoff point: 2hPG=7.8mmol/L
Test 88.0(76.2 to 94.4) 54.3 (51.1 to 57.5) 56.0 (52.9 to 59.1) 47.8 (44.7 to 50.9)/5.0 Validation 86.7(70.3 to 94.7) 56.3 (52.2 to 60.3) 57.8 (53.8 to 61.7) 45.8 (41.9 to 49.8)/5.0 Training 86.7(80.3 to 91.2) 82.0 (69.2 to 90.2) 85.5 (80.0 to 89.7) 69.5 (62.8 to 75.5)/75.0 Numbers in parentheses are 95% confidence intervals
*: PNFT: Percentage that needed further test (including true positive and false positive) TPR: true positive rate in the studied group
#: 2hPG: 2-hour plasma glucose after oral glucose tolerance test
0 10 20 30 40 50 60 70 80 90 100 0
10 20 30 40 50 60 70 80 90 100
False positive rate (%)
Se
n
sit
iv
ity
(
%
)
NN(AUC:0.70(0.63-0.77); pAUC: 0.26(0.22-0.30))
LogR(AUC:0.74(0.67-0.81);pAUC:0.19(0.15-0.23))
LR(AUC:0.73(0.65-0.80); pAUC:0.19(0.15-0.23))
RT(AUC:0.65(0.57-0.72); pAUC:0.15(0.11-0.19))
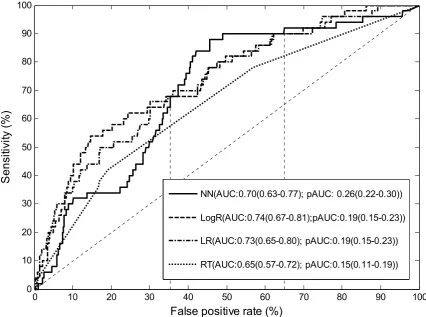
Figure 1. Comparisons of Receiver Operating Characteristic (ROC) curves of the neural network (NN), logistic regression (LogR), linear regression (LR) and ADA Risk Test (RT) in test group.
The diagonal line is the reference line.
AUC: area under the ROC curve. pAUC: partial AUC in the range of false positive rates between 35% and 65%. Point estimates and 95% confidence intervals for the AUCs and pAUCs are given in brackets.
Discussion
Very few risk factor-based models have been evaluated for screening both IGT and UDM. The sensitivity of screening IGT is generally lower than that of UDM. Based on the existing evidence, the sensitivity of 90% is the highest that has ever been reached by a risk factor-based model (8;34). The sensitivity (90%) of this NN model was even higher than some bio-chemical tests (35). The performance of a screening test was closely related to the prevalence of AGT in the targeted population: the higher the prevalence the higher the sensi-tivity. Our model was developed and tested in a population with a relatively low prevalence of AGT (19;25), so this model should work even better in populations with higher level of AGT prevalence.
Besides the high sensitivity, another advantage of this NN-based model is that all the predic-tors except for the family history of diabetes can be obtained objectively. Unlike the other risk factors-based models, this model used variables with objective properties (age, weight, height, waist circumference and hip circumference). Five out of six selected variables can be obtained objectively. As to the only predictor (the family history of the diabetes) that may rely on the memories of respondents, a previous study found this information provided by partici-pants was ‘rather accurate’ (36). So this model is less likely to incur information biases when applied to a larger population.
We selected input variables purely based on prior knowledge instead of their statistical char-acteristics within the study population (37). The reasons are: firstly, we were attempting to develop a model that was suitable for mass screening, the input variables should be closely related to AGT, easy to acquire and at low cost. However, not all the known factors linked to AGT have these features. Secondly, at present there is no well-established methodology for the NN choosing the appropriate subset from the candidate predictors (16;27). Eventually the six most frequently reported risk factors were included to predict the 2hPG. The links be-tween these variables and AGT can be found among almost all kinds of genetic backgrounds (3;5;6;8;17-21;25;34), suggesting this model may also work well in the other populations. The choice of these variables makes it possible to use routine health data to screen AGT. It could even simply use self-reported information to make predictions, which may be ideally applied to the settings with limited resources.
wrong information, which are fairly common in large epidemiological surveys. Although the data quality in this study was high, there still were some variables with incomplete or unrea-sonable readings. To develop a screening model suit for epidemiological data, we did not clean raw data but directly fed the network with ‘uncleaned’ ones. The prediction perform-ance was still as good if not better.
NNs are capable of establishing the relationship between inputs and output through learning from training samples, users need not tell the network what the relationship is. Furthermore, the NN makes no assumption about the distributions of predictors and also does not require predictors to be independent. Thus a major concern of multicollinearity in conventional mod-els would no longer be a problem. Therefore, we introduced predictors, such as weight and height which are normally correlated, into the model directly (10-12;16;27).
There are several issues which need to be addressed in future studies before this new meth-odology can be widely used in practice. How is this model’s generalizability? Will a similar model development strategy suffice or what modifications should be made to meet the needs in diverse settings? Will the risk factor selection strategy work similarly well in other ethnic backgrounds?
In conclusion, we demonstrated neural networks can be used as a high-sensitive and non-invasive initial test for targeted screening of AGT; it can avoid almost 50% unnecessary OGTTs by just missing 10% abnormal individuals comparing to universal screening strategy.
Acknowledgments
We thank staff members at the General Hospital of PingDingShan Coal Mining District for their assistance in blood withdrawal, glucose tolerance testing, health check-up and data col-lection. We thank participants for their cooperation. We also thank Professor Chia Kee Seng and anonymous reviewers for their constructive comments on the earlier versions of this paper.
References
1. Aroda VR, Ratner R. Approach to the patient with prediabetes. J Clin Endocrinol Metab 2008; 93(9):3259-65
2. Millett C, Car J, Eldred D, Khunti K, Mainous AG, III, Majeed A. Diabetes prevalence, process of care and outcomes in relation to practice size, caseload and deprivation: national cross-sectional study in primary care. J R Soc Med 2007; 100(6):275-83
3. Waugh N, Scotland G, McNamee P, Gillett M, Brennan A, Goyder E et al. Screening for type 2 diabetes: literature review and economic modelling. Health Technol Assess 2007; 11(17):iii-xi, 1
4. Saudek CD, Herman WH, Sacks DB, Bergenstal RM, Edelman D, Davidson MB. A new look at screen-ing and diagnosscreen-ing diabetes mellitus. J Clin Endocrinol Metab 2008; 93(7):2447-53
5. Hoerger TJ, Harris R, Hicks KA, Donahue K, Sorensen S, Engelgau M. Screening for type 2 diabetes mellitus: a cost-effectiveness analysis. Ann Intern Med 2004; 140(9):689-99
7. Griffin SJ, Little PS, Hales CN, Kinmonth AL, Wareham NJ. Diabetes risk score: towards earlier detec-tion of type 2 diabetes in general practice. Diabetes Metab Res Rev 2000; 16(3):164-71.
8. Simoens S, Foulon E, Dethier M, Mathieu C, Laekeman G. Promoting targeted screening for Type 2 dia-betes mellitus: the contribution of community pharmacists. Diabet Med 2005; 22(6):812-3
9. Schneider H, Shaw J, Zimmet P. Guidelines for the detection of diabetes mellitus - diagnostic criteria and rationale for screening. Clin Biochem Rev 2003; 24(3):77-80
10. Krogh A. What are artificial neural networks? Nat Biotechnol 2008; 26(2):195-7
11. Ji W, Naguib RN, Ghoneim MA. Neural network-based assessment of prognostic markers and outcome prediction in bilharziasis-associated bladder cancer. IEEE Trans Inf Technol Biomed 2003; 7(3):218-24 12. Linder R, Albers AE, Hess M, Poppl SJ, Schonweiler R. Artificial neural network-based classification to
screen for dysphonia using psychoacoustic scaling of acoustic voice features. J Voice 2008; 22(2):155-63
13. Modai I, Kurs R, Ritsner M, Oklander S, Silver H, Segal A et al. Neural network identification of high-risk suicide patients. Med Inform Internet Med 2002; 27(1):39-47
14. Mofidi R, Duff MD, Madhavan KK, Garden OJ, Parks RW. Identification of severe acute pancreatitis us-ing an artificial neural network. Surgery 2007; 141(1):59-66
15. Nieminen P, Hakama M, Viikki M, Tarkkanen J, Anttila A. Prospective and randomised public-health trial on neural network-assisted screening for cervical cancer in Finland: results of the first year. Int J Cancer 2003; 103(3):422-6
16. Duh MS, Walker AM, Ayanian JZ. Epidemiologic interpretation of artificial neural networks. Am J Epide-miol 1998; 147(12):1112-22
17. Colagiuri S, Hussain Z, Zimmet P, Cameron A, Shaw J. Screening for type 2 diabetes and impaired glu-cose metabolism: the Australian experience. Diabetes Care 2004; 27(2):367-71
18. Lindahl B, Weinehall L, Asplund K, Hallmans G. Screening for impaired glucose tolerance. Results from a population-based study in 21,057 individuals. Diabetes Care 1999; 22(12):1988-92
19. Qiao Q, Hu G, Tuomilehto J, Nakagami T, Balkau B, Borch-Johnsen K et al. Age- and sex-specific prevalence of diabetes and impaired glucose regulation in 11 Asian cohorts. Diabetes Care 2003; 26(6):1770-80
20. Schmidt MI, Duncan BB, Vigo A, Pankow J, Ballantyne CM, Couper D et al. Detection of undiagnosed diabetes and other hyperglycemia states: the Atherosclerosis Risk in Communities Study. Diabetes Care 2003; 26(5):1338-43
21. The DECODE Study Group. Age- and sex-specific prevalences of diabetes and impaired glucose regula-tion in 13 European cohorts. Diabetes Care 2003; 26(1):61-9
22. Wang KA, Li TL, Bai J, Feng JG, Fu ZY. [Study on the epidemiological characteristics of diabetes melli-tus and IGT in China]. Zhonghua Liu Xing. Bing Xue Za Zhi 1998; 19, 282-5
23. Chester DL. Why two hidden layers are better than one. 1990. 265-8
24. Sontag ED. Feedback stabilization using two-hidden layer nets. IEEE Trans Neural Netw 1992; 3:981-90 25. Xiang HD, Wu W, Liu CQ, Li K, Feng JG, Zhang YT. [An epidemiological study on DM 1995-1996, in
China]. Zhongguo Tang Niao Bing Za Zhi 1998; 6:131-3
26. Hagan MT, Menhaj MB. Training feedforward networks with the Marquardt algorithm. IEEE Trans Neural Netw 1994; 5(6):989-93
27. Tu JV. Advantages and disadvantages of using artificial neural networks versus logistic regression for predicting medical outcomes. J Clin Epidemiol 1996; 49(11):1225-31
28. Metz CE. ROC methodology in radiologic imaging. Invest Radiol 1986; 21(9):720-33 29. Walter SD. The partial area under the summary ROC curve. Stat Med 2005; 24(13):2025-40
31. Risk Test - Text Version. http://www diabetes org/risk-test/text-version jsp [ 2008 [cited 2008 Nov. 12]; Overweight & Obesity (BMI). http://apps who int/bmi/index jsp?introPage=intro_3 html [ 2008 [cited 2008 Nov. 12]
32. Herdzik E, Safranow K, Ciechanowski K. Diagnostic value of fasting capillary glucose, fructosamine and glycosylated haemoglobin in detecting diabetes and other glucose tolerance abnormalities compared to oral glucose tolerance test. Acta Diabetol 2002; 39(1):15-22
33. Glumer C, Jorgensen T, Borch-Johnsen K. Targeted screening for undiagnosed diabetes reduces the number of diagnostic tests. Inter99(8). Diabet Med 2004; 21(8):874-80
34. Mannucci E, Ognibene A, Sposato I, Brogi M, Gallori G, Bardini G et al. Fasting plasma glucose and gly-cated haemoglobin in the screening of diabetes and impaired glucose tolerance. Acta Diabetol 2003; 40(4):181-6
35. Kahn LB, Marshall JA, Baxter J, Shetterly SM, Hamman RF. Accuracy of reported family history of dia-betes mellitus. Results from San Luis Valley Diadia-betes Study. Diadia-betes Care 1990; 13(7):796-8