ISSN 0975-928X DOI: 10.5958/0975-928X.2017.00044.8
Research Note
Cluster analysis for fruit yield components in grapes
Navjot Gupta*, MIS Gill and N.K. Arora
Punjab Agricultural University, Regional Research Station, Bathinda- 151 001 E-mail: [email protected]
(Received: 09 March 2016; Revised: 10 Feb 2017; Accepted: 22 Feb 2017)
Abstract
For any plant improvement programme, different genotypes are to be classified into clusters based on genetic diversity. Further the extent of genetic divergence between them needs to be estimated. D2 statistics is one of the powerful tools to assess the relative contribution of different component traits to the total diversity, to quantify the degree of divergence and to choose genetically diverse parents for obtaining desirable recombinants. The present study was conducted at Punjab Agricultural University, Regional Research Station, Bathinda from 2011-13 on 20 genotypes of grapes for genetic divergence with respect to nine yield contributing traits viz., bunch length, bunch breadth, bunch weight, berry length, berry breadth, berry weight, TSS (%), acidity (%) and fruit yield per vine. The analysis of variance exhibited significant differences among genotypes for all the nine characters studied. Twenty genotypes were grouped into five clusters. The cluster size varied from single genotype (cluster V) to seven genotypes (cluster I). Cluster II, III, IV had 4, 5 and 3 genotypes respectively. No relationship between geographic and genetic diversity was revealed as genotypes from same geographic area fell in different clusters and vice versa. The intercluster distances were more than intracluster distances. The highest intercluster distance was observed between cluster I and cluster IV followed by clusters I and V. The other intercluster distances were of low magnitude. Hence crossing between genotypes of cluster I with those from cluster IV and V will be rewarding. Based on intercluster distances and cluster mean for different characters, parents were identified which upon crossing may yield desirable recombinants.
Key words
Grapes, fruit yield components, D2 analysis
Genetic variability in a base population is a prerequisite for effective selection and recombination breeding. When existing variability has been exploited, a breeder resorts to creation of variability through hybridization as a population with more diverse genotypes is of considerable value for the success of any breeding programme. The relatedness and genetic distance between accessions can be obtained through cluster analysis. Cluster analysis is grouping accessions which have the same characteristics in homogeneous categories of each stratum (Crossa et al., 1995). Commercial grape cultivation in India is one of the most remunerative, which is mainly confined to table grapes. More than 80 per cent are cultivated under the tropical conditions of the Southern peninsular region, while viticulture in North India is under subtropical conditions. Due to the diversity of climate, different cultivars are planted in different regions (Chadha and Shikhamany, 1999).
Information on the nature and degree of divergence among the genotypes helps the breeders in choosing right type of parents for initiating a breeding programme to recover better varieties or hybrids, since the degree of heterosis is believed to be correlated with genetic divergence among the parents. Earlier geographic diversity was considered to be an index of genetic diversity. However genetic diversity of parents is not necessarily associated with geographic diversity or place of origin. Multivariate analysis using Mahalanobis D2 technique is a powerful tool in
identifying the degree of divergence among the genotypes. The present study was undertaken to assess genetic relatedness of 20 genotypes of grapes into different clusters based on genetic divergence.
The experimental material consisted of 20 diverse genotypes of grapes representing the broad spectrum of variation from different parts of India
ISSN 0975-928X DOI: 10.5958/0975-928X.2017.00044.8 (AOAC, 2000). The analysis of variance was
carried out for all characteristics and data were analysed following multivariate analysis of Mahalanobis (1936) and the genotypes were grouped into different clusters following Tocher’s method (Rao, 1952).
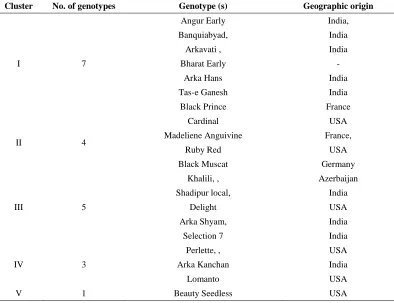
The analysis of variance (ANOVA) exhibited significant differences among the genotypes for all the characters studied. Based on D2 values, 20 genotypes were grouped into 5 clusters (Table1). The cluster strength varied from single/solitary genotype (cluster V) to 7 genotypes (cluster I). The clusters II, III and IV had 4, 5 and 3 genotypes respectively. The pattern of distribution of genotypes into five clusters confirmed the existence of diversity among the genotypes, as indicated by analysis of variance. It also revealed that geographic diversity was not related to genetic diversity as genotypes of same geographic region were grouped into different clusters and vice versa. It may be due to distribution of different gene constellations within a geographic region or due to differences in adaptation, selection criteria, selection pressure and environmental conditions. This genetic diversity among the genotypes could be due to factors like heterogeneity, genetic architecture of the populations and developmental traits (Murty and Arunachalam, 1966).
The average intra and intercluster distances are given in table 2. The intracluster distances ranged from 0 (cluster V) to 28.05 (cluster I). The cluster II and IV also had sufficient intracluster distances (25.55 and 25.75 respectively). The cluster III had minimum intracluster distance (16.79) indicating limited genetic diversity among the genotypes of this cluster. Similar findings were also reported by Rajan et al. (2007) in guava The intercluster distances were higher than intracluster distances. The maximum intercluster distance was found between cluster I and IV (149.31) followed by I and V ( 123.93). Genotypes from such clusters may be utilized in the hybridization programme as crossing between diverse parents is likely to produce wide variability and transgressive segregants with heterotic effects. The minimum intercluster distance was observed between clusters II and V (47.12) revealing that the genotypes of these clusters were relatively closer. Similar findings in grapes genotypes were also reported by Tamhankar et al. (2001).
strange to note that cluster V with a solitary genotype, Beauty Seedless recorded the highest value for six traits viz., bunch length (20.01cm), bunch breadth (12.61 cm), bunch weight (320.29g), TSS (17.33%), brix yield (3.93g) and fruit yield per vine (23.12kg). It indicated that this cluster (or genotype) with most of the desirable characters could be selected as such. However genotypes superior for specific characters from different clusters are required to be selected for utilization in recombination breeding programme to recover transgressive segregants, as genotypes within a cluster are considered similar with respect to aggregate effect of genes and the hybridization between them is not expected to be rewarding (Mishra et al., 2007).
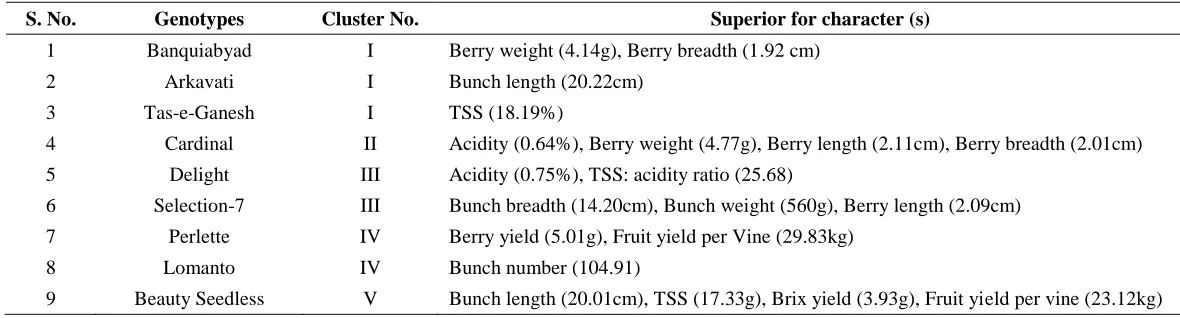
The superior genotypes for specific characters from different clusters are listed in Table 4. Potential parents for crossing programme should belong to diverse clusters characterized by large intercluster distances. Keeping in view, the large intercluster distances (Table 2) along with high mean values of different genotypes (Table 4), the promising cross combinations identified are Banquiabyad x Perlette, Banquiabyad x Lomanto, Arkavati x Perlette, Arkavati x Lomanto, Tas-e-Ganesh x Perlette, Tas-e-Tas-e-Ganesh x Lomanto, Banquiabyad x Beauty Seedless, Arkavati x Beauty Seedless, Tas-e-Ganesh x Beauty Seedless. However in order to accommodate maximum desirable characters scattered over different genotypes into a single genotype, complex crosses are required.
Acknowledgement
The authors are thankful to Dr KS Brar, Senior Plant Breeder, PAU Regional Research Station, Bathinda, for helping in data analysis and interpretation.
References
AOAC. 2000. Official Methods of Analysis. 15th Edition, Washington, DC, USA.
Chadha, K.L. and Randhawa, G.S. 1974. Grape Varieties in India - Description and Classification, ICAR Technical Bulletin u.c.o. 48, Indian Council for Agricultural Research, New Delhi.
ISSN 0975-928X DOI: 10.5958/0975-928X.2017.00044.8 system in crop plants. Indian J. Genet., 26:
188-98.
Rajan, S., Yadava, L.P., Kumar R. and Saxena, S.K. 2007. Genetic divergence in seed characteristics of guava: A basis for parent selection in hybridization. Indian J. Hort. 64(3): 290-293 Rao, C.R. 1952. Advanced statistical methods in
biometrical research. John Wiley and Sons, Inc, New York.
ISSN 0975-928X DOI: 10.5958/0975-928X.2017.00044.8 Table 1. Clustering pattern of 20 grapes genotypes
Cluster No. of genotypes Genotype (s) Geographic origin
I 7
Angur Early India,
Banquiabyad, India
Arkavati , India
Bharat Early -
Arka Hans India
Tas-e Ganesh India
Black Prince France
II 4
Cardinal USA
Madeliene Anguivine France,
Ruby Red USA
Black Muscat Germany
III 5
Khalili, , Azerbaijan
Shadipur local, India
Delight USA
Arka Shyam, India
Selection 7 India
IV 3
Perlette, , USA
Arka Kanchan India
Lomanto USA
V 1 Beauty Seedless USA
Table 2. Intra and intercluster distances (D values) among five cluster of grapes
Cluster I II III IV V
I 28.05 90.85 53.53 149.31 123.93
II 25.55 43.85 63.85 47.12
III 16.79 95.66 79.00
IV 25.75 28.99
V 0.0
ISSN 0975-928X DOI: 10.5958/0975-928X.2017.00044.8 Table 3. Cluster means for twelve component trails in grapes
Cluster
Bunch length (cm)
Bunch breadth
(cm)
Bunch weight (g)
TSS (%)
Acidity (%)
Berry weight (g)
Berry length (cm)
Berry breadth
(cm)
Bunch number
TSS/Acid ratio
Brix yield (g)
Fruit yield per vine
(kg)
I 17.36 10.96 291.74 17.25 1.06 2.72 1.77 1.59 26.79 17.99 1.23 7.14
II 16.47 10.30 224.54 15.54 1.07 2.70 1.71 1.62 68.00 17.66 2.34 14.89
III 15.93 10.83 291.14 16.81 0.93 2.27 1.72 1.49 45.66 20.30 2.13 12.55
IV 16.45 10.47 253.19 15.95 1.18 2.15 1.57 1.51 90.22 15.55 3.43 21.27
V 20.01 12.61 329.29 17.33 1.16 1.66 1.55 1.32 68.35 15.35 3.93 23.12
Table 4. List of Superior genotypes selected from different clusters
S. No. Genotypes Cluster No. Superior for character (s)
1 Banquiabyad I Berry weight (4.14g), Berry breadth (1.92 cm)
2 Arkavati I Bunch length (20.22cm)
3 Tas-e-Ganesh I TSS (18.19%)
4 Cardinal II Acidity (0.64%), Berry weight (4.77g), Berry length (2.11cm), Berry breadth (2.01cm)
5 Delight III Acidity (0.75%), TSS: acidity ratio (25.68)
6 Selection-7 III Bunch breadth (14.20cm), Bunch weight (560g), Berry length (2.09cm)
7 Perlette IV Berry yield (5.01g), Fruit yield per Vine (29.83kg)
8 Lomanto IV Bunch number (104.91)