MODELLING THE PERMEABILITY CHARACTERISTICS OF
AN EARTH RESERVOIR
A. Mohammed
1and A. Y. Abdulfatah
2,*1, 2,
D
EPARTMENT OFC
IVILE
NGINEERING,
B
AYEROU
NIVERSITY,
K
ANO,
K
ANOS
TATE,
NIGERIA
E-mail addresses:
1[email protected],
2[email protected]
ABSTRACT
Particle size distribution and void ratio of a soil are considered as the direct information that can be used in a relatively easy manner for hydraulic conductivity estimation. Estimation of hydraulic conductivity from particle size distribution can be used to check permeability values obtained from other methods. Therefore, this paper attempts to relate the particle size distribution to hydraulic conductivity. The study was carried out on 24 soil samples which were collected from the embankment of an earth reservoir and subgrade at the toe. The investigation was carried out in accordance with the standard procedure given in BS1377. A series of hydraulic conductivity tests were carried out on optimum moisture content (OMC) compacted soil samples using the falling head method. The mean sizes of particles in each sample from particle size distribution curves were determined and used to generate regression models for the flow. Linear, exponential, polynomial and logarithmic models were used to test the validity; however, the best was adopted for this study. The findings of this study show that there is variability in the particle sizes of the soil material which in turn results to variation in the hydraulic conductivity. The hydraulic conductivity was found to increase with an increase in mean particle size. The relationship between mean particle size and hydraulic conductivity yielded coefficients of determination (R2) of stronger correlation when the plastic and non-plastic samples were separately analyzed. However, all values of R2 (0.9949, 0.9968 and 0.8918 for samples 1 to 16, 17 to 24 and 1 to 24 respectively) can be considered satisfactory. In addition, generalized models for the flow were generated for the plastic, non-plastic and the combined samples. The generated models can be used to predict the hydraulic conductivity of different soil samples.
Keywords: Model, Hydraulic Conductivity, Mean Particle Size, Earth Reservoir
1. INTRODUCTION
Seepage through soils may affect the stability of geotechnical structures such as pavements, tunnels, walls, slopes and excavations [1]. In order to solve fluid flow problems associated with soil, different techniques were proposed some of which include the field methods (the pumping-of-wells test, the auger-hole test and the tracer test), laboratory methods (the falling-head test, the constant-head test) and calculations from empirical formulae [2]. Many researchers have made attempts in solving hydraulic conductivity problems in soil. However, published hydraulic conductivity equations based on the porosity
and grain-size distribution of sandy sediments are used by researchers to estimate the hydraulic conductivity of well core. These equations are based on empirical studies and the results are not necessarily transferable from one location to another [3]. In addition, some of the formulated models vary in accuracy as was seen in [4] who have recently employed several empirical formulae to specify the hydraulic conductivity of aquifer materials in the field. They stated that the most accurate estimation of the hydraulic conductivity was found using the Terzaghi equation, followed by the Kozeny-Carman, Hazen, Breyer and Slitcher equations respectively.
Vol. 38, No. 3, July 2019, pp. 580 – 585 Copyright© Faculty of Engineering, University of Nigeria, Nsukka,
Print ISSN: 0331-8443, Electronic ISSN: 2467-8821
www.nijotech.com
Hydraulic conductivity is one of the most important properties of soils [5]. Hydraulic conductivity is affected by pores space, structures and sizes of the soil, however, according to [6] estimation of hydraulic conductivity using particle size distribution is relatively simple and straightforward. Pore size distribution, which is intimately linked to the grain size distribution, is frequently involved in the determination of hydraulic conductivity. In addition, it is widely known that the hydraulic conductivity is related to the particle size distribution of the soil grains [7, 8]. Particle size distribution is considered as the direct information that can be used in a relatively easy manner for hydraulic conductivity estimation [9]. Global studies of hydraulic conductivity of marine sediments have shown that grain size exerts a first-order control on hydraulic conductivity [10, 11]. Estimation of hydraulic conductivity from particle size distribution can be used to check permeability values obtained from other methods. Therefore, this paper attempts to relate the particle size distribution to hydraulic conductivity of soils.
2. MATERIALS AND METHOD
The study was carried out on an existing and abandoned earth reservoir 200 m by 200 m. The reservoir with about 120,000 m3 capacity was
constructed for irrigation purpose and is located around Challawa Gorge Dam in Karaye Local Government, Kano-Nigeria. Challawa Gorge Dam is the main source of water for the reservoir. The dam was built by Julius Berger Nigeria between 1990 and 1992 using rock fill construction. It is 42 m high and 7.8 km in length. The dam has a full storage capacity of 904,000,000 m3. The direct catchment area is
3857 km2. The reservoir, during the study was virtually
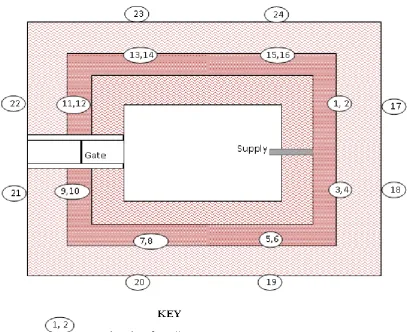
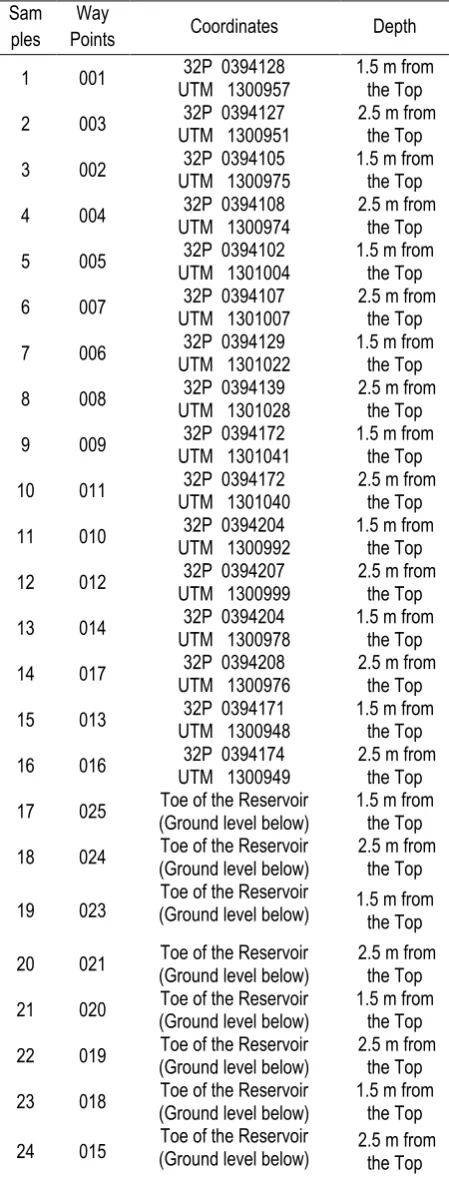
empty. Twenty-four (24) disturbed samples were collected from the embankment and subgrade at the toe of the reservoir for laboratory analyses as shown in Figure 1. GPS set to WGS 84 Map datum was used to take the coordinate of the sampling points as shown in Table 1. Samples 1 to 16 were collected from the embankment and 17 to 24 from the subgrade at the toe of the reservoir with 6 samples each representing one side of the rectangular reservoir.
Table 1: Sampling Points Coordinates and Sample Identification
Sam ples
Way
Points Coordinates Depth
1 001 UTM 1300957 32P 0394128 1.5 m from the Top
2 003 UTM 1300951 32P 0394127 2.5 m from the Top
3 002 UTM 1300975 32P 0394105 1.5 m from the Top
4 004 UTM 1300974 32P 0394108 2.5 m from the Top
5 005 UTM 1301004 32P 0394102 1.5 m from the Top
6 007 UTM 1301007 32P 0394107 2.5 m from the Top
7 006 UTM 1301022 32P 0394129 1.5 m from the Top
8 008 UTM 1301028 32P 0394139 2.5 m from the Top
9 009 UTM 1301041 32P 0394172 1.5 m from the Top
10 011 UTM 1301040 32P 0394172 2.5 m from the Top
11 010 UTM 1300992 32P 0394204 1.5 m from the Top
12 012 UTM 1300999 32P 0394207 2.5 m from the Top
13 014 UTM 1300978 32P 0394204 1.5 m from the Top
14 017 UTM 1300976 32P 0394208 2.5 m from the Top
15 013 UTM 1300948 32P 0394171 1.5 m from the Top
16 016 UTM 1300949 32P 0394174 2.5 m from the Top
17 025 (Ground level below) Toe of the Reservoir 1.5 m from the Top
18 024 (Ground level below) Toe of the Reservoir 2.5 m from the Top
19 023 (Ground level below) Toe of the Reservoir 1.5 m from the Top
20 021 (Ground level below) Toe of the Reservoir 2.5 m from the Top
21 020 (Ground level below) Toe of the Reservoir 1.5 m from the Top
22 019 (Ground level below) Toe of the Reservoir 2.5 m from the Top
23 018 (Ground level below) Toe of the Reservoir 1.5 m from the Top
24 015 (Ground level below) Toe of the Reservoir 2.5 m from the Top
The Index and Engineering properties were determined in accordance with the standard procedure given in BS1377. The specific gravity (Gs)
was determined using the gas jar method as given in Equation 1.
𝐺
𝑠=
(𝑤
2− 𝑤
1)
(𝑤
4− 𝑤
1) − (𝑤
3− 𝑤
2)
(1)
Where;
w1 = weight of empty bottle (g)
w2 = weight of empty bottle plus soil (g)
w3 = weight of empty bottle plus soil filled with water
(g)
w4 = weight of bottle filled with water (g)
The liquid limit which represents the moisture content at 25 blows was determined using Cassagrande apparatus. The plastic limit was determined by rolling a ball formed with about 8 to 10 gm of the specimen between the fingers and the glass plate with just sufficient pressure to roll the mass into a thread of uniform diameter of 3mm throughout its length. The plasticity index is taken as the difference between the liquid limit and the plastic limit. BS light compaction was used for the soil compaction test using 2.5 kg rammer and 27 blows in 3 layers in 1000 cm3
compaction mould. The maximum dry density (MDD) and optimum moisture content (OMC) were taken as the dry density and moisture content corresponding to the peak of the dry density – moisture content plots. The hydraulic conductivity tests were carried out on optimum moisture content (OMC) compacted soil samples using the falling head method as given in Equation 2.
𝑘 = 2.3𝑎𝐿 𝐴𝑡 . Log 10
ℎ1
ℎ2
(2)
Where;
k = hydraulic conductivity (cm/s) L = infiltration length (cm)
a = pipe cross-sectional area (cm2)
A = mould cross-sectional area (cm2)
t = the measurement time (s) h1 = initial head pressure (cm)
h2 = final head pressure (cm)
The mean sizes of particles in each sample from particle size distribution curves were determined using Equation 3 and used to generate regression model for the flow. The following models; Linear, exponential, polynomial and logarithmic were used to test the validity; however, the best was adopted for this study.
𝐷
𝑚𝑒𝑎𝑛=
ΣPd
ΣP
(3)
3. RESULTS AND DISCUSSION
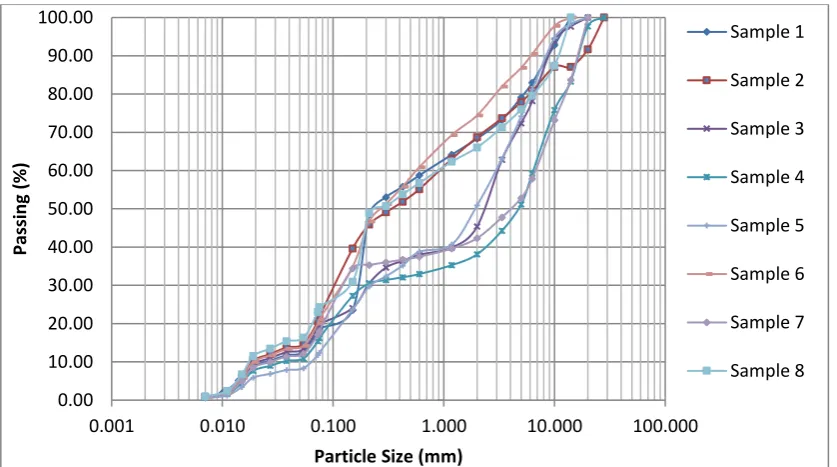
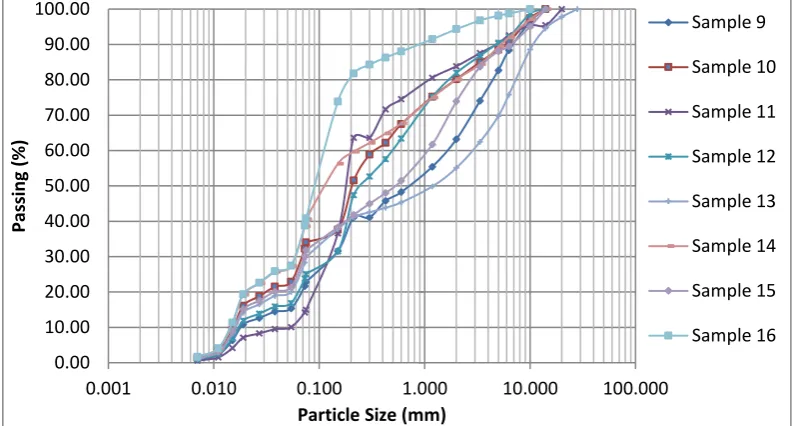
Table 2 shows the maximum dry density (MDD), optimum moisture content (OMC), Plasticity index, relative density and specific gravity of the soil. The results show that the material for the embankment varies with sampling point. This is an indication of variability in seepage through the soil materials. The particle size distribution curves are presented in Figures 2 – 4. The curves show that samples 1, 2, 6, 8, 9, 10, 12, 14 and 15 are clayey sand with gravel; 3 and 13 are clayey gravel with sand; 4, 5 and 7 are silty gravel with sand; 11 is silty sand with gravel; 16 is clayey sand; 17, 22, 23 and 24 are silty sand with gravel and 18, 19, 20 and 21 are silty sand. This classification is based on the unified system of classification.
The Figures 2 – 4 show the variability in the particle sizes of the soil material. This variability was also shown by the mean particle sizes as given in Table 3. The study indicated that the hydraulic conductivity increased with an increase in mean particle size. This variation could be attributed to the variation in particle size contents.
Table 2: Samples MDD, OMC, Plasticity index and Specific gravity
Sample No
MDD (Mg/m3)
OMC (%)
Plasticity Index (%)
Specific Gravity
1 1.95 13.8 12 2.77
2 1.99 11.13 10 2.72
3 1.96 13.0 12 2.56
4 2.07 11.4 7 2.78
5 2.06 14.7 7 2.87
6 2.01 12.61 8 2.52
7 1.92 11.54 6 2.67
8 1.95 14.66 14 2.66
9 2.05 17.2 10 2.47
10 1.83 16.2 15 2.64
11 1.88 13.47 7 2.74
12 2.04 12.6 15 2.41
13 2.01 12.4 9 2.67
14 1.87 15.6 10 2.73
15 1.81 14.8 18 2.41
16 1.87 15.8 14 2.7
17 2.11 12 NP 2.71
18 1.88 11.2 NP 2.41
19 2.05 11.2 NP 2.51
20 2.06 12.4 NP 2.34
21 1.99 12.5 NP 2.67
22 2.01 10 NP 2.31
23 1.8 12.0 NP 2.55
24 1.94 10.23 NP 2.42
Figure 2: Particle size distribution curve for samples 1 to 8
0.00 10.00 20.00 30.00 40.00 50.00 60.00 70.00 80.00 90.00 100.00
0.001 0.010 0.100 1.000 10.000 100.000
Pas
si
n
g
(%
)
Particle Size (mm)
Sample 1
Sample 2
Sample 3
Sample 4
Sample 5
Sample 6
Sample 7
Figure 3: Particle size distribution curve for samples 9 to 16
Figure 4: Particle size distribution curve for samples 17 to 24
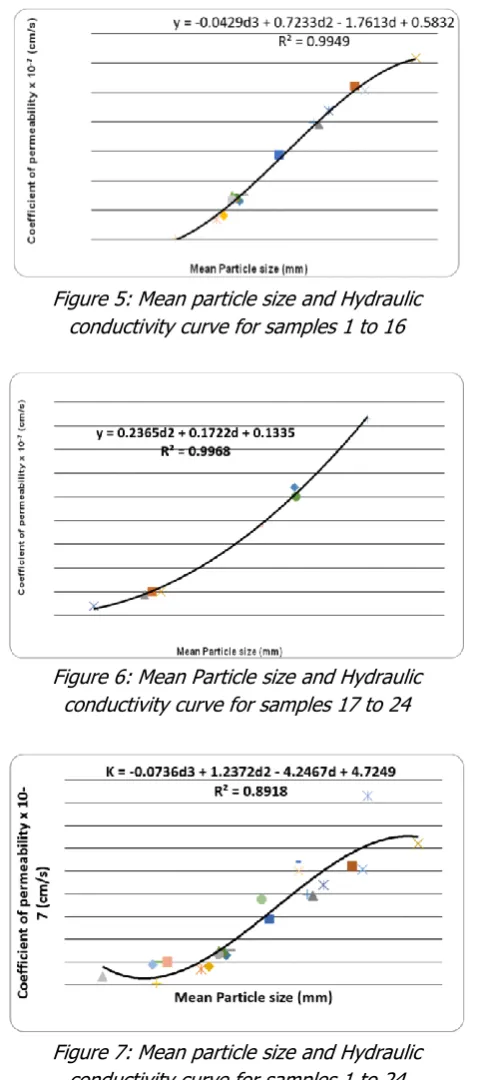
Figures 5 – 7 are plots showing the relationship between mean particle size and hydraulic conductivity. The coefficients of determination (R2) are 0.9949,
0.9968 and 0.8918 for sample 1 to 16, 17 to 24 and 1 to 24 respectively. This shows that there is a good correlation between particle mean size and hydraulic conductivity among the samples analyzed in this study. However, a stronger correlation were noticed when the plastic and non-plastic samples were separately analyzed. The findings of this study corroborated [3] that mean grain size, the Kruger effective diameter, and effective diameters ranging from D10 to D20 have
high correlation coefficients with measured
permeability. In addition, generalized models for the flow were generated as given in Equations 4-6. These Equations represent the models for plastic, non-plastic and the combined samples respectively.
K = -0.0429d3 + 0.7233d2 - 1.7613d + 0.5832 (4)
K = 0.2365d2 + 0.1722d + 0.1335 (5)
K = -0.0736d3 + 1.2372d2 - 4.2467d + 4.7249 (6)
Where;
K = hydraulic conductivity (cm/s) d = mean particle size (mm)
0.00 10.00 20.00 30.00 40.00 50.00 60.00 70.00 80.00 90.00 100.00
0.001 0.010 0.100 1.000 10.000 100.000
Pas
si
n
g
(%
)
Particle Size (mm)
Sample 9
Sample 10
Sample 11
Sample 12
Sample 13
Sample 14
Sample 15
Sample 16
0.00 10.00 20.00 30.00 40.00 50.00 60.00 70.00 80.00 90.00 100.00
0.001 0.010 0.100 1.000 10.000 100.000
Pas
si
n
g
(%
)
Particle Size (mm)
Sample 17
Sample 18
Sample 19
Sample 20
Sample 21
Sample 22
Sample 23
Figure 5: Mean particle size and Hydraulic conductivity curve for samples 1 to 16
Figure 6: Mean Particle size and Hydraulic conductivity curve for samples 17 to 24
Figure 7: Mean particle size and Hydraulic conductivity curve for samples 1 to 24
4. CONCLUSIONS
Measured hydraulic conductivity was correlated with a number of particle-size parameters. The generated plots from this study were compared with the measured hydraulic conductivity and mean particle sizes. The study concluded that there was a strong correlation between hydraulic conductivity and mean particle size of the soil samples used. However, this correlation was stronger when the plastic and
non-plastic samples were jointly examined. The generated models can be used to predict the hydraulic conductivity of different soil samples.
5. REFERENCES
[1] Dulcey-Leal, E., Molina-Gómez, F. and Bulla-Cruz, L. A. Hydraulic Conductivity in Layered Saturated Soils assessed through a Novel Physical Model. DYNA, 85(205), pp. 119-124. 2018.
[2] Ali, F. C. and Nurullah, A. H. K. Effects of the Particle Shape and Size of Sands on the Hydraulic Conductivity. Acta Geotechnica Slovenica, Volume 2, pp 83–93. 2016.
[3] Daniel, M. D. Permeability, Porosity, and Grain-Size Distribution of selected Pliocene and Quaternary Sediments in the Albuquerque Basin. New Mexico Geology, pp 79–87. 1995.
[4] Ishaku, J.M., Gadzama, E.W., Kaigama, U. Evaluation of empirical formulae for the determination of hydraulic conductivity based on grain-size analysis. Journal of Geology and Mining Research, 4, 105-113. 2011.
[5] Gupta, P., Alam, J. and Muzzammil, M. Influence of thickness and position of the individual layer on the permeability of the stratified soil. Perspectives in Science, 8, pp. 757-759. 2016.
[6] Marshall, T. A relation between permeability and size distribution of pores. European Journal of Soil Science, 9(1), 1-8. 1958.
[7] Freeze, R. A. and Cherry, J. A. Groundwater. Prentice Hall Inc., Englewood Cliffs, New Jersey. 1979. [8] Mokwa, R. L. and Trimble, N. R. Permeability of
Coarse-Grain Soil from Void Space and Pore Distribution in GeoCongress. Reston, VA: American Society of Civil Engineers, pp. 428-435. 2008. [9] Stewart, M. L., Ward, A. L. and Rector, D. R. A study
of pore geometry effects on anisotropy in hydraulic permeability using the lattice-Boltzmann method. Advances in water resources, 29(9), 1328-1340. 2006.
[10] Gamage, K., Screaton, E., Bekins, B. and Aiello, I. Permeability–porosity relationships of subduction zone sediments. Marine Geology, 279(1–4):19–36. 2011.