A Framework for the Selection of a Packaging Design Based on the SWARA
Method
Dragisa Stanujkic, Darjan Karabasevic, Edmundas Kazimieras Zavadskas
Megatrend University
Park Suma Kraljevica bb, 19000 Zajecar, Republic of Serbia
E-mail. [email protected], [email protected]
Institute of Internet and Intelligent Technologies, Vilnius Gediminas Technical University, Sauletekio al. 11, 10223, Vilnius, Lithuania E-mail. [email protected]
http://dx.doi.org/10.5755/j01.ee.26.2.8820
Well-designed packaging is intended to present a product in the best possible way, which would have a significant impact on sales improvement. Creating and finding the ideal design solution for packaging is an extremely complex process. Many characteristics of a packaging design can affect the level of customer satisfaction, where the different characteristics of the packaging tend to have a different significance. To make the problem more complex, the significance of characteristics of a packaging design is not the same for all customers. Therefore, creating and finding the ideal design solution for packaging often involves an evaluation of a number of variants, typically evaluated on the basis of multiple criteria, often with different significance. To provide an efficient approach for the selection of appropriate packaging, a framework for selecting the appropriate packaging design which meets customer preferences, based on the SWARA method and group decision making, is proposed. The usability and efficiency of the proposed framework is considered in the case of the selecting the appropriate packaging design for the wine of the autochthonous grape variety called Black Tamjanika. On the basis the considered examples, it can be concluded that SWARA method can be successfully used to solve many similar problems, and that in some cases may have some advantages over similar methods, such as AHP method or Conjoint Analysis. As an advantage of the proposed procedure can be mentioned a much smaller number of comparisons in pairs, compared with the AHP method, and much more comprehensible procedure for selecting the most acceptable alternative, compared with Conjoint Analysis. The proposed framework can also be easily adjusted to solve a significant number of MCDM problems.
Keywords: Step-wise Weight Assessment Ratio Analysis (SWARA), packaging selection, packaging design, MCDM,
pairwise comparison.
Introduction
The importance and role of packaging has changed over the years, from its basic purpose to preserve and protect a product from external influences to the present requirements that well-designed packaging facilitates selling and the very act of buying with the best way to establish a relationship between producers, on the one hand, and buyers, on the other.
Well-designed packaging is intended to present a product in the best possible way, which would have a significant impact on sales improvement.
Creating and finding the ideal design solution for packaging is an extremely complex process. In a sea of similar products, a design has a specific function and reflects the creation of a product different from others and likely to attract the favor of consumers. Today, contemporary design in companies plays a very important role; with a good design and an innovative approach, a company’s offer and its products are differentiated from the competition; a design can be said to be one of the ways for gaining a competitive advantage on the market.
The identification, prioritization and determining of the significance of customer requirements are very important. Therefore, numerous studies have been dedicated to this problem, a significant number of which have been based on the Conjoint Analysis (Anderson & Bettencourt, 1993; Ares & Deliza, 2010; Lihra at al., 2012; Pentus et al., 2014; Garver at al., 2014) and AHP method, proposed by Saaty (1977; 1980), such as (Armacost et al., 1994; Kwong & Bai, 2003; Lin et al., 2008; Chan et al., 2012; Desai et al., 2012; Chan et al., 2013; Aghdaie et al., 2013a; Muerza, et al., 2014; Wang et al., 2014).
Dragisa Stanujkic, Darjan Karabasevic, Edmundas Kazimieras Zavadskas. A Framework for the Selection of a Packaging… the energy system (Hashemkhani Zolfani & Saparauskas,
2013), supplier selection (Alimardani et al., 2013), evaluation of external wall insulation (Ruzgys, 2014).
Compared to the AHP method, the SWARA method has some similarities but also its own specificities. Therefore, the use of the SWARA method for choosing the most appropriate design solution to packaging is being considered in this paper.
Because all the above-mentioned reasons, the rest of this paper is organized as follows: in Section 1, the computational procedure of the SWARA method is shown. Section 2 provides a comparison between the SWARA and the AHP methods. In Section 3, a framework for selecting an appropriate packaging design is proposed. In Section 4, a case study is discussed, with the aim to explain in detail the proposed methodology, to point out its efficiency as well as to identify its possible weaknesses. Finally, the conclusions are presented.
The Computational Procedure of the SWARA Method
The process of determining the relative weights of criteria using SWARA method can accurately be shown by using the following steps:
Step 1. The criteria are sorted in descending order based on their expected significances.
Step 2. Starting from the second criterion, the respondent expresses the relative importance of criterion j
in relation to the previous (j-1) criterion, for each particular criterion. According to Kersuliene et al. (2010), this ratio is called the Comparative importance of average value, sj.
Step 3. Determine the coefficient kj as follows:
1 1 1 1 j s j k j
j . (1)
Step 4. Determine the recalculated weight qj as
follows: 1 1 1 1 j k k j q j j
j . (2)
Step 5. The relative weights of the evaluation criteria are determined as follows:
n k k j j q q w 1
, (3)
where wjdenotes the relative weight of criterion j.
A Comparison of the SWARA and the AHP Methods
The SWARA and the AHP methods have significant similarities with each other, but they also have their own respective specificities.
Both methods use pairwise comparisons to express the relative significance of the elements in a hierarchy, which is called the Comparative importance of average value in the SWARA method; which is usually suitable for decision makers, i.e. respondents involved in evaluation. However, for the same number n of criteria, the AHP method requires a significantly greater number of pairwise comparisons, which is ni2 ij2j comparisons, compared with the
SWARA method, where the required number of pairwise comparisons is significantly lower, i.e. n-1 comparisons.
In the case of solving decision-making problems involving a larger number of criteria using the AHP method, the number of comparisons significantly increases, which can have a negative impact on the consistency of performed comparisons.
However, the AHP method includes the procedure for checking the consistency of performed comparisons, which allows an easy identification of the inadequate respondent, i.e. a useless questionnaire.
SWARA method does not have such, or similar, procedure. However, the number of required comparisons in the SWARA method is significantly lower in comparison with the AHP method, which makes it more attractive to use in cases of gathering responses from ordinary respondents, i.e. those respondents who were previously not significantly prepared for the use of the SWARA method.
The next difference between these methods is related to the use of predefined scales for expressing preferences. For pairwise comparisons in the AHP method, commonly is used the nine-point scale proposed by Saaty (1980). In contrast, in the SWARA method, respondents have a greater freedom to express their attitudes. However, there are some advantages, as well as disadvantages, to each of these approaches that can be highlighted.
A Framework for Selecting an Appropriate Packaging Design
The framework for selecting appropriate packaging design, which respects customer preferences, based on SWARA method and group decision making, can be shown using the following steps:
Step 1. As stated in (Kersuliene et al., 2010), the first step in solving a problem using the SWARA method begins with defining a set of evaluation criteria, after which the criteria are sorted in descending order on the basis of their expected significance.
Step 2. Define the domain for each criterion, i.e. a set of available instances. Similar to the criteria, the available instances for each criterion are sorted in descending order, based on their expected significance.
Step 3. Determine weights of criteria. In this step, respondents express their preferences about the importance of the criteria by giving numerical values to the variable sj.
In order to obtain the results that more accurately reflect respondents’ opinions, it is necessary to inform respondents that the relationship between sj and wj is not
linear. This deviation is not so significant for the low values of sj, but it cannot be fully ignored when higher
Therefore, in Table 1 are given some pre-selected value for sj. In addition, in this table are given
significances of criterions j and j-1, as well as the relative distance between them, for each sj.
Table 1
The pre-selected values of sj and their impact on the relative weights of criteria
It is important to note that the values shown in Table 1 were obtained on the basis of the comparison of only two criteria. In the case of solving problems that involve a few criteria, the comparison procedure is much more complex and therefore it may be useful for respondents to gain an insight into the achieved results, and to be allowed, if necessary, to correct their own responses.
For this purpose, using a certain form of “interactive questionnaires” made in a spreadsheet program can provide significant advantages in comparison with using the ordinary paper form of questionnaires.
Step 4. Determine the significance of instances, for each particular criterion. This step is carried out for each of the evaluation criteria, wherein for each instance of a criterion, relative importance is determined through the procedure described in Step 3.
Step 5. Establish a set of acceptable variants and determine their priorities. In the case of using a greater number of criteria, as well as a greater number of instances for each criterion, the number of possible variants rapidly grows. A large number of variants may further make it more difficult for respondents to evaluate alternatives; so, it is desirable that a set of potentially acceptable variants should be formed and their evaluation be performed.
Step 6. Determine the significance of potentially acceptable variants. Determining the significance of each variant can be done as follows
lj n
j j k
i ww
S , (4)
where: Sikdenotes the overall significance of variant i on the basis of the responses obtained from respondent k,
wj denotes the relative weight of criterion j, wlj denotes the
relative weight of variant l from domain of criterion j.
Step 7. Determine the overall significance of each variant based on a group approach. For a group containing the K decision makers, the overall group significance of each variant Sican be calculated using the geometric mean,
as follows:
K K
k k i
i S
S
1
1
. (5)
Case Study
Tamjanika is an old type of grapes, a variety of Muscat Blanc a Petite Grains, grown in Serbia and Macedonia. Tamjanika is used to produce white wines of an intense fruit aroma and taste.
However, there is a less known fact that there is Crna Tamjanika (Black Tamjanika), probably a Serbian indigenous variety grown in the vicinity of Negotin. Even there, this species of grapes was nearly weeded out. Fortunately, some wine producers recognized this species of grapes as a business opportunity and started growing it.
Knowing that product packaging and a packaging design may have a significant effect on its placement on the market, it was necessary to make a selection of an appropriate packaging design (Westerman et al., 2013; Luo
et al., 2012; Xie, 2012), i.e. to select an appropriate bottle design, as well as the shape, the orientation, and the alignment of the graphical forms on consumers’ assessments. In the initial study, in order to reduce the number of possible variations, a number of respondents were asked to perform the ranking of possible packaging.
For the reason of simplicity in this paper, the steps used in the evaluation of alternative packaging designs are presented on the basis of the responses obtained from three selected respondents.
In accordance with the framework proposed in Section 3, at the beginning of the evaluation process, the respondents specified the set of the criteria according to which the further evaluation will be performed; also, they determined the appropriate set of really usable instances for each one of the criteria.
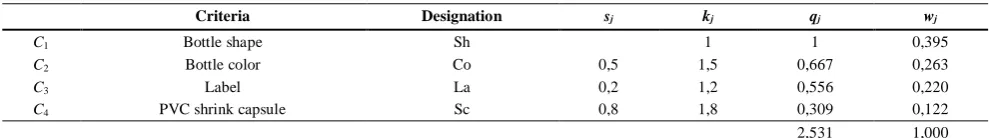
In the next step, the respondents determined the significance of the selected evaluation criteria. The responses of the first of the three respondents as well as the obtained weights of the criteria are shown in Table 2.
Table 2
The responses obtained from the first of the three respondents and the relative weights of the criteria
Criteria Designation sj kj qj wj
C1 Bottle shape Sh 1 1 0,395
C2 Bottle color Co 0,5 1,5 0,667 0,263
C3 Label La 0,2 1,2 0,556 0,220
C4 PVC shrink capsule Sc 0,8 1,8 0,309 0,122
2,531 1,000
sj wj wj-1 (wj-1-wj)/wj−1 ( %)
0 0,500 0,500 0,00
0,05 0,512 0,488 4,76
0,1 0,524 0,476 9,09
0,15 0,535 0,465 13,04 0,2 0,545 0,455 16,67 0,25 0,556 0,444 20,00 0,3 0,565 0,435 23,08 0,35 0,574 0,426 25,93 0,4 0,583 0,417 28,57 0,45 0,592 0,408 31,03 0,5 0,600 0,400 33,33
1 0,667 0,333 50,00
1,5 0,714 0,286 60,00
2 0,750 0,250 66,67
Dragisa Stanujkic, Darjan Karabasevic, Edmundas Kazimieras Zavadskas. A Framework for the Selection of a Packaging…
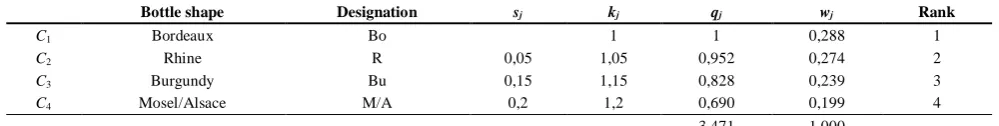
After that, the respondents carried out the evaluation of the instances of each criterion.
Table 3 shows the results obtained from the first respondent during the evaluation of the bottle shapes.
Tables 4, 5 and 6 show the results obtained for the following criteria: the color, the label and the PVC shrink capsule of the bottle, respectively, the ones also obtained from the first of the three respondents.
Table 3
The relative weights of the bottle shapes obtained on the basis of the first of the three respondents
Bottle shape Designation sj kj qj wj Rank
C1 Bordeaux Bo 1 1 0,288 1
C2 Rhine R 0,05 1,05 0,952 0,274 2
C3 Burgundy Bu 0,15 1,15 0,828 0,239 3
C4 Mosel/Alsace M/A 0,2 1,2 0,690 0,199 4
3,471 1,000
Table 4
The relative weights of the bottle color obtained on the basis of the first of the three respondents
Table 5
The relative weights of the labels obtained on the basis of the first of the three respondents
Criteria Designation sj kj qj wj Rank
1 Rectangular, dark red colored background label with gold
colored characters Rr 1 1 0,375 1
2 Rectangular, white colored background with black colored
characters Rw 0 1 1,000 0,375 1
3 Oval, white colored background with black colored
characters Ow 0,5 1,5 0,667 0,250 3
2,667 1,000
Table 6
The relative weights of the color of the PVC shrink capsules obtained on the basis of the first of the three respondents
Criteria Designation sj kj qj wj Rank
1 Matte Black Mb 1 1 0,368 1
2 Burgundy B 0 1 1,000 0,368 1
3 Matte white Mw 0,4 1,4 0,714 0,263 3
2,714 1,000
The summary of the ranking results obtained on the basis of the responses of the first of the three respondents are presented in Table 7. The values in Columns XII, XIII, XIV and XV were obtained by multiplying the relative weights of the criteria and the relative weights of the instances. The values in Column XVI were obtained as the sum of the values in Columns XII, XIII, XIV and XV, i.e. using Eq. (4).
Finally, Column XVII shows the ranks of the considered variants. As it can be seen, there are several variants which are the candidates for the best placed alternative. It can also be seen that the top ranked form of the bottle (Rd) in relation to the most important criterion (C1) may have a low position, e.g. Variant 8.
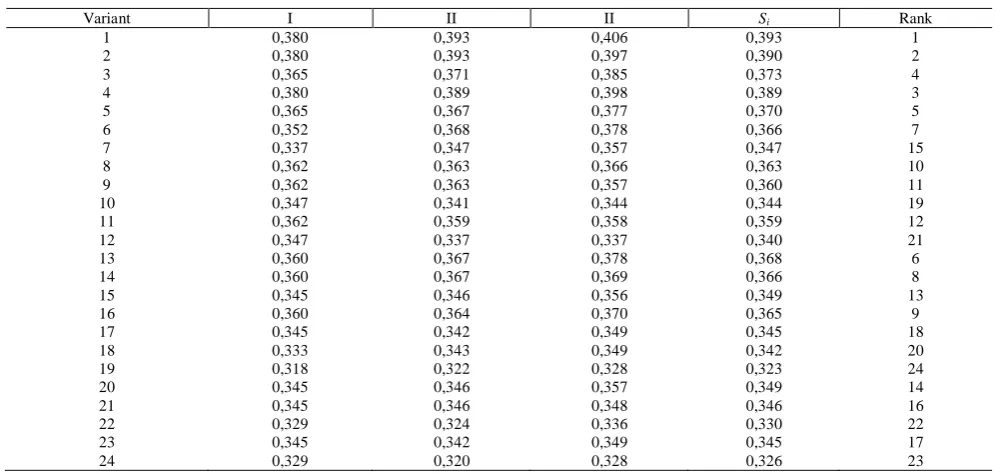
The overall ranking order of the variants obtained on the basis of the responses of the three respondents is shown in Table 7.
As it can be concluded from Table 8 above, the inclusion of a larger number of respondents in the process of the selection of the most suitable packaging design has an impact on the ranking order of variants, i.e. alternatives. By having a larger number of respondents included in the selection process, the obtained results will to a greater extent reflect the real attitudes of customers.
Criteria Designation sj kj qj wj Rank
1 French green Fg 1 1 0,524 1
2 Antique green Ag 0,1 1,1 0,909 0,476 2
Table 7
The relative weights of the variants obtained on the basis of the first of the three respondents
I II III IV V VI VII VIII IX X XII XIII XIV XV XVI XVII
C1 C2 C3 C4 C1 C2 C3 C4
Bottle wj 0,395 0,263 0,220 0,122
Variants Shape Color Label Shrink Sh Co La Sc Sh Co La Sc Si Rank
1
Bo Fg Rr
Mb
0,288 0,524 0,375
0,368 0,114 0,138 0,082 0,045 0,379 1
2 B 0,368 0,114 0,138 0,082 0,045 0,379 1
3 Mw 0,263 0,114 0,138 0,082 0,032 0,366 4
4
Rw Mb 0,375 0,368 0,114 0,138 0,082 0,045 0,379 1
5 Mw 0,263 0,114 0,138 0,082 0,032 0,366 4
6
Ow Mb 0,25 0,368 0,114 0,138 0,055 0,045 0,352 12
7 Mw 0,263 0,114 0,138 0,055 0,032 0,339 20
8
R Ag Rr
Mb
0,274 0,476 0,375
0,368 0,108 0,125 0,082 0,045 0,361 6
9 B 0,368 0,108 0,125 0,082 0,045 0,361 6
10 Mw 0,263 0,108 0,125 0,082 0,032 0,348 13
11
Rw Mb 0,375 0,368 0,108 0,125 0,082 0,045 0,361 6
12 Mw 0,263 0,108 0,125 0,082 0,032 0,348 13
13
Bu Fg Rr
Mb
0,239 0,524 0,375
0,368 0,094 0,138 0,082 0,045 0,360 9
14 B 0,368 0,094 0,138 0,082 0,045 0,360 9
15 Mw 0,263 0,094 0,138 0,082 0,032 0,347 15
16
Rw Mb 0,375 0,368 0,094 0,138 0,082 0,045 0,360 9
17 Mw 0,263 0,094 0,138 0,082 0,032 0,347 15
18
Ow Mb 0,25 0,368 0,094 0,138 0,055 0,045 0,332 21
19 Mw 0,263 0,094 0,138 0,055 0,032 0,319 24
20
M/A Fg Rr
Mb
0,199 0,524 0,375
0,368 0,079 0,138 0,082 0,045 0,344 17
21 B 0,368 0,079 0,138 0,082 0,045 0,344 17
22 Mw 0,263 0,079 0,138 0,082 0,032 0,331 22
23
Rw Mb 0,375 0,368 0,079 0,138 0,082 0,045 0,344 17
24 Mw 0,263 0,079 0,138 0,082 0,032 0,331 22
Table 8 The overall ranking order of the variants obtained on the basis of the responses of the three respondents
Variant I II II Si Rank
1 0,380 0,393 0,406 0,393 1
2 0,380 0,393 0,397 0,390 2
3 0,365 0,371 0,385 0,373 4
4 0,380 0,389 0,398 0,389 3
5 0,365 0,367 0,377 0,370 5
6 0,352 0,368 0,378 0,366 7
7 0,337 0,347 0,357 0,347 15
8 0,362 0,363 0,366 0,363 10
9 0,362 0,363 0,357 0,360 11
10 0,347 0,341 0,344 0,344 19
11 0,362 0,359 0,358 0,359 12
12 0,347 0,337 0,337 0,340 21
13 0,360 0,367 0,378 0,368 6
14 0,360 0,367 0,369 0,366 8
15 0,345 0,346 0,356 0,349 13
16 0,360 0,364 0,370 0,365 9
17 0,345 0,342 0,349 0,345 18
18 0,333 0,343 0,349 0,342 20
19 0,318 0,322 0,328 0,323 24
20 0,345 0,346 0,357 0,349 14
21 0,345 0,346 0,348 0,346 16
22 0,329 0,324 0,336 0,330 22
23 0,345 0,342 0,349 0,345 17
24 0,329 0,320 0,328 0,326 23
Conclusions
Based on the results discussed in the considered case study, the SWARA method can successfully be used when selecting the most desirable packaging design.
A significantly smaller number of pairwise comparisons can be mentioned as an advantage of the proposed procedure in relation to similar procedures,
especially those based on the pairwise comparisons proposed in the AHP method..
Dragisa Stanujkic, Darjan Karabasevic, Edmundas Kazimieras Zavadskas. A Framework for the Selection of a Packaging…
References
Aghdaie, M. H., Zolfani, S. H., & Zavadskas, E. K. (2013a). Market segment evaluation and selection based on application of fuzzy AHP and COPRAS-G methods. Journal of Business Economics and Management, 14(1), 213–-233. http://dx.doi.org/10.3846/16111699.2012.721392
Aghdaie, M. H., Zolfani, S. H., & Zavadskas, E. K. (2013b). Decision making in machine tool selection: An integrated approach with SWARA and COPRAS-G methods. Inzinerine Ekonomika-Engineering Economics, 24(1), 5–17. Alimardani, M., Hashemkhani Zolfani, S., Aghdaie, M. H., & Tamosaitiene, J. (2013). A novel hybrid SWARA and
VIKOR methodology for supplier selection in an agile environment. Technological and Economic Development of Economy, 19(3), 533–548. http://dx.doi.org/10.3846/20294913.2013.814606
Anderson, J. L., & Bettencourt, S. U. (1993). A conjoint approach to model product preference: The New England market for fresh and frozen salmon. Marine Resource Economics, 8(1), 31–49.
Ares, G., & Deliza, R. (2010). Studying the influence of package shape and colour on consumer expectations of milk desserts using word association and conjoint analysis. Food Quality and Preference, 21(8), 930–937. http://dx.doi.org/10.1016/j.foodqual.2010.03.006
Armacost, R. L., Componation, P. J., Mullens, M. A., & Swart, W. W. (1994). An AHP framework for prioritizing customer requirements in QFD: an industrialized housing application. IIE transactions, 26(4), 72–-79. http://dx.doi.org/10.1080/07408179408966620
Chan, H. K., Wang, X., White, G. R. T., & Yip, N. (2013). An extended fuzzy-AHP approach for the evaluation of green product designs. Engineering Management, IEEE Transactions on, 60(2), 327–339. http://dx.doi.org/10.1109/TEM. 2012.2196704
Chan, K. Y., Kwong, C. K., & Dillon, T. S. (2012). An enhanced fuzzy AHP method with extent analysis for determining importance of customer requirements. In Computational Intelligence Techniques for New Product Design. (pp. 79– 93). Springer Berlin Heidelberg. http://dx.doi.org/10.1007/978-3-642-27476-3_4
Desai, S., Bidanda, B., & Lovell, M. R. (2012). Material and process selection in product design using decision–making technique (AHP). European Journal of Industrial Engineering, 6(3), 322–346. http://dx.doi.org/10.1504/EJIE .2012.046666
Garver, M. S., Divine, R. L., & Spralls, S. A. (2014). Choice-Based Conjoint Analysis of the Local Coupon Preferences of Millennials. Journal of Promotion Management,20(2), 240–249. http://dx.doi.org/10.1080/10496491.2014.894956 Hashemkhani Zolfani, S., & Saparauskas, J. (2013). New application of SWARA method in prioritizing sustainability
assessment indicators of energy system. Inzinerine Ekonomika – Engineering Economics, 24(5), 408–414.
Hashemkhani Zolfani, S., Zavadskas, E. K., & Turskis, Z. (2013). Design of products with both International and Local perspectives based on Yin-Yang balance theory and SWARA method. Ekonomska istraživanja-Economic Research, 26(2), 153–166.
Kaplinski, O., & Tupenaite, L. (2011). Review of the multiple criteria decision making methods, intelligent and biometric systems applied in modern construction economics. Transformations in Business & Economics, 10(1), 166-81. Kersuliene, V., & Turskis, Z. (2011). Integrated fuzzy multiple criteria decision making model for architect selection.
Technological and Economic Development of Economy, 17(4), 645–666. http://dx.doi.org/10.3846/20294913. 2011.635718
Kersuliene, V., Zavadskas, E. K., & Turskis, Z. (2010). Selection of rational dispute resolution method by applying new step - wise weight assessment ratio analysis (SWARA). Journal of Business Economics and Management, 11(2), 243–258. http://dx.doi.org/10.3846/jbem.2010.12
Kwong, C. K., & Bai, H. (2003). Determining the importance weights for the customer requirements in QFD using a fuzzy AHP with an extent analysis approach. IEE Transactions, 35(7), 619–626. http://dx.doi.org/10.1080/0740 8170304355
Lihra, T., Buehlmann, U., & Graf, R. (2012). Customer preferences for customized household furniture. Journal of Forest Economics,18(2), 94–112. http://dx.doi.org/10.1016/j.jfe.2011.11.001
Lin, M. C., Wang, C. C., Chen, M. S. &Chang, C. A. (2008). Using AHP and TOPSIS approaches in customer-driven product design process. Computers in Industry, 59(1), 17–31. http://dx.doi.org/10.1016/j.compind.2007.05.013 Luo, S. J., Fu, Y. T., & Korvenmaa, P. (2012). A preliminary study of perceptual matching for the evaluation of beverage
bottle design. International Journal of Industrial Ergonomics, 42(2), 219–232. http://dx.doi.org/10.1016/j.ergon. 2012.01.007
Pentus, K., Mehine, T., & Kuusik, A. (2014). Considering Emotions in Product Package Design through Combining Conjoint Analysis with Psycho Physiological Measurements. Procedia-Social and Behavioral Sciences, 148, 280– 290. http://dx.doi.org/10.1016/j.sbspro.2014.07.044
Ruzgys, A., Volvačiovas, R., Ignatavičius, Č., & Turskis, Z. (2014). Integrated evaluation of external wall insulation in residential buildings using SWARA-TODIM MCDM method. Journal of Civil Engineering and Management, 20(1), 103–110. http://dx.doi.org/10.3846/13923730.2013.843585
Saaty, T. L. (1977). A scaling method for priorities in hierarchical structures. Journal of Mathematical Psychology,15(3), 234–281. http://dx.doi.org/10.1016/0022-2496(77)90033-5
Saaty, T.L. (1980). The Analytical Hierarchy Process: Planning, Priority Setting, Resource Allocation. New York: McGraw-Hill. 287 p.
Turskis, Z., & Zavadskas, E. K. (2011). Multiple criteria decision making (MCDM) methods in economics: an overview.
Technological and economic development of economy, 17(2), 397–427. http://dx.doi.org/10.3846/20294913.2011. 593291
Wang, X., Chan, H. K., Lee, C. K., & Li, D. (2014). A hierarchical model for eco-design of consumer electronic products. Technological and Economic Development of Economy (ahead-of-print), 1–17. http://dx.doi.org/10.3846/2029 4913.2013.876685
Westerman, S. J., Sutherland, E. J., Gardner, P. H., Baig, N., Critchley, C., Hickey, C., S., Mehigan, S., Solway, A., & Zervos, Z. (2013). The design of consumer packaging: Effects of manipulations of shape, orientation, and alignment of graphical forms on consumers’ assessments. Food Quality and Preference, 27(1), 8–17. http://dx.doi.org/10. 1016/j.foodqual.2012.05.007
Xie, Y. (2012). Wine Bottle Design and Consumer Preferences. In Proc. of the 2nd International Conference on Green Communications and Networks 2012 (GCN 2012), 12-14 December, 2012, Chongqing, China, 639–646.
Zavadskas, E. K., Turskis, Z., & Kildiene, S. (2014). State of art surveys of overviews on MCDM/MADM methods.
Technological and Economic Development of Economy, 20(1), 165–179. http://dx.doi.org/10.3846/20294 913.2014.892037