© 2019, IRJET | Impact Factor value: 7.211 | ISO 9001:2008 Certified Journal
| Page 364
ENERGY EFFICIENT DYNAMIC CLUSTER HEAD SELECTION WITH
DIFFERENTIAL EVOLUTION AND BAT OPTIMIZATION ALGORITHM FOR
WIRELESS SENSOR NETWORKS
ANUPRIYA. A
Sankara College of Science and Commerce, Coimbatore, India
---***---
Abstract -
Wireless communication is favoured in variousdetecting applications because of its comfort, cost-viability, and adaptability. Present day sensors are flexible to detect the ecological factors and send them remotely. The data accumulation focuses want to gather restricted bunched data from a gathering of sensors as opposed to gathering them from individual sensors. In perspective of the wireless sensor network clustering algorithm at home and abroad, the dynamic group head choice techniques for a wireless sensor network are advanced with the end goal to take care of the issue of the nonsensical group head choice that may prompt the covering inclusion and uneven vitality utilization in the group correspondence. In this work, a straightforward and powerful cluster calculation called Energy Efficient Dynamic Cluster Head Selection with Differential Evolution and Bat Optimization calculation (EEDCHS-DEBO) is proposed for the environmental checking fields. Cluster heads (CHs) are chosen dependent by and large correspondence separation and waiting vitality
Key Words: Wireless sensor network, clustering algorithms,
energy, Bat optimization.
1. INTRODUCTION
Wireless Sensor Network (WSN) is a collection of specialized transducers with a communications infrastructure intended to monitor and record conditions at diverse locations. Generally monitored parameters are temperature, humidity, pressure, wind direction and speed, illumination intensity, vibration intensity, sound intensity, power-line voltage, chemical concentrations, pollutant levels and vital body functions.
A sensor network consists of many detection stations called sensor nodes, each of which is small, lightweight and portable. All sensor node is equipped with a transducer, microcomputer, transceiver and power source. The transducer gives electrical signals based on sensed physical effects and phenomena. The microcomputer processes and stores the sensor output. The transceiver, which may be hard-wired or wireless, receives commands from a central computer and transmits data to that computer. The power for each sensor node is defined from the electric utility or from a battery.
Figure 1.1 Architecture of the Wireless Sensor Network
The primary qualities of a WSN include:
• Power utilization requirements for hubs utilizing batteries or vitality collecting
• Ability to adapt to hub disappointments • Mobility of hubs
• Heterogeneity of hubs
• Scalability to extensive size of organization • Ability to withstand brutal ecological conditions
1.1
Significance of Wireless Sensor Network
Remote Sensor Network (WSN) alludes to a gathering of spatially scattered and devoted sensors for checking and recording the physical states of the earth and sorting out the gathered information at a focal area.
Data Fusion and Dynamic Inference of Network Information
Integration of Sensor Networks and Web-Based Services
Location and Time Services
© 2019, IRJET | Impact Factor value: 7.211 | ISO 9001:2008 Certified Journal
| Page 365
1.2 Architecture of Wireless Sensor Network
A sensor hub in a remote sensor organize that is equipped for playing out some handling, gathering tangible data and speaking with other associated hubs in the system.
1.3 Applications of Wireless Sensor Networks
A portion of the uses of WSNs are portrayed as pursues,
a) Area checking
Region checking is a typical use of WSNs. In region checking, the WSN is conveyed over a district where some wonder is to be observed.
A military model is the utilization of sensors identifies adversary interruption; a non military personnel precedent is the geo-fencing of gas or oil pipelines.
b)Environmental/Earth checking
The term Environmental Sensor Networks has advanced to cover numerous uses of WSNs to earth science inquire about. This incorporates detecting volcanoes, seas, icy masses, timberlands, and so on.
c)Air Quality observing
The level of contamination noticeable all around must be estimated every now and again so as to defend individuals and nature from any sort of harms because of air contamination. In hazardous environment, ongoing checking of destructive gases is a concerning procedure in light of the fact that the climate can change with extreme outcomes in a quick way.
2. RELATED WORK
The previous couple of years have seen expanded enthusiasm for the potential utilization of remote sensor systems (WSNs) in applications, for example, fiasco the board, battle field observation, fringe insurance and security reconnaissance. Sensors in these applications are relied upon to be remotely conveyed in extensive numbers and to work independently in unattended conditions. To help versatility, hubs are frequently assembled into disjoint and for the most part non-covering groups. Abbasi and Younis [23] displayed a scientific categorization and general arrangement of distributed bunching plans. Likewise review
an alternate bunching calculations for WSNs; featuring their destinations, highlights, multifaceted nature, and so on. Likewise look at of these grouping calculations dependent on measurements, for example, union rate, bunch dependability, group covering, area mindfulness and support for hub portability.
Average Communication Distance (ACD)
The ACD is the indication of the suitability of the node to become CH in terms of the node's location centrality. The ACD of a node is calculated by (4.1)
(4.1)
Radio model
The simple first-order radio model used in [14] is utilised. When the transmission distance is more than the threshold distance, freespace model is agreed; otherwise, multipath model is used as in (4.2) and (4.3). Therefore, necessary energy to transmit a k bit data to a distance d is
(4.2)
The energy to receive a k bit data is (4.3)
where d0 can be calculated using (4.4)
(4.4)
Step 1: The nodes identify their physical location themselves.
Step 2: The BS broadcasts a HELLO message to all the nodes in the network. The nodes identify the distance from them to BS based on the RSSI.
© 2019, IRJET | Impact Factor value: 7.211 | ISO 9001:2008 Certified Journal
| Page 366
3. PROPOSED WORK
The ultimate aim of this work is to develop a clustering algorithm with multi-hop routing which produces an energy-efficient network for gathering the data over a prolonged period of time. As the sensor nodes are energy constrained, the reduction of the overall energy consumption of the network is essential. Moreover, the workload should be shared among the nodes evenly to ensure the possibility of the early death of a node due to the overburden. Then, the algorithm should have good compliance to achieve good scalability when more nodes or clusters are added to the network and/or the deployment area is enlarged. Finally, a faster response is very important as well to reduce the delay in operation. Efficient clustering is done using the following parameters.
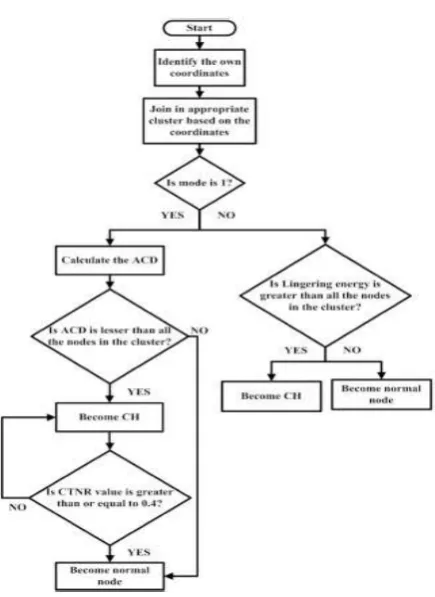
[image:3.595.46.264.305.604.2]4. BAT OPTIMIZATION
Figure 4.1 Node level CH selection process
Optimum selection of CH to normal ratio (CTNR)
The CTNR is varied from 0 to 1 to identify the optimal value of CTNR. The algorithm works as a purely lingering energy-based one when the CTNR is set to 0. On the other hand, when the CTNR is set as 1, the algorithm works as a static clustering algorithm. Although the CUDP is good in scenes 1 and 3 when CTNR is <0.4, the simulation time is more because of high control overhead. Thus, to get a better CUDP and less simulation time, the CTNR value is set as 0.4.
(4.5)
The lower-level CH receives the data from the normal nodes in the cluster and do the data aggregation process. The lower-level CHs send the data to the upper-level
CHs. Thus the total energy required is
The higher-level CH receives the data from the normal nodes in the cluster. Also, it receives the information from the lower-level CH, does the data aggregation process, and sends the data to BS. The higher-layer CHs act as the relay nodes for the lower-layer CHs. The CH in the higher layer thus receives only one aggregated message from the
lower-level CH. Thus, the total energy required is
Bat Optimization (BO) with the Differential
Evolution (DE)
A novel hybrid Bat Optimization (BO) with the Differential Evolution (DE) strategy using the feasibility-based rules, namely DEBO is proposed to deal with the constrained optimization problems. The sound interrupt induced by other things are inevitable for the bats which rely on the echolocation to detect and localize the things. Through integration of the DE strategy with BO, the insects’ interferences for the bats can be effectively mimicked by DEBO. Generally the bats swarm’ mean velocity is simulated as the other bats’ effects on each bat.
Movement of Virtual Bats: After a random initialization, the new positions (solutions)and velocities at time step t are updated as follows:
(4.7)
(4.8)
(4.9)
Where ,-is a random vector drawn from a uniform distribution. is the current global best solution. Initially, each bat is randomly assigned with a frequency in
[ ].
(4.6)
© 2019, IRJET | Impact Factor value: 7.211 | ISO 9001:2008 Certified Journal
| Page 367
(4.10)
Loudness and Pulse Emission
The loudness and emission rates decrease and increase respectively, only if the new solutions are updated, which means that these bats are moving towards their prey. These can be formulated as follows.
If (rand(0,1)< (4.11)
(4.12)
(4.13)
The situation will be improved. Compared with , the new location (solution) can be closer to the optimal solution than , when we use the equations (4.7), (4.14)and (4.9) to update the new location (solution).
(4.14)
5. SIMULATION RESULTS
The numerical simulation results listed in Table 5.1 and it shows the effect of CTNR and simulation time for the different scenarios.
Figure 5.1. Simulation model with clustering for
existing algorithm
[image:4.595.339.527.175.297.2]Figure 5.2. Simulation model with clustering for
proposed algorithm
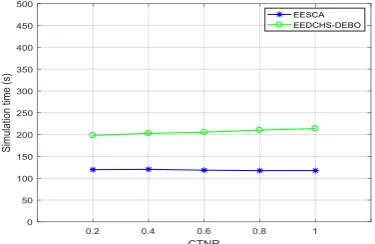
Figure 5.3. CTNR in simulation time
[image:4.595.342.528.379.513.2]Figure 5.3 is obtained from the numerical simulation running time between the proposed EEDCHS-DEBO and existing EESCA algorithm listed in Table 5. 2 .From the results it shows the effect of CTNR in simulation time
Figure 5.4. CTNR in energy usage
[image:4.595.79.244.465.585.2]Figure 5.4 is obtained from the energy usage between the proposed EEDCHS-DEBO and existing EESCA algorithm listed in Table 5. 2
Figure 5.5. CTNR in Packet Delivery Ratio (PDR)
[image:4.595.345.516.603.738.2]© 2019, IRJET | Impact Factor value: 7.211 | ISO 9001:2008 Certified Journal
| Page 368
Figure 5.6. CTNR in Packet Loss Ratio (PLR)
Figure 5.6 is obtained from the Packet Loss Ratio (PLR) between the proposed EEDCHS-DEBO and existing EESCA algorithm listed in Table 5. 2
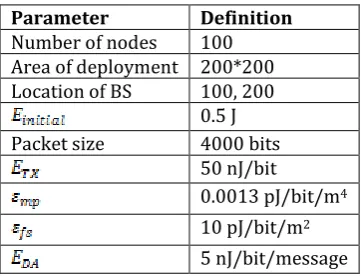
Table 5.1. Simulation parameters
Table 5.2. Simulation results vs. methods
CNTR Energy (J) Simulation time (Seconds) Packet Delivery Ratio (PDR) Packet Loss Ratio (PLR) EESCA
EEDCHS-DEBO EESCA EEDCHS-DEBO EESCA EEDCHS-DEBO EESCA EEDCHS-DEBO
0.2 153.78 77.55 119.65 198.25 0.23 0.62 0.77 0.38
0.4 167.53 98.08 120.39 202.71 0.25 0.54 0.75 0.46
0.6 161.86 103.91 118.38 205.31 0.23 0.51 0.77 0.48
0.8 167.47 99.280 117.45 210.29 0.19 0.535 0.81 0.46
1.0 168.76 84.0367 117.5 213.70 0.20 0.58 0.8 0.42
6.
CONCLUSION
In this paper, the non straight programming development for bunching issue in WSN is depicted. At that point a vitality effective grouping plan for WSN with PSO approach is displayed. In the introduced calculation, the vitality utilization of CHs is altogether adjusted to enhance the system lifetime. The introduced calculation depends on determination of effective molecule encoding strategy and wellness work induction. We have completed careful reproduction. Besides, the outcomes are assessed with existing calculations to be specific LEACH, HEED. Recreation results unmistakably expresses that proposed calculation exceeds expectations the current calculations.
ACKNOWLEDGEMENT
In this work, a simple and effective clustering algorithm called Energy efficient dynamic cluster head selection with differential evolution and bat optimization algorithm (EEDCHS-DEBO) is proposed for the environmental monitoring fields.
REFERENCES
[1] Jamal N. Al-Karaki, Ahmed E Kamal, (2004), "Routing Techniques in Wireless Sensor Network: A Survey", IEEE Wireless Communication.
[2] I.F. Akyildiz, W. Su, Y. Sankarasubramaniam, an d E. Cayirci, (2002), "A Survey on Sensor Network", IEEE Communication Magazine, vol. 40, no. 8, pp. 102 – 116. EEEE
[3] N. Bulusu, J. Heidemann, and D. Estrin, (2000), “GPS-less Low Cost Out Door Localization for Very Small Devices,” Tech. rep. 00729, Comp. Sci. Dept., USC, Vol. 7(5), pp. 28 – 34. EEEE
[4] Ettus, M., (1998), "System Capacity, Latency, a nd power consumption in multihop-routed SSCDMA wireless networks", Proc. of RAWCON'98, pp. 55-58. [5] Rodoplu, V. and T. H. Meng, (1999), "Minimum
en ergy Mobile wireless networks", IEEE JSAC, vol.17, no.8, pp. 1333-1344.
Parameter Definition Number of nodes 100 Area of deployment 200*200 Location of BS 100, 200
0.5 J Packet size 4000 bits
50 nJ/bit
© 2019, IRJET | Impact Factor value: 7.211 | ISO 9001:2008 Certified Journal
| Page 369
[6] Bhardwaj, M. and A. Chandrakasan, (2002), "Bounding the lifetime of sensor networks via optimal role, assignments", Proc. of the INFOCOM'02, pp. 1587-1596.
[7] Chang. J H., Tassiulas, L., (2000), "Energy conserving routing in wireless ad-hoc networks", INFOCOM, Nineteenth Annual Joint Conference of the IEEE Computer and Communications Societies Proceedings, IEEE , vol.1, no., pp.22-31.
[8] Chang, J. H. and L. Tassiulas, (2004), "Maximum lifetime routing in wireless sensor networks", IEEE/ACM Trans. on Networking, vol.12, no.4, pp. 609-619.
[9] Zussman, G. and A. Segall, (2003), "Energy efficient routing in Ad Hoc disaster recovery networks", Proc. of the INFOCOM'03, pp.682-691.
[10] Aslan, Y.E., Korpeoglu, I., Ulusoy, Ö.: ‘A framework for use of wireless sensor networks in forest fire detection and monitoring’, Comput. Environ.Urban Syst., 2012, 36, (6), pp. 614–625 [11] Lara, R., Bentez, D., Caamaño, A., et al.: ‘On