Vol.7 (2017) No. 5
ISSN: 2088-5334
Macro-Factor Affecting the Electricity Load Demand in Power System
Mohammad Hanif Jifri
#, Elia Erwani Hassan
#, Nor Hamizah Miswan
*, Nazrulazhar Bahaman
%#
Energy and Power Systems Group, Faculty of Electrical Engineering, Universiti Teknikal Malaysia Melaka (UTeM), 76100 Durian Tunggal, Melaka, Malaysia
E-mail: [email protected], [email protected]
*
Applied Mathematics Research Group, Advance Manufacturing Centre, Faculty of Engineering Technology, Universiti Teknikal Malaysia Melaka (UTeM), 76100 Durian Tunggal, Melaka, Malaysia
E-mail:[email protected]
%
InsForNet Research Group, Faculty of Information and Communication Technology, University Teknikal Malaysia Melaka (UTeM), 76100 Durian Tunggal, Melaka, Malaysia.
E-mail: [email protected]
Abstract—As a developing country, Malaysia is expected an increment on their electricity consumption align with growing of
economy, population as well as industrial demands. For that reason, this paper brings an analysis that considered some macro factors identified as geographical parameters, meteorological parameters, and economic parameters which believed will effect the demand in electricity over the country. However, the case study for this research is focusing the demands in the area named Johor Bahru and Skudai due to the higher electricity consumption in Johor, Malaysia. The correlation coefficient is introduced as a tool to measure the significant factors influenced the demands. From the result obtained, it shown that Gross Domestic Product (GDP), population and maximum temperature were affected the electrical load demand pattern based on their Pearson Correlations. As an advantages this finding will help others researcher and electrical utilities in forecasting their future demands.
Keywords— electric load demand; macro-factor; correlation coefficient; linear regression
I. INTRODUCTION
Malaysia is declared as the third largest economy and energy consumer in Southeast Asia. Furthermore, the electricity consumption in this country is estimated to grow about 4% per year in average and will reach until 400T Wh in year 2040 [1]. It is proved when the total installed generation capacity at the end of the year 2013 was about 29,748 MW which is 2.1 percent rose from 29,143MW in 2012. In other meaning, the electricity enlarged 5.8 percent at that as referred to only 123,076 GWh from the previous year. Besides that, the peak of Peninsular Malaysia was recorded at 16,562 MW in the record quarter of the year [2]. Whereas, the economic growth also making the rises in electricity load demands in daily used [4].
According to P. Ozoh, electricity is a key energy source and a very important element for the economic development especially for developing[5]. Moreover, the results obtained from the study showed that increased levels of electricity consumption were also due to the major elements of
business and public policy implications [6]. Numerous studies have attempted to explain about the electricity consumption among economic growth in developing countries. Richard and Jonathan [7] found that the relationship between electricity consumption and gross domestic product (GDP) in the United States had started in the early 1970s up to 2013 has strongly correlated with the stable linear relationship between gross domestic product (GDP) and electricity consumption over long periods of time. Electricity consumption growth has been stemming from the increase in economic activity. Later, Jari Kaivo [8] extended their study conducts trend in the global economy against electricity consumption trends in four countries which are China, United States, European Union and in the Euro area that cover from the year of 1961s to 2011. Researchers revealed that, the economic activity increased has strongly dependent on the electric power consumption (KWh per capita).
The effect of climate such as temperature on the electricity consumption was carried out by many researchers.
Enrica [9] carried out a study of the relationship between temperature and residential electricity load demand. The result shows that, the seasonal climate change in a country with four seasons, had affected their patterns of residential electricity load demand for cooling and heating. Moreover, the climate change in Birmingham, UK will potentially be affected for a long-term electricity consumption. The result reveals that, higher temperature increases the consumption via refrigeration and air-conditioning, whereas low temperature increase consumption for heating [10]. Later on, Rolf Golombek [11] extended his analysis and found that summer and winter have a big impact on electricity consumption in the Nordic countries of Western Europe. Recently, Kyoung [12] continued a study to investigate the residential air conditioning with peak load demand. In 2012, the electricity demands of the State of California were 43.8% for residential and 34.6% for commercial. The result found that, during the summer the electricity consumption was at peak demand and was dominated by air conditioning usage in buildings or residential.
There are a numbers of direct effect of population on electricity load demand. Kumar [13] investigated the modelling and forecasting of energy demand in rural households in Bangladesh. Bangladesh have largest of rural population (70%) in the world, which have contributed to the electricity load demand of the country. The result shows that, population increase contributes to the increase in electricity load demand in Bangladesh. Recently, Erdem [14] extended their study and revealed that population is one of the factors that contribute to increasing load demand. However, studies on population only is not enough to explain the effect in the electricity demand throughout the year.
Besides that, a researcher conducting a study questioned whether rainfall has more influence in increasing electricity consumption. Kiattiporn [15] found that, electricity consumption will be increased if there is 1 mm increase in average monthly rainfall. In view of Nurpilihan [16], it was stated state that, more than (80%) of rainfall occurs during the rainy season which the annual rainfall is more less 2000mm. Later, Suhaila [17] extended her study on analysis and had revealed that rainfall was a challenging work to be predicted with factors associated to rainfall such as temperature, wind speed, and humidity. Another author described electricity demand from the state of Johor [18]. It should be noted that from the above literature review, limited studies are available on the macro-factors affecting the electric load demand in Johor and this has motivated the present study. In order to install generating capacity, several factors need to be considered to prevent wastage of electricity. Therefore, the purpose of this research is to identify the macro-factors affecting the electric load demand in Johor.
According to the statistics provided by the National Energy Balance (2013), it was reported that the total electricity consumption by the industrial sector in Malaysia was about 123,076 GWh in the year 2013. The highest electrical load demand in Malaysia is mainly contributed by a strong demand from the industrial sector. On the other hand, the industrial sector consumer gave the highest impact on electricity in Malaysia, with a percentage of 45.4%,
followed by commercial (32.7%), residential (21.4%), agriculture (0.3%) and transport (0.2%). The industrial sector is the largest electricity consumer among other sectors, and this number will be ever-growing in the future based on the current needs in Malaysia [19]. Renny [20] reported that when the value of the result is near to 1.0, it mean that there is a very strong correlation between the dependent and independent variables.Consequently, this paper intended to analyse the macro-factors affecting electricity load demand in Johor Bahru and the expectations of the residents in terms of the demands using the correlation coefficient method.
II. MATERIAL AND METHOD
In this study, all data for the identified macro factors known as meteorological, geographical and economic affect which presented. This actual data were provided by the Malaysian Department of Meteorology and Malaysian Department of Statistics respectively. The electricity load data were brought from Tenaga Nasional Berhad (TNB) highlighted for two area Skudai and Johor Bahru started from 2005 to 2011. Initially, the pattern load demands that brought from the following Fig. 1 and Fig. 2.
Fig. 1 Electric Load of Skudai station (residential area)
Fig. 2 Electricity load of Pusat Bandar Johor Bahru (city center)
A. Meteorological Factors
The significant meteorological factor which impact the load demand curve were carried out in Fig. 3 and Fig. 4. This graph display the maximum and minimum average temperature for the areas focusing. Example of global warming in Johor is the increasing intensity of forest fires in that area. The increase of climate because of rapid
urbanisation also caused the temperature increase. Furthermore, during the north-eastern monsoon months, there were clear changes in the temperature.
Fig. 3 Maximum Temperature in Johor
Fig. 4 Minimum Temperature in Johor
B. Geographical Factors
Fig.5 shows the level of rainfall in Johor. The rainfalls rose from 2005 to 2006 in this area. However, its decline started from 2006 until 2008 and became heavy in the year 2011 onwards. It is believed that the rise in temperature will immediately affect the global rainfall distribution. In other words, the relationship between global warming will also change the temperature and rainfall phenomena as well. Furthermore, the wind and north-eastern monsoon months will have an impact on the rainfall level.
The graph in Fig. 6 shows that there has been growth in the population of Johor in recent years. Population increase is due to the global changes.
Fig. 5 Rainfall in Johor
Fig. 6 Population in Johor
C. Economic Factors
Fig. 7 shows the growth rate of the GDP in some areas of Johor Baharu. The main reasons for the growth of GDP in Johor are caused by manufacturing activities, supported increment of import and export products, tourism activities, and the rapid opening of new urban outlets. The graph is showing a positive growth starting from 2005 until 2011. Besides that, the GDP showed an increase of population in Johor. An economist in Malaysia stated that the economic development in Johor is one of the best models in southern Malaysia. This is because the Johor government has invested millions of Ringgit Malaysia to develop the Johor region.
Fig. 7 Gross Domestic Product in Johor
D. Correlation Coefficient Basics
All the macro-factors as explained in this section will be analysed in order to determine the most contributing factors affecting the increasing load demand in the power system. Correlation coefficient method is the most appropriate method to determine the relationship between the independent variable, x and dependent variable, y. The independent variable here is the load demand and the dependent variables are all the macro-factors which are maximum temperature, minimum temperature, rainfall, population, and GDP. The correlation coefficient can be defined as r, and the function is to measure the strength of the straight-line between two variables. The correlation coefficient can be negative or positive.
The formula for correlation coefficient is given as follows;
( )( )
( )
[
∑
∑
]
[
∑
( )
∑
]
∑
∑
∑
−
−
−
=
2 2
2 2
y
y
N
x
x
N
y
x
xy
N
r
(1)where
N = the number of pairs of data r = sample correlation coefficient x = independent variable
y = dependent variable
∑
x
= sum of independent data∑
y
= sum of dependent data2
∑
x
= sum of squared independent data∑
2y
= sum of squared dependent datay
x
∑
= sum of the product of independent and dependent dataThe following range points are guidelines for interpreting the correlation coefficient:
1. Zero indicates a no linear relationship
2. The Positive value indicates the positive linear relationship between two variables. If the value of independent variable increases, the value of the dependent variable also increases.
3. The Positive value indicates the negative linear relationship between two variables. If the value of independent variable increases, the value of dependent variable also decreases.
4. Values between 0 and 0.3 or (0 and -0.3) show a weak positive or negative linear relationship. 5. Values between 0.3 and 0.7 or (0.3 and -0.7) show a moderate positive or negative linear relationship. 6. Values between 0.7 and 1.0 or (0.7 and 1.0) show a
strong positive or negative linear relationship.
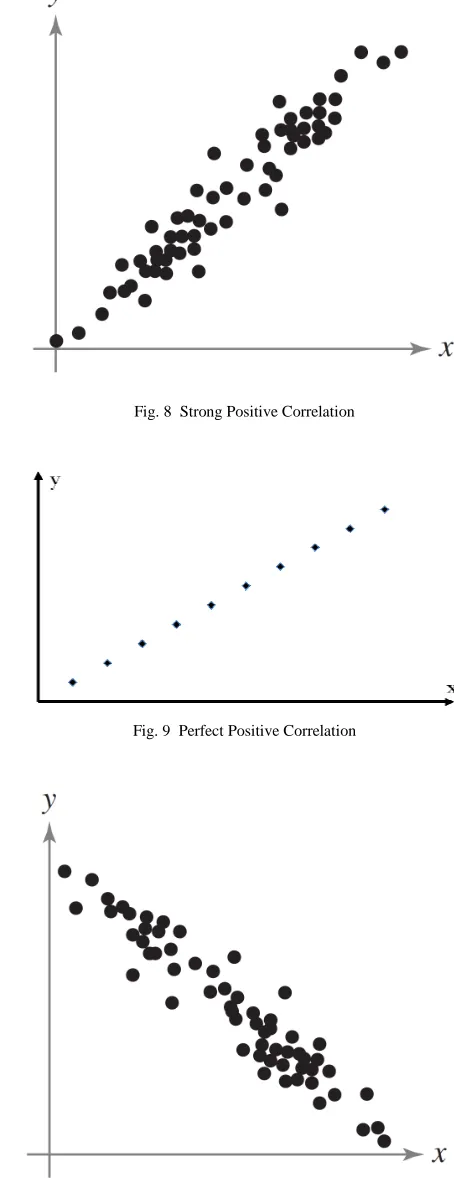
A scatter plot graph can be used as a guideline to determine a straight line (linear) correlation exists between two variables. The scatter plots below show several types of correlation. As shown in Fig. 8 when x increases, y tends to decrease. In a Fig. 10, when x increases, y tends to increase.
Fig. 8 Strong Positive Correlation
Fig. 9 Perfect Positive Correlation
Fig. 10 Strong Negative Correlation
Fig. 11 Perfect Negative Correlation
Fig. 12 No Correlation
Fig. 13 Nonlinear Correlation
III. RESULT AND DISCUSSION
In this study, the research work utilised an 84-month data set from 2005 to 2011 as the input data for analysing the macro factors affecting the electricity load demand in Johor Bahru. The electricity consumption and macro factor data used in the analysis and the result are presented in the table below.
A. Meteorological Factors
The analysis of the overall load demand pattern is based on the maximum temperature as shown in Fig. 14.
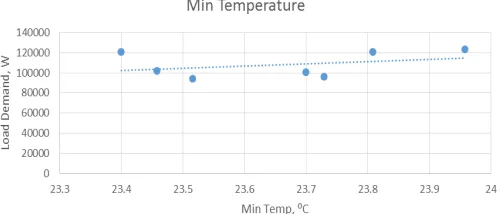
As shown in Fig. 14, the load demand increased slightly with the maximum temperature. According to Fig. 15, the load demand increased marginally with the minimum temperature, even though the temperature fluctuated throughout the year. This is because most government buildings, residential houses, hospitals, factories, and shopping complexes in Johor use air-conditioning systems to reduce the temperature inside the buildings. This study indicates that the air-conditioning systems gave an extra load on the chiller; hence, the chiller consumed more energy to operate. This discussion reflects the findings of other authors as well [19]-[22].
Fig. 14 The relationship between maximum temperatures with load demand
Fig. 15 The relationship between minimum temperatures with load demand
B. Geographical Factors
The results of the correlation analysis are presented in Fig. 16. From the graph in Fig. 16, it can see that the load demand suffers a declining trend when the rainfall rate increases significantly. The findings highlighted that rainfall did not affect the electricity load demand much. Furthermore, the author concluded that the relationship between rainfall and electric demand is linear [22]. The figure below illustrates the correlational analysis between load demand and population.
It can be seen from the graph in Fig. 17 that the load demand significantly increases with the increase in population. This implies that when a country or a region has a large population, electricity consumption also grows. Many researchers have argued that there are several factors related to population and load demand, which are lifestyle, gadget, and electrical appliance usage [13, 23, 24].
Fig. 16 The relationship between rainfalls with load demand
0 50000 100000 150000
25.5 26 26.5 27 27.5 28 28.5 29
Lo
a
d
De
m
a
n
d
,
W
Population (million)
Population
Fig. 17 The relationship between population and load demand
C. Economic Factors
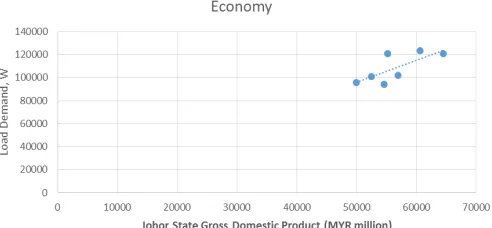
Fig. 18 presents the summarised statistics for load demand and the Johor state’s Gross Domestic Product.
As shown in Fig. 12, the load demand goes up significantly with the Johor state’s Gross Domestic Product. The result indicates that the ever-growing economy influences the manufacturing of products. As a result, energy consumption becomes higher. More recent studies have concluded that electricity consumption is mainly driven by Gross Domestic Product [25]-[30].
Fig. 18 The relationship between economy and load demand
D. Correlation Coefficient of Macro Factor
The correlation coefficient is a measure of the strength of the relationship between two variables. The correlation between the Johor State’s Gross Domestic Product and load demand is 0.740, indicating that as Gross Domestic Product increases, the load demand is also increased. Besides that, the correlation between population and load demand is 0.854, indicating that as population increases, load demand is also increased. Furthermore, the correlation between the maximum temperature and load demand is 0.756, indicating that as the temperature increases, the load demand increases. Nevertheless, the correlation between rainfall and load demand is -0.233, indicating that as the rate of rainfall decreases, the load demand is not affected. Besides that, the correlation between minimum temperature and load demand is 0.339, indicating that as the temperature decreases, load demand is not affected. Table 1 shows that the correlations between dependent variable and independent variable. Dependent variable and independent variable can be determined by using Pearson Correlation. From this table, population, Gross Domestic Product and maximum temperature show strong correlations. This explained that these three macro factors are the major factors affecting load demand.
TABLEI
CORRELATIONS BETWEEN DEPENDENT VARIABLE AND INDEPENDENT
VARIABLE
Macro-factors Load Demand, W Pearson Correlation
Johor State Gross Domestic Product (MYR million)
0.740
Population (million people)
0.854
Rainfall (mm) -0.233
Max Temp, ⁰C 0.756
Min Temp, ⁰C 0.339
IV. CONCLUSIONS
This study was presented to determine the macro factors affecting the electricity load demand. From the results obtained, the most important macro factors in order to forecast the electricity load demand were identified to be population, Gross Domestic Product and maximum temperature of the area in Johor Bahru, Malaysia. Moreover, the relevance of these three macro factors was clearly supported in the previous studies done by earlier researchers. In future work, this finding will provide a reference for other researchers in this field.
ACKNOWLEDGMENT
We wish to thank the Faculty of Electrical Engineering and Universiti Teknikal Malaysia Melaka (UTeM), for the help and support in carrying this research under the grant vote number RAGS/1/2015/TK0/03/B00094.
REFERENCES
[1] D. F. Birol, "Southeast Asia Energy Outlook 2015," Directorate of
Global Energy Economics, International Energy Agency, France,
2015.
[2] S. Tenaga, "Laporan Tahunan Suruhanjaya Tenaga 2012," Minister
of Energy, Green Technology and Water, Putrajaya, Malaysia, 2012.
[3] S. Tenaga, "Laporan Tahunan Suruhanjaya Tenaga 2013," Minister
of Energy, Green Technology and Water, Putrajaya, Malaysia, 2013.
[4] N. F. Napis, M. F. Sulaima, R. M. A. R. A. Arif, A. F. A. Kadir, and M. F. Baharom, "A power distribution network restoration via feeder reconfiguration by using EPSO for losses reduction," Journal of
Theoretical and Applied Information Technology, vol. 79, pp.
346-350, September 2015.
[5] R. Fazeli, M. Ruth, and B. Davidsdottir, "Temperature response functions for residential energy demand – A review of models,"
Urban Climate, vol. 15, pp. 45-59, March 2016.
[6] P.Ozoh, S. Abd-Rahman, J. Labadin, and M. Apperley, "A Comparative Analysis of Techniques for Forecasting Electricity Consumption," International Journal of Computer Applications, vol. 88, February 2014.
[7] R. F. Hirsh and J. G. Koomey, "Electricity Consumption and Economic Growth: A New Relationship with Significant Consequences?," The Electricity Journal, vol. 28, pp. 72-84, November 2015.
[8] J. Kaivo-Oja, J. Vehmas, and J. Luukkanen, "Trend analysis of energy and climate policy environment: Comparative electricity production and consumption benchmark analyses of China, Euro area, European Union, and United States," Renewable and
Sustainable Energy Reviews, vol. 60, pp. 464-474, July 2016.
[9] E. de Cian, E. Lanzi, and R. Roson, "Seasonal temperature variations and energy demand: A panel cointegration analysis for climate change impact assessment," Climatic Change, vol. 116, pp. 805-825, Feb. 2013.
[10] J. A. Azevedo, L. Chapman, and C. L. Muller, "Critique and suggested modifications of the degree days methodology to enable long-term electricity consumption assessments: A case study in Birmingham, UK," Meteorological Applications, vol. 22, pp. 789-796, Oct. 2015.
[11] R. Golombek, S. A. C. Kittelsen, and I. Haddeland, "Climate change: Impacts on electricity markets in Western Europe," Climatic Change, vol. 113, pp. 357-370, July 2012.
[12] K. O. Lee and M. A. Medina, "Using phase change materials for residential air conditioning peak demand reduction and energy conservation in coastal and transitional climates in the State of California," Energy and Buildings, vol. 116, pp. 69-77, March 2016. [13] K. B. Debnath, M. Mourshed, and S. P. K. Chew, "Modelling and
Forecasting Energy Demand in Rural Households of Bangladesh,"
Energy Procedia, vol. 75, pp. 2731-2737, Aug. 2015.
[14] M. E. Günay, "Forecasting annual gross electricity demand by artificial neural networks using predicted values of socio-economic indicators and climatic conditions: Case of Turkey," Energy Policy, vol. 90, pp. 92-101, March 2016.
[15] K. Wangpattarapong, N. Ketjoy, S. Maneewan and W. Rakwichian. “The impacts of climatic and economic factors on residential electricity consumption of Bangkok Metropolis,” Energy and
Buildings, vol. 40, pp. 1419-1425, Nov. 2008.
[16] N. Bafdal. “Rainfall Harvesting as Resources of Self Watering Fertigation System with Various Growing Medias,” International
Journal on Advanced Science Engineering Information Technology,
vol. 6, pp. 787-792, 2016.
[17] S. Zainudin, D. S. Jasim, and A. A. Bakar. “Comparative Analysis of Data Mining Techniques for Malaysian Rainfall Prediction.”
International Journal on Advanced Science Engineering Information Technology, vol. 6, pp. 1148-1153, 2016.
[18] E. Commission, "National Energy Balance 2014," Suruhanjaya
Tenaga (Energy Commission), Putrajaya, Malaysia, 2014.
[19] E. Commission, "National Energy Balance 2013," Suruhanjaya
Tenaga (Energy Commission), Putrajaya, Malaysia, 2013.
[20] R. E. Putri, A. Yahya, N. M. Adam and S. A. Aziz. “Correlation of Moisture Content to Selected Mechanical Properties of Rice Grain Sample,” International Journal on Advanced Science Engineering
Information Technology, vol. 5, pp. 264-267.
[21] T. B. Tuan, A. Z. Yahaya, Y. F. Breesam, R. M. Dan, and M. Z. Zakaria, "Energy analysis for lighting and air conditioning system of an academic building," Jurnal Teknologi, vol. 76, pp. 53-56, June 2015.
[22] R. Hywel, B. T. Tee, M. Y. Arifin, C. F. Tan, C. K. Gan, and C. T. Chong, "ACMV energy analysis for academic building: A case study," in 7th International Conference on Cooling and Heating
Technologies, ICCHT 2014, 2015.
[23] M. Kharseh, M. Al-Khawaja, and F. Hassani, "Comparison between different measures to reduce cooling requirements of residential building in cooling-dominated environment," Energy and Buildings, vol. 88, pp. 409-412, Feb. 2015.
[24] N. Eskin and H. Türkmen, "Analysis of annual heating and cooling energy requirements for office buildings in different climates in Turkey," Energy and Buildings, vol. 40, pp. 763-773, 2008. [25] N. M. Saad, A. F. Omar, M. F. Abas, and M. N. Akla, "GUI based
energy saving controller for lighting and air-conditioning application in lecture hall via power line communication module," ARPN
Journal of Engineering and Applied Sciences, vol. 10, pp.
17472-17478, 2015.
[26] H. Ching-Lai, S. J. Watson, and S. Majithia, "Analyzing the impact of weather variables on monthly electricity demand," Power Systems,
IEEE Transactions on, vol. 20, pp. 2078-2085, Nov. 2005.
[27] Suhono and Sarjiya, "Long-term Electricity Demand Forecasting of Sumatera System Based on Electricity Consumption Intensity and Indonesia Population Projection 2010-2035," Energy Procedia, vol. 68, pp. 455-462, April 2015.
[28] V. Bianco, O. Manca, and S. Nardini, "Linear regression models to forecast electricity consumption in Italy," Energy Sources, Part B: Economics, Planning and Policy, vol. 8, pp. 86-93, Jun. 2013. [29] F. Jamil and E. Ahmad, "The relationship between electricity
consumption, electricity prices and GDP in Pakistan," Energy Policy, vol. 38, pp. 6016-6025, Oct. 2010.
[30] M. Javid and A. Qayyum, "Electricity consumption-GDP nexus in Pakistan: A structural time series analysis," Energy, vol. 64, pp. 811-817, Jan. 2014.
[31] A. K. Kouakou, "Economic growth and electricity consumption in Cote d'Ivoire: Evidence from time series analysis," Energy Policy, vol. 39, pp. 3638-3644, June 2011.
[32] M. Shahbaz and H. H. Lean, "The dynamics of electricity consumption and economic growth: A revisit study of their causality in Pakistan," Energy, vol. 39, pp. 146-153, March 2012.
[33] D. M. Ibrahiem, "Renewable Electricity Consumption, Foreign Direct Investment and Economic Growth in Egypt: An ARDL Approach," Procedia Economics and Finance, vol. 30, pp. 313-323, 2015