Electronic Journal of Plant Breeding, 9 (2 ) : 392-399 (June 2018) ISSN 0975-928X
392 DOI: 10.5958/0975-928X.2018.00049.2
Research Article
Assessment of genetic variability in low land sub1 introgressed rice genotypes
showing tolerance to submergence and stagnant flooding
Rajesh Kumar Kar1, Tapash Kumar Mishra1, Ritu Kumari Pandey2 and Satya Ranjan Das1
1
Department of Plant Breeding and Genetics, College of Agriculture Bhubaneswar, OUAT 2
Department of Nematology, College of Agriculture Bhubaneswar, OUAT E-Mail:[email protected]
(Received:12 May 2016; Revised:25 Apr 2018; Accepted:04 May 2018) Abstract
The present investigation is carried out to establish the nature of relation between grain yield and yield components by partitioning the correlation coefficients between grain yield and its components into direct and indirect effects by using simple correlation and path analysis .By the help of correlation coefficients Selection index were constructed to increase the selection efficiency .A correlation coefficient and path analysis study was conducted in 51 low land Rice with tolerance to submergence and stagnant flooding for ten component characters including grain yield. The results indicated that grain yield was positively correlated with days to flowering, plant height, fertile grain number and fertility percentage indicating the importance of such traits for realization of high yield in rice. The traits like days to 50% flowering exhibited maximum positive direct effect on grain yield followed by plant height, grain yield per plant, fertility percentage and 100-grain weight, thus, indicating the importance of such traits as criteria for selection for realization of higher productivity. Using grain yield as economic criterion, ten selection indices were constructed. On the basis of selection criteria, the promising genotypes selected were IR 85086-SUB 33-3-2-1, IR 88760-SUB 93-3-3-3, Upahar, IR 88250-20-1-1-3, Jagabandhu, IR 88230-60-1-2-2, CR1009 sub 1, IR 87092-26-3-1-3, Savitri, IR 87098-55-2-1, Mahanadi, PSBRc 68, Swarna, Swarna-sub 1, PSBRc 70. evaluation of sub 1 introgressed line in normal condition i.e. how the sub 1 lines are performing without the occurrence of flood. The genotypes like savitri-sub 1, IR 64-sub 1 , PSBRc 18- sub1 , IR 85086-SUB 33-3-2-1, IR 87439-BTN-145-2-1, IR 88228-33-3-5-2, IR 88234-STG 11-1-1-1, IR 88250-20-1-1-3, IR 88764-SUB 30-1-1-2 and IR 88776-SUB 8-1-1-2 had shown high level of submergence tolerance through screening under control conditions.
Key words
Correlation, direct effects, path analysis, Selection index, yield components
Introduction
Rice being the staple food for more than 70 percent Indians and a source of livelihood for 120-150 millions rural households, the requirement of rice production by 2030 would be around 145 million tonnes from the present level of 105 million tonnes to sustain self-sufficiency in rice. More than 60% of rice produced in India comes from Eastern regions of India. Out of the 26.8 mha rice area in eastern India, rainfed lowland rice constitutes 39% of the total rice area. About 8.0 mha of rainfed lowland areas are flood/submergence prone. Rainfed lowlands constitute highly fragile ecosystems, always prone to flash-floods and stagnant flooding submergence stress situations. Many sub1 introgressed lines developed by marker assisted back crossing (MABC) including Swarnasub1 and CR1009Sub1 are valuable addition to the low land rice breeding programme and these genotypes could sustain tolerance to submergence. Since submergence and stagnant flooding stresses are unpredictable, there is a need to develop new varieties with high yield and tolerance to both submergence and stagnant flooding for greater stability of production under the diverse
rainfed lowland ecosystems of eastern Indian states. Under this context, for bringing success in breeding programme to develop varieties, the present investigation was undertaken in lowland rice genotypes derived from sub1 introgressed lines to assess variability and to determine the association of yield and its contributing traits. Selection index was also constructed for increasing selection efficiency to identify superior genotypes to be utilized in further breeding programme. This selection index was constructed by 48 taking sub1 containing genotypes and all other genotypes.
Materials and Methods
Electronic Journal of Plant Breeding, 9 (2 ) : 392-399 (June 2018) ISSN 0975-928X
393 DOI: 10.5958/0975-928X.2018.00049.2
spacing of 20 x 15 cm. The recommended cultural practices were followed. Observations were recordedon the following ten yield and yield contributing characters viz. days to 50% flowering, plant height, panicle length, panicle number, fertile grain number, fertility percentage,100- grain weight, harvest index, grain yield per plant and plot yield. Observations were recorded in respect of ten metric traits on five competitive plants selected randomly from each plot, whereas, characters like plot yield and days to 50% flowering were recorded on plot basis. The data recorded were subjected to statistical analysis of variance technique as proposed by Panse and Sukhatme ,(1961). The phenotypic and genotypic correlation coefficients were calculated using the method given by Johnson et al.(1955) and path coefficient analysis were worked as suggested by Dewey and Lu,(1959). Finally Selection indices were constructed using the methods developed by Smith (1936) based on discriminative function of Fisher (1936).
Results and Discussion
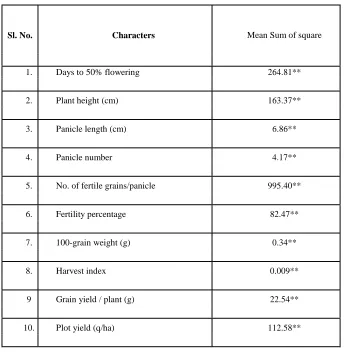
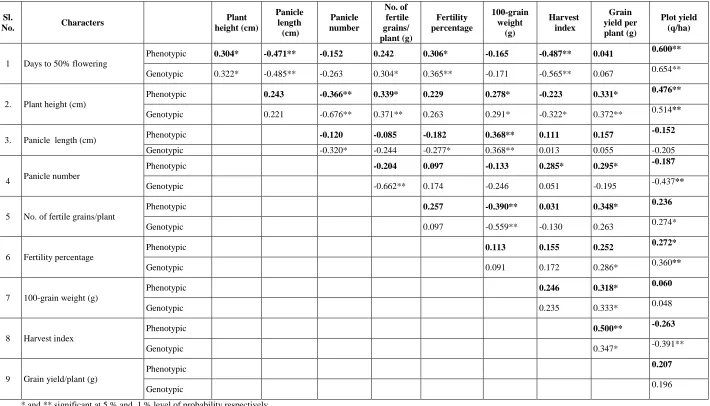
The analysis of variance (Table1) revealed the existence of significant differences among the genotypes for all the traits, indicating the existence of sufficient variation in the material studied. Hence, the data was further subjected to correlation and path coefficient analysis to estimate the association existing between yield and yield contributing components and direct and indirect effects of yield related traits, respectively. Selection based on the detailed knowledge of magnitude and direction of association between yield and its attributes is very important in identifying the key characters, which can be exploited for crop improvement through suitable breeding programme. Phenotypic and genotypic correlations between yield and yield components were computed separately for lowland rice genotypes (Table 2).
The present investigation indicated that the genotypic correlation coefficients in general were higher than phenotypic correlation coefficients It revealed that the observed relationships among the various traits were due to genetic causes. This is in accordance with the findings of Babu et al. (2012), Basavaraja et al. (2013), Rao et al. (2014) and Savitha and UshaKumari (2015). Grain yield was positively correlated with days to flowering, plant height and fertility percentage both at genotypic and phenotypic levels where as the fertile grain number was positively associated with yield only at genotypic level indicating the importance of such component traits for realization of high yield in rice. These
results are in accordance with Aditya and Bhartiya,(2013), Basavaraja et al. (2013), Haque et al.(2014), Rai et al.(2014), Pradhan et al.( 2015) and Savitha and Usha Kumari,(2015). Panicle number and harvest index exhibited negative association with grain yield only at genotypic level but characters like fertile grain number and fertility percentage show positive association with grain yield. Therefore, it is concluded that the superior performance of promising lines from the present set of material might have been resulted due to superior expression of component traits like grain number with improved fertility rather than panicle number and harvest index.
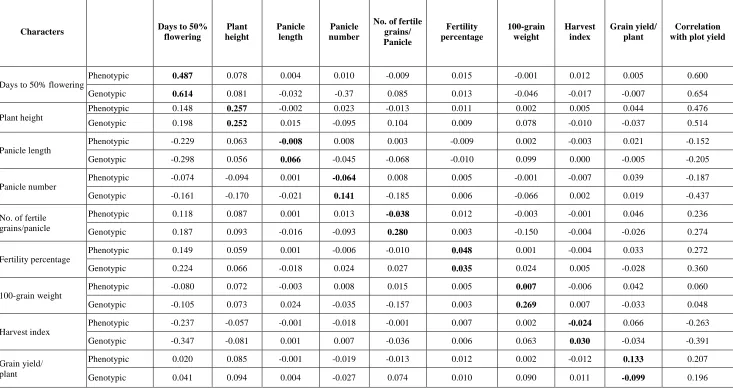
As simple correlation does not provide the true contribution of the characters towards the yield, these genotypic correlations were partitioned into direct and indirect effects through path coefficient analysis. During the present investigation the path analysis was carried out both at phenotypic and genotypic levels and which is presented in (Table 3) and the results obtained there from are discussed. It was observed from the path coefficient analysis that the days to 50% flowering exhibited maximum positive direct effect on grain yield followed by plant height, grain yield per plant, fertility percentage and 100-grain weight, thus, indicating the importance of such traits as criteria for selection in that order for realization of higher productivity. The other traits like panicle length, harvest index, fertile grain number and panicle number exhibited negative direct effect on grain yield. Out of different characters under study fertile grain number, fertility percentage, plant height, days to 50% flowering, grain yield per plant and 100-grain weight exerted greatest indirect effect on yield via other traits.
Thus from the foregoing observations on direct and indirect effects, the traits, like days to 50 % flowering, plant height, fertile grain number, fertility percentage, 100-grain weight and grain yield per plant may be considered as important selection criteria for realization of high and stable yields in rice. These findings in relation to different component traits were in agreement with published report on path analysis by Satheesh kumar and Saravanan ,(2012),Vanisree et al.(2013), Basavaraja
et al.(2013),Ganapati et al.(2014), Jambhulkar et
al.(2014) , Pradhan et al.(2015) and Senapati and
Kumar,(2015).
Electronic Journal of Plant Breeding, 9 (2 ) : 392-399 (June 2018) ISSN 0975-928X
394 DOI: 10.5958/0975-928X.2018.00049.2
several workers in different crop plants have emphasized the importance of indirect selection for yield through the use of component traits governed by genes with additive effect and with strong correlation on grain yield. During the present investigation selection indices were constructed with grain yield as the economic criterion and other yield attributing characters for the construction of ten character indices. The ten character index including all the ten traits was used for the selection of genotypes.
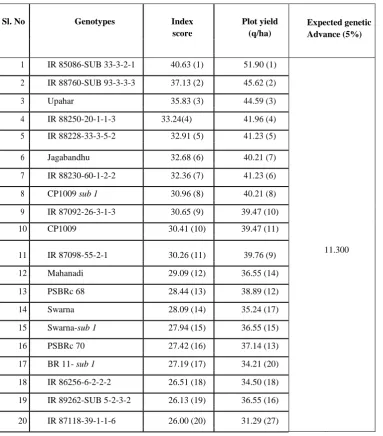
The predicted genetic advance from different indices at 5% selection intensity ranged from 11.076 q/ha in index 1 to 11.300 q/ha in index 10. Thus in terms of predicted genetic advance, the results of the present study brought out superiority of ten character index over direct selection on yield per se. This is in general agreement with the findings of Bastia et
al.(2008), Sabouri et al.(2010), Singh et al.(2013)
and Alam et al.(2014) .
The plot yield and the index score of promising genotypes namely IR 85086-SUB 33-3-2-1, IR 88760-SUB 93-3-3-3, Upahar, IR 88250-20-1-1-3, Jagabandhu, IR 88230-60-1-2-2, Savitri- sub 1, IR 87092-26-3-1-3, Savitri, IR 87098-55-2-1, Mahanad i, PSBRc 68, Swarna, Swarna- sub 1, PSBRc 70, BR 11-Sub 1, IR 86256-6-2-2-2, IR 89262-SUB 5-2-3-2, IR 87118-39-1-1-6 are presented in (Table 4). It was interesting to note that the relative rankings of varieties selected on the basis of per se performance and index score differed indicating the importance of selection index over direct selection on grain yield. The promising genotypes occupying better ranking in the ten character index were selected for their future use.
Most of the published works on selection indices based on index scores reflect the genotypic worth of a particular culture and the relative efficiency has been assessed in terms of genetic advance. However, the validity of such expectations in selecting different genotypes on the basis of different selection indices is often questioned as it varies due to difference in the composition of material, selection of characters for the construction of indices and the experimental precision associated with yield measurement. Therefore, it becomes imperative to study the relative efficiency of different selection criteria and to test the validity of expected superiority of selection indices over direct selection by testing the promising genotypes through appropriate field trials.
During present investigation the results indicated that grain yield was positively correlated with days to
flowering, plant height, fertile grain number and fertility percentage indicating the importance of such component traits as selection criteria for realization of high yield in rice. The traits like days to 50% flowering exhibited maximum positive direct effect on grain yield followed by plant height, grain yield per plant, fertility percentage and 100-grain weight. Thus they may be considered as important selection criteria for realization of high and stable yields in rice. Using grain yield as economic criterion, ten selection indices were constructed. On the basis of selection criteria, the promising genotypes selected were IR 85086-SUB 33-3-2-1, IR 88760-SUB 93-3-3-3, Upahar, IR 88250-20-1-1-3, Jagabandhu, IR 88230-60-1-2-2, Savitri-sub1, IR 87092-26-3-1-3, Savitri, IR 87098-55-2-1, Mahanadi, PSBRc 68, Swarna, Swarnasub1, PSBRc70. It was interesting to note that the relative rankings of varieties selected on the basis of per se performance and index score differed indicating the importance of selection index over direct selection on grain yield.
References
Aditya, J . P. and A. Bhartiya .2013. Genetic variability, correlation and path analysis for quantitative characters in rainfed upland rice of Uttarakhand hills .Journal of Rice Research .6(2):24-34.
Alam, M.S. ,M.M Islam ,L. Hassan ,S.N. Begum and R.Gupta .2014 .Study of Correlation, Magnitude of Genetic Diversity & Selection Indices in Popular Rice (Oryza sativa L.) Landraces of Bangladesh .International Journal of Innovation and Applied Studies .8(3):1329-1338 .
Babu, V.R.,K. Shreya ,K.S, Dangi ,G.Usharani , P.Nagesh .2012.Genetic variability studies for qualitative and quantitative traits in popular rice (Oryza sativa L.) hybrids of India.International Journal of Scientific and Research Publications.2 (6):1-5.
Basavaraja, T.,M. Asif ,S.K. Mallikarjun and S. Gangaprasad .2013. Correlation and path analysis of yield and yield attributes in local rice cultivars (Oryza sativa L.).Asian Journal of Bio Science. 8 (1): 36-38.
Bastia ,D ,T.K. Mishra ,S.R. Das.2008.Genetic variability and selection indices forgrain yield in upland rice .Oryza .45(1):72-75
Electronic Journal of Plant Breeding, 9 (2 ) : 392-399 (June 2018) ISSN 0975-928X
395 DOI: 10.5958/0975-928X.2018.00049.2
problems, Annals of Eugenics, vol. 1, pp.179-188.
Ganapati, R.K. ,M.G.Rasul ,M.A,K. Mian and U. Sarkar . 2014.Genetic variability and character association of T-aman rice (Oryza Sativa
L).International Journal of Plant Biology & Research.2(2):1013.
Haque, S. ,S.K. Pradhan ,A. Anandan ,O.N.Singh .2014.Morphometric diversity studies in rice genotypes for yield and yield attributing characters under drought .The International Journal of Science & Technoledge.2(8) :139-142.
Jambhulkar , N. and L. Bose .2014. Genetic variability and association of yield attributing traits with grain yield in upland rice .Genetika.46(3):831-838.
Johnson ,H.W, H.F. Robinson and R.E. Comstock .1955. Estimation of genetic and environmental variability in soybean. Agronomy Journal. 47: 314-318.
Panse V.G. and P.V. Sukhatme .1961. Statistical methods for agricultural workers. 2nd Edition ICAR, New Delhi, pp, 361.
Pradhan, B.,T.K. Mishra and S.R. Das .2015. Genetic Basis of yield variations in lowland rice. International Journal of Sciences: Basic and Applied Research.19(2):306-318.
Rai ,S.K.,B.G. Suresh ,P.K. Rai ,G.R. Lavanya , R.Kumar , Sandhya .2014. Genetic variability, correlation and Path coefficient studies for grain yield and other yield attributing traits in rice (Oryza Sativa L.).International Journal of Life Sciences Research.2(4): 229-234.
Rao ,V. T.,Y.Chandramohan ,D.Bhadru ,Bharathi and V. Venkanna .2014. Genetic variability and association analysis in rice .International Journal of Applied Biology and Pharmaceutical Technology.5(2):63-65.
Sabouri H ,A. Biabani ,M. Fazlalipour ,A. Sabouri .2010. Determination of best selection indices for facilitating selection in rice .Journal of agricultural sciences and natural resources .17(4):1-25.
Satheesh , P.K. and K.Saravanan .2012.Genetic Variability, Correlation and Path analysis in rice (Oryza sativa L).International Journal of Current Research .4(9):82-85.
Savitha , P. & Ushakumari .2015.Genetic performance of medicinal landraces and improved cultivars for grain and nutritional quality traits in rice .Oryza.51(1):6-11.
Senapati , B.K. & A. Kumar .2015.Genetic assessment of some phenotypic variants of rice (Oryza sativa
L.) for some quantative characters under the Gangatic plains of West Bengal .African Journal of Biotechnology .14(3):187-201.
Singh, C. M.,G.K. Suresh ,B. Kumar B , S.Mehandi .2013. Analysis of Quantitative Variation and Selection criteria for yield improvement in exotic germplasm of upland rice (Oryza sativa L.). The Bioscan.8(2): 485-
Smith,H.F.1936.A discriminant function for plant selection. Annals of Eugenics. vol. 1, pp. 240-250.
Electronic Journal of Plant Breeding, 9 (2 ) : 392-399 (June 2018) ISSN 0975-928X
396 DOI: 10.5958/0975-928X.2018.00049.2
Table 1. Analysis of variance for yield and yield components in lowland rice
Sl. No. Characters Mean Sum of square
1. Days to 50% flowering 264.81**
2. Plant height (cm) 163.37**
3. Panicle length (cm) 6.86**
4. Panicle number 4.17**
5. No. of fertile grains/panicle 995.40**
6. Fertility percentage 82.47**
7. 100-grain weight (g) 0.34**
8. Harvest index 0.009**
9 Grain yield / plant (g) 22.54**
10. Plot yield (q/ha) 112.58**
Electronic Journal of Plant Breeding, 9 (2 ) : 392-399 (June 2018) ISSN 0975-928X
397 DOI: 10.5958/0975-928X.2018.00049.2
Table 2. Phenotypic and genotypic correlation coefficients among ten characters in lowland rice
Sl.
No. Characters
Plant height (cm)
Panicle length
(cm)
Panicle number
No. of fertile grains/ plant (g)
Fertility percentage
100-grain weight
(g)
Harvest index
Grain yield per plant (g)
Plot yield (q/ha)
1 Days to 50% flowering
Phenotypic 0.304* -0.471** -0.152 0.242 0.306* -0.165 -0.487** 0.041 0.600**
Genotypic 0.322* -0.485** -0.263 0.304* 0.365** -0.171 -0.565** 0.067 0.654**
2. Plant height (cm)
Phenotypic 0.243 -0.366** 0.339* 0.229 0.278* -0.223 0.331* 0.476**
Genotypic 0.221 -0.676** 0.371** 0.263 0.291* -0.322* 0.372** 0.514**
3. Panicle length (cm) Phenotypic -0.120 -0.085 -0.182 0.368** 0.111 0.157
-0.152
Genotypic -0.320* -0.244 -0.277* 0.368** 0.013 0.055 -0.205
4 Panicle number
Phenotypic -0.204 0.097 -0.133 0.285* 0.295* -0.187
Genotypic -0.662** 0.174 -0.246 0.051 -0.195 -0.437**
5 No. of fertile grains/plant
Phenotypic 0.257 -0.390** 0.031 0.348* 0.236
Genotypic 0.097 -0.559** -0.130 0.263 0.274*
6 Fertility percentage
Phenotypic 0.113 0.155 0.252 0.272*
Genotypic 0.091 0.172 0.286* 0.360**
7 100-grain weight (g)
Phenotypic 0.246 0.318* 0.060
Genotypic 0.235 0.333* 0.048
8 Harvest index
Phenotypic 0.500** -0.263
Genotypic 0.347* -0.391**
9 Grain yield/plant (g)
Phenotypic 0.207
Genotypic 0.196
Electronic Journal of Plant Breeding, 9 (2 ) : 392-399 (June 2018) ISSN 0975-928X
398 DOI: 10.5958/0975-928X.2018.00049.2
Table 3. Path analysis of direct (diagonal) and indirect effects of various traits on plot yield
Characters Days to 50%
flowering
Plant height
Panicle length
Panicle number
No. of fertile grains/ Panicle
Fertility percentage
100-grain weight
Harvest index
Grain yield/ plant
Correlation with plot yield
Days to 50% flowering
Phenotypic 0.487 0.078 0.004 0.010 -0.009 0.015 -0.001 0.012 0.005 0.600
Genotypic 0.614 0.081 -0.032 -0.37 0.085 0.013 -0.046 -0.017 -0.007 0.654
Plant height
Phenotypic 0.148 0.257 -0.002 0.023 -0.013 0.011 0.002 0.005 0.044 0.476
Genotypic 0.198 0.252 0.015 -0.095 0.104 0.009 0.078 -0.010 -0.037 0.514
Panicle length
Phenotypic -0.229 0.063 -0.008 0.008 0.003 -0.009 0.002 -0.003 0.021 -0.152
Genotypic -0.298 0.056 0.066 -0.045 -0.068 -0.010 0.099 0.000 -0.005 -0.205
Panicle number
Phenotypic -0.074 -0.094 0.001 -0.064 0.008 0.005 -0.001 -0.007 0.039 -0.187
Genotypic -0.161 -0.170 -0.021 0.141 -0.185 0.006 -0.066 0.002 0.019 -0.437
No. of fertile grains/panicle
Phenotypic 0.118 0.087 0.001 0.013 -0.038 0.012 -0.003 -0.001 0.046 0.236
Genotypic 0.187 0.093 -0.016 -0.093 0.280 0.003 -0.150 -0.004 -0.026 0.274
Fertility percentage
Phenotypic 0.149 0.059 0.001 -0.006 -0.010 0.048 0.001 -0.004 0.033 0.272
Genotypic 0.224 0.066 -0.018 0.024 0.027 0.035 0.024 0.005 -0.028 0.360
100-grain weight
Phenotypic -0.080 0.072 -0.003 0.008 0.015 0.005 0.007 -0.006 0.042 0.060
Genotypic -0.105 0.073 0.024 -0.035 -0.157 0.003 0.269 0.007 -0.033 0.048
Harvest index
Phenotypic -0.237 -0.057 -0.001 -0.018 -0.001 0.007 0.002 -0.024 0.066 -0.263
Genotypic -0.347 -0.081 0.001 0.007 -0.036 0.006 0.063 0.030 -0.034 -0.391
Grain yield/ plant
Phenotypic 0.020 0.085 -0.001 -0.019 -0.013 0.012 0.002 -0.012 0.133 0.207
Genotypic 0.041 0.094 0.004 -0.027 0.074 0.010 0.090 0.011 -0.099 0.196
Electronic Journal of Plant Breeding, 9 (2 ) : 392-399 (June 2018) ISSN 0975-928X
399 DOI: 10.5958/0975-928X.2018.00049.2
Table 4. Selection of genotypes on the basis of ten character index
Sl. No Genotypes Index
score
Plot yield (q/ha)
Expected genetic Advance (5%)
1 IR 85086-SUB 33-3-2-1 40.63 (1) 51.90 (1)
2 IR 88760-SUB 93-3-3-3 37.13 (2) 45.62 (2)
3 Upahar 35.83 (3) 44.59 (3)
4 IR 88250-20-1-1-3 33.24(4) 41.96 (4)
5 IR 88228-33-3-5-2 32.91 (5) 41.23 (5)
6 Jagabandhu 32.68 (6) 40.21 (7)
7 IR 88230-60-1-2-2 32.36 (7) 41.23 (6)
8 CP1009 sub 1 30.96 (8) 40.21 (8)
9 IR 87092-26-3-1-3 30.65 (9) 39.47 (10)
10 CP1009 30.41 (10) 39.47 (11)
11.300
11 IR 87098-55-2-1 30.26 (11) 39.76 (9)
12 Mahanadi 29.09 (12) 36.55 (14)
13 PSBRc 68 28.44 (13) 38.89 (12)
14 Swarna 28.09 (14) 35.24 (17)
15 Swarna-sub 1 27.94 (15) 36.55 (15)
16 PSBRc 70 27.42 (16) 37.14 (13)
17 BR 11- sub 1 27.19 (17) 34.21 (20)
18 IR 86256-6-2-2-2 26.51 (18) 34.50 (18)
19 IR 89262-SUB 5-2-3-2 26.13 (19) 36.55 (16)