ISSN 0975-928X
Research Note
Genetic diversity, variability and correlation studies of spike characters in
bread wheat under boron deficient soil condition
Buddhadeb Das1
Uttar Banga Krishi Viswavidyalaya, Pundibari, Coochbehar, West Bengal
1Department of Plant Physiology and Breeding, TRA, Tocklai, Jorhat, Assam
*Email: [email protected]
(Received: 10 Mar 2014; Accepted:16 Mar 2014)
Abstract
Experiment was carried out in a randomized complete block with 21 wheat genotypes under boron deficient soil condition. Divergence was studied by multivariate analysis using D2 statistics and the genotypes were grouped into different clusters. Genotypes from clusters II vs III and I vs II may be crossed to obtain more variation in the segregation generations. The range, mean, phenotypic and genotypic co-efficient of variations, heritability, genetic advance and path coefficient were estimated for the characters like, Spike length (cm), Spikelets/ spike, Grains/ spike, Chaffy grains (%), 1000 Grain weight (g), Harvest Index and Yield/ plant (g). The PCV were slightly higher than GCV indicating little influence of environment on the expression of characters under study. Selection for grain yield/ plants and the spike characters such as grains/ spike, chaffy grain (%) and harvest index would be highly effective as these characters exhibited high estimates of heritability and genetic advance. Grain yield/ plant showed significant positive correlation with spike length, number of grains/ spike, 1000 grain weight and harvest index and significant negative correlation with chaffy grain (%) at genotypic and phenotypic levels. The path analysis results showed that spike length, spikelets/ spike, number of grains/ spike, chaffy grain (%), 1000 grain weight and harvest index are the characters which had contributed significantly in increasing the yield/ plant. Hence these characters need to be given importance during selection for improvement of yield under boron deficient soil condition.
Key words: Triticum aestivum, D2 statistics, variability, correlation, path analysis. Wheat cultivation in terai region of West Bengal
has many natural advantages like prolonged winter, bright sunshine hour and high residual soil moisture at initial phase of crop growth. Despite of the natural advantages, this region is characterized by low productivity (Das et al., 2012). The major constraint is the widespread deficiency of micronutrients, particularly boron (B). In some boron-deficient soils, boron concentration is ≤0.27 ppm, which causes severe yield reduction in wheat (Chowdhury et al., 2008). Boron deficiency in soil has been well established cause of grain set failure in wheat and responsible for yield loss by producing chaffy grains (Bodruzzamanet al., 2003). Soils that contain boron ≤1.0 ppm may not supply sufficient boron to support normal plant growth (Reisenaueret al., 1973). Boron deficiency limits reproductive growth more than vegetative growth and different wheat varieties differ in their response to boron deficiency (Jamjod and Rerkasem, 2004). So, yield loss can be prevented by identifying cultivars tolerant or resistant to boron deficiency. Genotypic variation offers a solution to boron deficiency through selection and breeding for the efficient cultivars (Rerkesem and Jamjod, 1997). Genetic resistance is the cheapest and best method to overcome the barriers against floret fertility and helps to sustain productivity more efficiently. Genetic diversity is important for selection to identify superior transgressive segregates (Patro and Ravisankar, 2004). In views of these facts, 21 wheat genotypes were evaluated in this study: i) to determine the magnitude of
variability among the germplasm for yield and its attributes, ii) to determine the grouping pattern of genotypes in different cluster and iii) to identify genetically diverse genotypes for exploitation in a breeding programme.
ISSN 0975-928X
standard statistical procedure Johnson et al. (1955). The methodology proposed by Dewey and Lu (1959) was used to perform the path analysis for grain yield and its components keeping grain yield as resultant variable and its components as causal variables. The statistical software Indostat was used for the statistical analysis.
An efficient crop breeding programme requires genetic diversity in the genotypes involved, to produce high yielding varieties (Murthy and Arunachalam, 1996). The genetic diversity already present in the crop due to prolonged natural and artificial selection (Roy and Panwar, 1993).The analysis of genetic diversity through the cluster analysis using D2 statistics according to Mahalanobis (1936) was carried out with the data that obtained from 21wheat genotypes and they were grouped into three clusters (Table 1) using Touchers method (Rao, 1952). Cluster III consisted of the largest number of genotypes (13), followed by cluster I, with six genotypes and cluster II with two genotypes. Maximum inter-cluster (Table 2) divergence was observed between cluster II and III (712.32) followed by cluster I and II (646.37). The cluster mean values were estimated for various traits (Table 3) and it was observed that cluster II had the highest mean values for all the trait in desired direction followed by cluster I and cluster III. Hence genotypes from clusters II vs III and clusters I vs II may be intercrossed to obtain high variability.
Highest GCV and PCV values were obtained for grain yield/plant (36.09% and 36.37% respectively). Grain yield/ plant, grains /spike, chaffy grain % and harvest index showed high PCV and GCV. All the traits exhibited high heritability estimates (Table 4). However, 1000 grain weight showed moderate heritability estimates. High to moderate values of genetic advance (GA) as percent of mean were recorded for grain yield/ plant, grains/ spike, chaffy grain % and harvest index. Heritability estimates along with genetic advance are more helpful in predicting gain under selection than heritability estimate alone (Sinha et al., 2004).In the present study, grains per spike, chaffy grains %, harvest index and grain yield per plant indicating broader genetic base and wider adaptability thus greater scope for selection in these traits. Ahmadi and Bajelan (2008) and Khan and Naqvi (2011) also reported the presence of high heritability and genetic advance in different yield related attributes in wheat. This association would indicate that additive gene effects are probably more important in the inheritance of these characters.
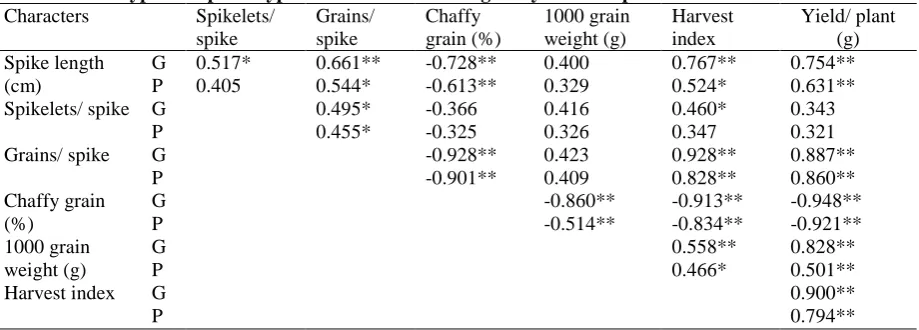
The phenotypic as well as genotypic correlations between different pairs of traits at genotypic and phenotypic levels are presented in Table 5. Spike length had positively significant correlation with
grains/ spike, harvest index and grain yield while number of spikelets/ spike had such relation with number of grains/ spike both at genotypic and phenotypic levels. Number of grains/ spike exhibited significant positive correlation with spike length, number of spikelets/ spike, harvest index and grain yield/ plant and negative significant correlation with chaffy grain (%). However, chaffy grain (%) showed significant and negative association with spike length, grains/ spike, 1000 grain weight, harvest index and grain yield, while 1000-grain weight showed significant positive correlation with harvest index and yield/ plant at genotypic and phenotypic levels. Harvest index showed significant positive correlation with spike length, number of grains/ spike, 1000 grain weight and yield/ plant while it had negative significant correlation with chaffy grain (%). Grain yield/ plant showed significant positive correlation with spike length, number of grains/ spike, 1000 grain weight and harvest index and significant negative correlation with chaffy grain (%) at genotypic and phenotypic levels. Similar findings have been reported by number of workers (Chand et al., 2004; Saleem et al., 2006).
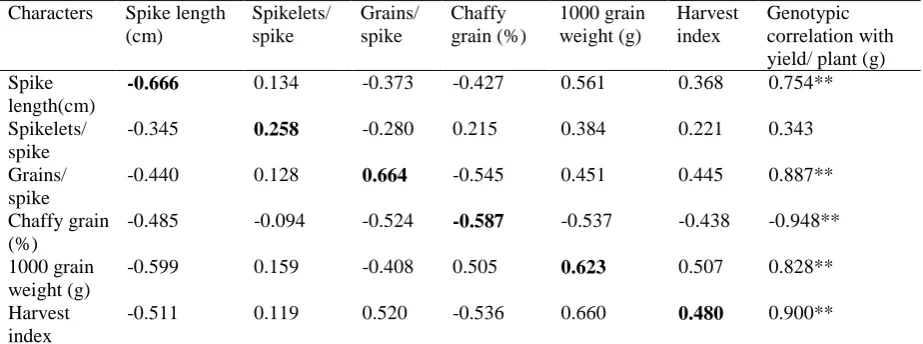
Direct and indirect effects were studied by using path analysis at genotypic level to have a clear interpretation of inter-relationship of various yield-contributing characters with grain yield (Table 6). The residual effect of 0.25 indicates that most of the characters affecting grain yield were included in this study. The path analysis results showed that high positive direct effect for yield was observed for grains/ spike, 1000 grain weight and harvest index. These traits also reorded significant postive correlation with grain yield. Chaffy grain (%) and spike length showed high negative direct effect coupled with negative association with yield /plant. Spikelets /spike had positive and moderate direct effect on grain yield/plant. It was observed that spike length, spikelets/ spike, number of grains/ spike, chaffy grain (%), 1000 grain weight and harvest index are the characters which had contributed significantly in increasing the yield/ plant indicating the significance of these characters for selection for improvement of yield under boron deficient soil condition. Path analysis enables us to direct the direct and indirect influences of component characters (Dabholkar, 1992; Sarkar et al.2005). Therefore, selection based on these characters may bring out desired improvement towards enhancing the yield.
References
Ahmadi, H. and Bajelan, B. 2008.Heritability of Drought Tolerance in Wheat, Am-Euras. J. Agrie. & Environ. Sci., 3 (4): 632-635. Bodruzzaman, M., Siddiqui, M. A., Jahiruddin, M.,
ISSN 0975-928X
Chand, S.P., Roy, S.K., Mondal, G.S., Mahato, P.D., Panda, S., Sarkar, G. and Senapati, B.K. 2004. Genetic variability and Character Association in Rainfed Lowland Aman paddy.Environment and Ecol., 22 (2): 430-434.
Chowdhury, A.K., Singh Gyanendra, Tyagi, B.S., Bhattacharya, P.M. and SinghaRoy, A.K. 2008. Assessment of wheat (Triticumaestivum) cultivars to boron deficiency-induced spike sterility and its impact on grain yield under Terai region of West Bengal. Indian J. Agric. Sci., 78:834-837.
Dabholkar, A. R. 1992. Elements of Biometrical Genetics.Concept Publishing Company, New Delhi. pp: 366-387.
Das, B., Dash, S. K., Das, Saikat and Saha, B. C. 2012. Effect of boron on pollen sterility in wheat (Triticum aestivum L.). Indian J. Genet., 72(3): 367-371
Dewey, D. R. and Lu, K. H. 1959. A correlation and path coefficient analysis of components of crested wheat-grass seed production. Agron. J.,51: 515-518.
Jamjod, S., Niruntrayagul, S., and Rerkasem, B. 2004.Genetic control of boron efficiency in wheat. Euphytica,135: 21-27
Johnson, H.W., Robinson, H.F. and Comstock, R.E. 1955.Estimates of genetic and environmental variability in soyabean. Agron. J., 47: 314-318.
Khan, N. and Naqvi, F.N. 2011.Heritability of Morphological Traits in Bread Wheat Advanced Lines Under Irrigated and Non-Irrigated Conditions. Asian J. Agric. Sci.,3(3): 215-222.
Mahalanobis P. C. 1936. On the generalised distance in statistic. Proc. Natl. Inst. Sci. ,India, 2: 49-55. Murthy, B. R. and Arnnachalam, V. 1996.The nature of
genetic divergence in relation to breeding system in cropplants. Indian J. Genet., 26: 188 - 198.
Patro, K., and Ravisankar. C. 2004. Genetic variability and multivariate analysis in okra (Abelmoschusesculentus (L.)Moench).
Tropical Agric. Res.,16: 99-113.
Rao, C. R. 1952. Advance statistical methods in biometrical research. John Wiley and Sons Inc. New York, p. 383.
Reisenauer, H.M., Walsh, L.M. and Hoeft, R.G. 1973.Testing Soils for Sulphur, Boron, Molybdenum, and Chlorine. In: Soil Testing and Plant Analysis (Eds. Walsh L.M., and Beaton J.D), Soil Science Society of America. Madison, Wisconsin, USA, pp. 173-200. Rerkasem, B.; Jamjod, S. 1997.Genotypic variation in
plant response to low boron and implications for plant breeding. Plant and Soil, 193 :169-180.
Roy, A and Panwar, D. V. S. 1993.Genetic divergence in some rice (OryzasativaL.) genotypes. Ann. Agric. Res., 14: 276 - 281.
Saleem, U., Khaliq, I., Mahamood, T. and Rafique, M. 2006.Phenotypic and Genotypic Correlation Coefficient between yield and Yield Components in Wheat. J. Agric. Res.,44(1): 1-7
Sarkar, K.K., Bhutia, B.K., Senapati, S.K., Roy, S.K., Panda, S., and Mondal, A.B. 2005. Genetic Variability and Relationships Between Grain
Yield and its Component Traits in Rice (Orizasativa L.). Environment and Ecoloogy,23S (Spl-4): 702-706.
ISSN 0975-928X
Table 1. Distribution of wheat genotypes in different clusters Cluster no. Total no. of
genotypes
Name of Genotypes
I 6 RAJ 3765, PBW 343, Sonalika, NW 1014, Halna and HW 2045
II 2 DBW 14 and Schomburgk
III 13 PHR 1025, DBW 26, NW 2036, WH 1022, RAJ 4101, HD 2932, HUW 234, WH 736, PBW 579, HD 2733, HW 3083, UP 2664 and HI I539
Table 2. Average intra and inter cluster D2 values of wheat
Cluster I II III
I 113.05 646.37 145.62
II - 42.48 712.32
III - - 209.48
Table 3. Cluster means for seven characters of wheat Clusters Spike length (cm) Spikelets/
spike
Grains/ spike
Chaffy grain (%)
1000 grain weight (g)
Harvest index
Yield/ plant (g)
I 8.38 18.51 23.22 28.73 38.44 21.25 3.36
II 9.46 18.94 33.98 13.30 41.12 25.54 5.69
III 8.13 18.10 16.52 34.04 36.77 16.93 2.49
Table 4. Estimate of genetic parameters for different spike characters of wheat
Characters Mean Range GCV
(%)
PCV (%)
Heritability (%)
GA GA (in % of mean) Spike length (cm) 8.35±0.17 7.86-9.50 5.82 6.20 88.47 0.94 11.30 Spikelets/ spike 18.45±0.28 16.25-21.72 6.91 7.08 95.00 2.56 13.88 Grains/ spike 20.10±0.71 10.27-34.78 34.97 35.16 98.40 14.40 71.66 Chaffy grains (%) 30.55±0.51 12.03-40.98 23.95 24.01 99.00 15.04 49.21 1000 Grain weight (g) 37.71±1.18 35.30-41.67 4.02 5.16 60.70 2.43 6.45 Harvest Index 18.99±0.85 13.55-26.47 17.57 18.16 93.68 6.65 35.04 Yield/ plant (g) 2.99±0.13 1.36-5.95 36.09 36.37 98.50 2.48 73.79 GCV=Genotypic coefficient of variation; PCV= Phenotypic coefficient of variation; GA= Genetic advance
Table 5. Genotypic and phenotypic correlation between grain yield and spike characters of wheat Characters Spikelets/
spike
Grains/ spike
Chaffy grain (%)
1000 grain weight (g)
Harvest index
Yield/ plant (g) Spike length
(cm)
G 0.517* 0.661** -0.728** 0.400 0.767** 0.754**
P 0.405 0.544* -0.613** 0.329 0.524* 0.631**
Spikelets/ spike G 0.495* -0.366 0.416 0.460* 0.343
P 0.455* -0.325 0.326 0.347 0.321
Grains/ spike G -0.928** 0.423 0.928** 0.887**
P -0.901** 0.409 0.828** 0.860**
Chaffy grain (%)
G -0.860** -0.913** -0.948**
P -0.514** -0.834** -0.921**
1000 grain weight (g)
G 0.558** 0.828**
P 0.466* 0.501**
Harvest index G 0.900**
P 0.794**
ISSN 0975-928X
Table 6. Path coefficient analysis matrix of direct (diagonal) and indirect (off-diagonal) effects of spike characters on grain yield in wheat.
Characters Spike length (cm)
Spikelets/ spike
Grains/ spike
Chaffy grain (%)
1000 grain weight (g)
Harvest index
Genotypic correlation with yield/ plant (g) Spike
length(cm)
-0.666 0.134 -0.373 -0.427 0.561 0.368 0.754**
Spikelets/ spike
-0.345 0.258 -0.280 0.215 0.384 0.221 0.343
Grains/ spike
-0.440 0.128 0.664 -0.545 0.451 0.445 0.887**
Chaffy grain (%)
-0.485 -0.094 -0.524 -0.587 -0.537 -0.438 -0.948**
1000 grain weight (g)
-0.599 0.159 -0.408 0.505 0.623 0.507 0.828**
Harvest index
-0.511 0.119 0.520 -0.536 0.660 0.480 0.900**