Tribology in Industry
www.tribology.rsAn Experimental Investigation of Cu-Ni-Sn Alloy on
Microstructure, Hardness and Wear Parameters
Optimization using DOE
S. Ilangovan
a, J. Sreejith
a, M. Manideep
a,S. Harish
aaDepartment of Mechanical Engineering, Amrita School of Engineering, Coimbatore, Amrita Vishwa Vidyapeetham, Amrita University, India- 641 112.
Keywords: Cu-Ni-Sn alloys
Spinodal decomposition Micro-Hardness Specific Wear Rate Analysis of variance Regression analysis
A B S T R A C T
Copper-Nickel-Tin (Cu-Ni-Sn) spinodally decomposable alloy of composition Cu-7Ni-4Sn was prepared by using sand casting process. The specimens required for microscopic examination, micro-hardness and wear tests were prepared from heat treated (homogenization, solution and ageing) cast rods. The microscopic examination results revealed that the as-cast dendrite structure was disappeared during the homogenization, solution and ageing processes and forms grains of various sizes with respect to ageing time. The hardness of the alloy was increased from 206 HV at solution treated condition to 235 HV at four hours of ageing. By using pin-on-disc wear tester in dry sliding condition an adhesive wear test was conducted as per L9 orthogonal array by taking parameters of applied load, sliding speed and ageing time. An optimum level of parameter for each case was determined through S/N ratio investigation by considering "smaller-the-better". From this investigation, it was found that the parameter ageing time was the dominant as compared to other two parameters. The significant parameter that affect the response was indicated by the results obtained from ANOVA and these results were agreed with S/N analysis. The developed linear regression equation was validated through confirmation experiments. The wear mechanism was observed on worn out surfaces by selecting appropriate specimens considering applied load and sliding speed for both normal and optimum parameter specimens using scanning electron microscope (SEM).
© 2018 Published by Faculty of Engineering
Corresponding author: S. Ilangovan
Department of Mechanical Engineering, Amrita School of Engineering, Coimbatore, Amrita Vishwa Vidyapeetham, Amrita University, India.
E-mail: [email protected]
1. INTRODUCTION
The applications ingeneral, automotive, aircrafts and machine tools industries, copper and its alloys are largely used as a material for bearings [1]. By using various known techniques, the strength of
these alloys can be improved. They are: (i) grain size refinement, (ii) strain hardening, (iii) solid solution hardening, (iv) quench hardening, (v) dispersion hardening and, (vi) precipitation & age hardening [2]. Spinodal decomposition is a process through which the strength of some of the
R
ES
EA
R
alloys can be improved. Spinodal decomposition produces a very fine modulated microstructure which was observed in Cu-Ni-Sn alloys [3-6]. A very few studies were conducted on Cu-Ni-Sn alloys with limited alloy compositions and ageing temperature to determine the effect of cold work, Nickel and Tin content etc. [7-10].
Therefore, the use of spinodal alloys in various applications requires mechanical and wear properties data base and their correlation to alloy compositions and heat treatment processes. Further, the effect of parameters used in wear test on wear behaviour of the Cu-Ni-Sn alloys was not analyzed by Taguchi’s design of experiments (DOE) statistically. The regression equation and confirmatory test to check the adequacy of the statistical model also was not done. Hence, by considering the above gap, in this study, casting of Cu-7Ni-4Sn alloy was used to analyze the tribological properties through DOE.
2. FORMULATION OF WORK
Following subdivisions explains the selection of
material, Cu-Ni-Sn alloy preparation
usingCO2sand casting process, heat treatment processes, microstructural examination and micro-hardness test.
2.1 Material Selection Process
Among the non-ferrous materials, Copper-Beryllium (Cu-Be) alloys produces high strength through precipitation and age hardening process. But while processing of Cu-Be alloys, the fumes produced by the alloys are very harmful to human health. Further, the cost of Beryllium is very high as compared to other elements [8-11]. So, in order to overcome the above mentioned problems, Cu-Ni-Sn alloy was selected in the present work. This alloy can replace the Cu-Be alloys in terms of strength (nearly equal) and less cost with no harmful effect [8]. The alloy composition was selected in such a way that it can be spinodally decomposable based on the wt.% of Ni and Sn content (Ni = 2 to 20, Sn = 2 to 8) [12].
2.2 Preparation of Cu-Ni-Sn alloy casting
The required alloy composition of Cu-7Ni-4Sn (wt.%) was prepared by CO2sand mold casting
process. Carbon dioxide molding is a sand casting process that employs a molding mixture of sand and liquid silicate binder. The molding mixture is then hardened by blowing carbon dioxide gas through it. This method offers a great deal of advantages over other forms of sand molding. Wooden patterns were used to make the required cast rods
.
The preheatedgraphite crucible was kept in the muffle type electric furnace along with pure elements of Cu, Ni and Sn in right proportions. The furnace temperature was kept at 1250 °C (obtained from ternary Cu-Ni-Sn phase diagram) and the molten metal was transferred into sand moulds to get the rods of size Ø 16 mm × 50 mm length (17 rods). During the melting process, Argon gas was used to avoid the reaction between molten metal and the atmospheric gases. The composition of the prepared alloy was tested by spectroscopic analysis.
2.3 Heat Treatment Process
The cast rods were subjected to three types of
heat treatment processes such as
homogenization, solution and ageing. Homogenization was performed for 10 hours at 820 °C and slowly cooled in the furnace. Solution was carried out at the same temperature for 1 hour and the rods were very rapidly cooled in water to have super saturated solid solution [1]. Further, these rods (14 nos.) were aged for up to five hours and every one hour one rod was withdrawn from the furnace and cooled. Ageing temperature was used as 350 °C. Inert Nitrogen atmosphere was used for above heat treatment processes and the test specimens were prepared from the above [2].
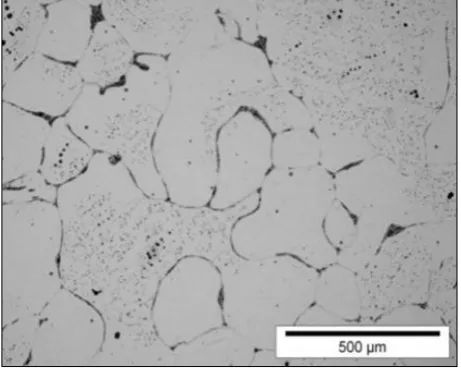
2.4 Microstructural Examination
increases, the grain size also increases.
Spinodal decomposition (modulated
microstructure structure) is not observable through optical microscope [8], hence, it is not shown in these figures.
Fig. 1. Microstructure of as-cast specimen.
Fig. 2. Microstructure of 1 hour aged specimen.
Fig. 3. Microstructure of 2 hour aged specimen.
Fig. 4. Microstructure of 3 hour aged specimen.
Fig. 5. Microstructure of 4 hour aged specimen.
Fig. 6. Microstructure of 5 hour aged specimen.
2.5 Microhardness Test
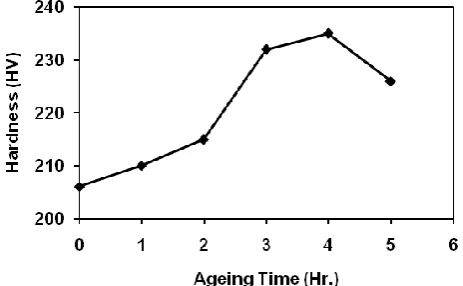
standard. The hardness was taken at various places (10 readings) to get an average hardness value of the alloy. The hardness of the alloy measured for as-cast, homogenized and solution treated conditions was 191, 211, 206 HV respectively. During homogenization treatment the hardness of the alloy increases due to homogeneous distribution of alloying elements in the copper matrix and the as-cast dendrite structure was disappeared. It is clear from Fig. 7 that the hardness increases from 206 HV at zero ageing (solution treated condition) time to 235 HV at four hours of ageing. Further, ageing at five hours, reduced the hardness to 226 HV.
Fig. 7. Hardness versus ageing time.
The formation of modulated structure through spinodal decomposition and subsequent formation of ordered structure increases the hardness of the alloy and the decrease in hardness is due to the development of grain boundary precipitates, causing reduction in strength [13]. The similar behaviour was observed in the previous studies [3-4,7-9,14-16].
3. PLAN OF EXPERIMENT
In the plan of experiments, the selected parameters were ageing time, applied load and sliding speed. For each parameter three levels were taken as shown in Table 1.
Table 1. Wear parameters and their levels.
Sl. No. Load (N) Applied Sliding Speed (rpm) Time (Hr.) Ageing
1 10 159 1
2 20 318 3
3 30 477 5
Orthogonal array of L9 was selected for conducting the experiment. The response to be
studied was specific wear rate (SWR) of the Cu-7Ni-4Snalloy, under the influence of parameters selected. The wear condition used in this experiment was dry sliding at room temperature.
4. EXPERIMENTAL STUDIES ON WEAR
The wear test specimens (Ø10 × 40 mm) were prepared from the aged (1 to 5 hours) rods by machining process. Pin-on-Disc wear tester was used to test the specimen as per ASTM G99 standard and it is shown in Fig. 8. The wear test was conducted as per selected L9 orthogonal array under dry sliding condition. The sliding time was taken as 600 s. The SWR was calculated by measuring the initial and final weight of the specimens and is expressed in mm3/Nm. The density of the alloy was measured by water displacement method and its value was 8.38 g/cm3. Table 2 shows the experimental result of SWR obtained when it was conducted as per L9 orthogonal array. The values of signal-to-noise (S/N) ratio were obtained through MINI-TAB for the corresponding set of values such as applied load, sliding speed, ageing time and SWR.
Fig. 8. Pin-on-Disc wear tester.
Table 2. Experimental results of L9 orthogonal array.
Exp. No.
Applie d Load
(N)
Sliding Speed (rpm)
Ageing Time (Hr.)
SWR ×10-12
(mm3/Nm)
S/N ratio (db)
1 10 159 1 3.98 11.99
2 10 318 3 1.22 1.73
3 10 477 5 1.78 5.00
4 20 159 3 1.38 2.79
5 20 318 5 1.94 5.75
6 20 477 1 3.78 11.55
7 30 159 5 2.52 8.02
8 30 318 1 4.70 13.44
5. RESULTS AND DISCUSSION
The next sections explain the influence of parameters on SWR of selected Cu-7Ni-4Snalloy, S/N ratios, ANOVA and regression analysis.
5.1 Influence of wear Parameters on SWR
The S/N ratio and mean plot for the SWR are shown graphically in Figs. 9 and 10 respectively.
Fig. 9. Main effect plots for S/N ratio – SWR.
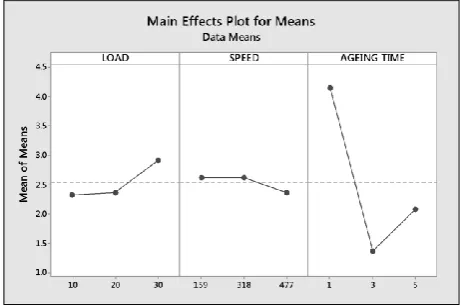
Fig. 10. Main effect plots for means – SWR.
Figure 9 (S/N) shows the optimum value of process parameters (Applied Load = 10 N; Sliding Speed = 477 rpm; Ageing Time = 3 hrs) to improve the wear resistance of Cu-7Ni-4Snalloy and mean plot shows the trend of responses for the selected parameters.
5.2 Influence of load on SWR
From the plot (Fig. 10), it is observed that the SWR increased as load increases up to 30 N. As the load increases, the frictional heat is generated at the interface. Hence, the alloy strength decreases. During the initial metal to metal contact period, the contact surface gets
smoothened and increases the contact surface. Further, there will be an additional increase in temperature due to tillage effect caused by the force of friction. These results increased in adhesion between the contact surfaces followed by more deformation and material loss. It is in agreement with previous researchers [17-18].
5.3 Influence of sliding speed on SWR
From the Fig. 10, it is seen that as the sliding speed increases, the SWR decreases marginally. This may be due to the formation of oxide layer because of frictional heat by increasing the speed [19].
5.4 Influence of ageing time on SWR
From the Fig. 10, it is evident that, as the ageing time increases, the SWR decreases initially up to three hours of ageing and further ageing increases the SWR. The initial decrease in SWR is due to increase in alloy hardness (Fig. 7) up to four hours of ageing and then hardness started to decrease which causes increase of SWR [2].
5.5 S/N Ratio Analysis
Table 3 shows the parameters of applied load, sliding speed and ageing time that significantly influence on response (SWR) and its order on parameters, identified by S/N ratio analysis. The parameter influence is selected from the delta (Δ) value as shown in Table 3.
Table 3. S/N ratio- SWR response table based on
Smaller-the-better.
Level Load (N) Applied Sliding Speed (rpm) Ageing Time (Hr.)
1 6.24 7.61 12.33
2 6.70 6.98 2.74
3 8.39 6.75 6.26
Delta (Δ) 2.14 0.86 9.59
Rank 2 3 1
It is the difference between the maximum and minimum value of the parameter selected. The highest delta value indicates the maximum influence on the SWR. Hence, it is inferred from the Table 3, that the ageing time has the major influence on SWR as compared to load and speed.
5.6 ANOVA for SWR
on response was estimated and the significant parameter that affects the response was known.
Table 4. ANOVA for SWR.
Source DF Seq SS Adj SS Seq MS F P % Applied
Load 2 7.648 7.648 3.824 1085 0.001 5.10 Sliding
Speed 2 1.185 1.185 0.593 168 0.006 0.80 Ageing
time 2 141.18 141.19 70.59 20043 0.000 94.1
Error 2 0.007 0.007 0.003 5
Total 8 150.03
The parameters selected were applied load, sliding speed and ageing time on SWR considering the confidence and significance levels of 95 % and 5 % respectively. Table 4 shows the each parameter % contribution on response. From this, it is concluded that the ageing time has the highest influence on SWR.
5.7 Validation with Confirmation Test through Linear Regression Analysis
A linear regression equation was developed through regression analysis for SWR to get new data [20].It relates the parameters of applied load, sliding speed and ageing time with SWR. These parameters affect the SWR in the ANOVA. The linear equation for SWR is shown in the equation (1), considering the confidence and significance levels of 95 % and 5 % respectively:
𝑆WR = 3.77 + 0.0295L − 0.00083S − 0.518A (1)
where SWR, L, S, and A indicates specific wear rate, applied load, sliding speed and ageing time respectively. Further, in the above equation, the positive sign indicate increase in SWR and negative sign indicate decrease in SWR with parameter. To validate the regression model, the confirmation tests were conducted by selecting some parameters (Table 5) which was not selected in L9 orthogonal array for conducting wear test.
Table 5. Confirmation experiment test levels and
parameters.
Sl. No. Load (N) Applied Sliding Speed (rpm) Ageing Time (Hr.)
1 15 239 2
2 15 398 4
3 25 239 2
4 25 398 4
Table 6 shows the values of confirmation and the calculated results as well as the % error which
varies from 0.6 to 9.5. Since the % error is less, the developed model is acceptable.
Table 6. Confirmation and the calculated result values.
Sl. No. Experimental SWR×10-12
(mm3/Nm)
Regression SWR×10-12
(mm3/Nm)
Error (%)
1 2.96 2.98 0.6
2 2.00 1.81 9.5
3 3.32 3.27 1.5
4 2.23 2.11 5.4
6. SEM ANALYSIS
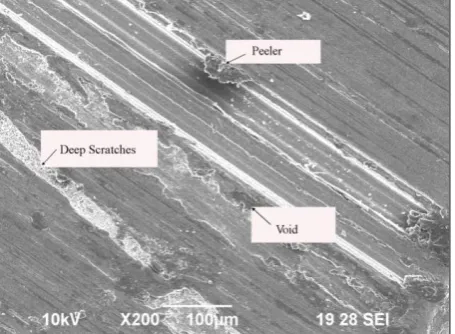
The SEM images obtained for specimens subjected to various load and ageing time at constant speed of 318 rpm are shown in Figs. 11 to 13 and is used to illustrate the general features. The worn out surface morphology of the Cu-7Ni-4Snalloy was characterized by scratches and smearing.
Fig. 11. SEM Image of specimen subjected to (Applied
Load=30 N; Sliding Speed=318 rpm; Ageing Time=1 hr).
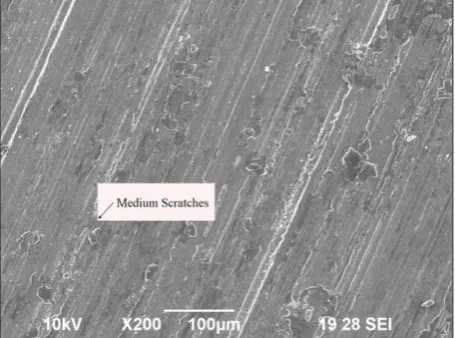
Fig. 12. SEM Image of specimen subjected to (Applied
Fig. 13. SEM Image of specimen subjected to (Applied Load=10 N; Sliding Speed=318 rpm; Ageing Time=3 hrs).
Fig. 14. SEM Image of specimen subjected to (Applied
Load=10 N; Sliding Speed=477 rpm; Ageing Time=3 hrs).
Deep and continuous scratches were observed in Figs. 11 and 12. It is due to higher loads and low hardness values of the specimen, whereas, in Fig. 13, the scratches are less as compared Figs. 11 and 12. In this condition the specimen is subjected to lowest load and also the hardness of the specimen is high. Further, for the optimum test parameters (Applied Load = 10 N; Sliding Speed = 477 rpm; Ageing Time = 3 hrs), the wear test was conducted and also the SEM image was taken as shown in Fig. 14. It is concluded from the Fig. 14 that ageing time is the dominant parameter on SWR of the Cu-7Ni-4Snalloy.
7. CONCLUSION
The cast Cu-7Ni-4Sn spinodal bronze alloy was successfully developed by sand casting process.
The uniformity in composition was achieved through homogenization treatment.
The hardness of the alloy was significantly increased through age hardening treatment.
The hardness of the alloy was increased due to the microstructural changes taken place during the ageing process.
From the ANOVA analysis, it was found that, ageing time has the major influence on SWR followed by applied load and sliding speed.
Further, the developed linear regression
equation was validated through
confirmatory results.
Finally, the SEM analysis revealed that the occurrence of minimum SWR at optimum conditions [Fig. 14].
REFERENCES
[1] S. Ilangovan, Study of microstructure, hardness and wear properties of sand cast Cu-4Ni-6Sn bronze alloy, Journal of Engineering Science and Technology, vol. 10, no. 4, pp. 526-532, 2015. [2] S. Ilangovan, R. Sellamuthu, Effects of tin on
hardness, wear rate and coefficient of friction of cast Cu-Ni-Sn alloys, Journal of Engineering Science and Technology, vol. 8, no. 1, pp. 34-43, 2013.
[3] L.H. Schwartz, S. Mahajan, J.T. Plewes, Spinodal decomposition in a Cu-9 wt% Ni-6 wt% Sn alloy, Acta Metallurgica, vol. 22, iss. 5, pp. 601-609, 1974,
doi: 10.1016/0001-6160(74)90157-6
[4] L.H. Schwartz, J.T. Plewes, Spinodal decomposition in Cu-9wt% Ni-6wt% Sn—II. A critical examination of mechanical strength of spinodal alloys, Acta Metallurgica, vol. 22, iss. 7, pp. 911-921, 1974, doi: 10.1016/0001-6160(74)90058-3
[5] J.C. Zhao, M.R. Notis, Spinodal decomposition, ordering transformation and discontinuous precipitation in a Cu-15Ni-8Sn alloy, Acta Materialia, vol. 46, iss. 12, pp. 4203-4218, 1998,
doi: 10.1016/S1359-6454(98)00095-0
[6] A. Deraisme, C. Servant, D. Pachoutinsky, Y. Bienvenu, Y.D. Bartout, L.T. Mingault, P. Bertrand, R. Baily, Cu9Ni6Sn: Determination of Phase Transformation at High Temperature, Journal of Phase Equilibria and Diffusion, vol. 31, iss. 2, pp. 98-103, 2010, doi: 10.1007/s11669-009-9639-2
vol. 124, iss. 2, pp. 223-231, 1990, doi: 10.1016/0921-5093(90)90152-S
[8] S.Z. Zhang, B.H. Jiang, W.J. Ding, Wear of Cu-15Ni-8Sn spinodal alloy, Wear, vol. 264, iss.
3-4, pp. 199-203, 2008, doi:
10.1016/j.wear.2007.03.003
[9] S.Z. Zhang, B. Jiang, W.J. Ding, Dry sliding wear of Cu-15Ni-8Sn alloy, Tribology International, vol. 43, iss. 1-2, pp. 64-68, 2010, doi: 10.1016/j.triboint.2009.04.038
[10] J.B. Singh, W. Cai, P. Bellon, Dry sliding of Cu–15 wt%Ni–8 wt%Sn bronze: Wear behaviour and microstructures, Wear, vol. 263, iss. 1-6, pp. 830-841, 2007, doi: 10.1016/j.wear.2007.01.061
[11] F. Sadiand, C. Servant, Phase transformations and phase diagram at equilibrium in the Cu-Ni-Sn system, Journal of Thermal Analysis and Calorimetry, vol. 90, iss. 2, pp. 319-323, 2007,
doi: 10.1007/s10973-007-8347-6
[12] N.J. Kar, Copper-based spinodal alloy bearings, U.S. Pat. no. 4,641,976, 1987.
[13 H. Zhang, H. Yizhy, Y. Xiamin, Y. Pan,
Microstructure and age characterization of Cu-15Ni-8Sn alloy coatings by laser cladding, Applied Surface Science, vol. 256. iss. 20, pp.
5837-5842, 2010, doi:
10.1016/j.apsusc.2010.03.056
[14] E.G. Baburaj, U.D. Kulkarni, E.S.K Menon, R. Krishnan, Initial stages of decomposition in Cu-9Ni-6Sn, Journal of Applied Crystallography, vol. 12, no. 5, pp. 476-480, 1979, doi: 10.1107/S0021889879013066
[15] P. Virtanen, T. Tianen, Effect of Nickel Content on the Decomposition Behaviour and Properties of CuNiSn Alloys, Physica Status Solidi (A), vol. 159, iss. 2, pp. 305-316, 1997, doi: 10.1002/1521-
396X(199702)159:2<305::AID-PSSA305>3.0.CO;2-7
[16] J.G. Zhang, H.S. Shi, D.S. Sun, Research in spray forming technology and its applications in metallurgy, Journal of Materials and Processing Technology, vol. 138, iss. 1-3, pp. 357-360, 2003,
doi: 10.1016/S0924-0136(03)00098-0
[17] M.A. Chowdhury, M.K. Khalil, D.M. Nuruzzaman, M.L. Rahaman, The effect of sliding speed and normal load on friction and wear property of aluminium, International Journal of Mechanical & Mechatronics Engineering, vol. 11, no. 1, pp. 45-49, 2011.
[18] M. Babic, S. Mitrovic, R. Ninković, Tribological Potential Of Zinc-Aluminium Alloys Improvement, Tribology in Industry, vol. 31, no. 1-2, pp. 15-28, 2009.
[19] A. Ramasundaram, S. Ilangovan, S. Arul, A. Shanmugasundaram, Influence of specimen temperature on wear characteristics of Al-Zn-Mg castings, International Journal of Applied Engineering Research, vol. 10, no. 6, pp. 15417-15428, 2015.
[20] N. Radhika, R. Raghu, Experimental Investigation on Abrasive Wear Behavior of Functionally Graded Aluminum Composite, Journal of Tribology, vol. 137, iss. 3, pp. 1-7, 2015, doi: