
UV spectrophotometric method for simultaneous determination of levocetirizine and ivermectin in bulk and combined dosage form
5
0
0
Full text
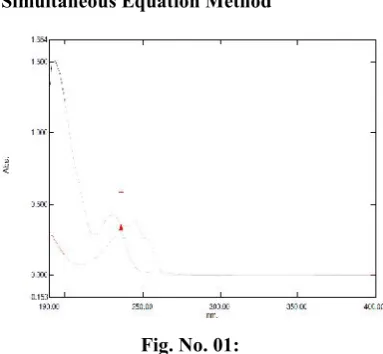
(2) Ashok Reddy S et al., Int. Journal of Pharmacy & Industrial Research Vol – 02 Issue – 02 Apr – Jun 2012. 155. strongyloidiasis, and enterobiasis2-4. Literature. flasks, the volume was completed with. review reveals that some analytical methods. distilled water The absorption spectra between. have been reported for LEVEC alone and in. 200-400 nm of all solutions of LEVC and. biological fluids or in combination with other. IMEC were measured at 230 nm (λ_max for. 5. drugs in pharmaceutical dosage forms . High-. LEVC), 245 nm (λmax for IMEC).. 6,7. performance Liquid chromatography , liquid chromatography with electrospray ionization 8,9. mass spectrometry. Simultaneous Equation Method. for determination of. IMEC as a bulk drug and in dosage forms, biological fluids as well as in human and animal body tissues has been reported in the literature. However, no published analytical technique focuses on simultaneous estimation of LEVEC and IMEC. The present work aimed at developing a simple, sensitive, accurate, and precise UV simultaneous method for routine Fig. No. 01:. analysis. The proposed method was validated. Overlain spectra of LEVEC & IMEC. according to ICH guidelines (ICH, 2005).. Table No. 01: Value from Overlain spectra. Materials and Methods. of LEVEC & IMEC. Instrumentation A dual-beam Shimadzu UV-visible spectro photometer 1700 Pharmaspec was used.. S.No. Wavelength (nm). Absorbance. 1.. 236.00. 0.332. Reagents and Chemicals. From the overlain spectra of LEVEC(1μg/ml). Gift samples of LEVC and IMEC were. and IMEC (1.2μg/ml) in 1:1 of acetonitrile and. procured from CHANDRA LABS pvt ltd.. distilled water, wavelengths 230nm (λmax of. Kukatpally, Hyderabad. According to the. LEVC) and 245nm (λmax of IMEC) were. solubility characteristics, the common solvent. selected for the formation of Simultaneous. for the two drugs was found to be 1:1 of. equation method. From the above stock. acetonitrile and water.. solution, aliquots were drawn and suitably diluted so as to get the final concentration. Preparation of standard stock solution. range of 1 – 6.0 μg/ml of LEVC and 1.2-7.2. Standard stock (100μg/ml) of LEVEC and. μg/ml of IMEC.. (100 μg/ ml) of IMEC were prepared in 1:1 of. solutions were recorded in the respective. acetonitrile and water. The aliquot portions. wavelengths. Both the drugs were linear in the. (1.0, 2.0, 3.0, 4.0, 5.0, 6.0 ) from the 100 μg/. concentration range of 1–6.0μg/ml of LEVC. ml LEVC and (1.2, 2.4, 3.6, 4.8, 6.0, 7.2) from. and 1.2-7.2μg/ml of IMEC and Calibration. the 100μg/ml working IMEC solutions were. curves. accurately transferred to 10ml volumetric. concentration and absorbances of drugs with. www.ijpir.com. [n=6]. Absorbances of these. were. plotted. between.
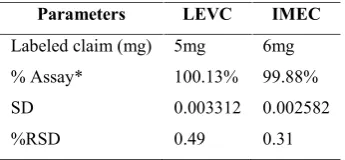
(3) 156. Ashok Reddy S et al., Int. Journal of Pharmacy & Industrial Research Vol – 02 Issue – 02 Apr – Jun 2012. correlation coefficient value not less than. minutes and diluted to the mark with distilled. 0.999. E (1%, 1cm) is determined for. water. It was filtered through Whatmann filter. Levocetirizin at 230nm and 245nm were 0.182. paper no: 41, filtrate was suitably diluted to get. and 0.06382 while respective values for IMEC. final concentration of 1μg/ml of LEVEC and. are 0.2446 and 0.225. These values are the. 1.2μg/ml of IMEC with distilled water. The. mean of six independent determinations.. absorbance of sample solution was measured at all selected wavelengths. The content of. The simultaneous equations formed were,. LEVEC and IMEC in sample solution of tablet. At λ A = a x bc + ay bc ------ (1) 1. 1. 1. x. 1. was calculated. This procedure was repeated. y. for six times.. A1 = 0.182C + 0.06382C -----(2) X. Y. Table No. 02:. At λ A = a x bc + ay bc ------- (3) 2. 2. x. 2. Parameters of tablet formulation. y. Parameters. A2 = 0.2446C + 0.225C ------ (4) X. Y. LEVC. IMEC. Labeled claim (mg). 5mg. 6mg. % Assay*. 100.13%. 99.88%. SD. 0.003312. 0.002582. %RSD. 0.49. 0.31. *=average of 6 determinations. Results Precision The precision of the method was confirmed by repeatability and intermediate precision. The Where A and A are the absorbances of. repeatability was performed by the analysis of. sample. 245nm. formulation and it was repeated for six times. respectively. Cx and C are the concentration. with the same concentration. The amount of. 1. 2. solution. at. 230nm. and. Y. of LEVEC and IMEC respectively (μg/ml) in sample solution. The absorbances [A. 1&. A ] of 2. the sample solution were recorded at 230 and 245nm respectively and concentration of both the. drugs. were. calculated. using above. mentioned equation (2 &4).. each drug present in the tablet formulation was calculated. The intermediate precision of the method was confirmed by intraday and inter day analysis i.e. the analysis of formulation was repeated three times in the same day and on three successive days. The amount of drugs was determined and % Relative standard. Analysis of tablet formulation. deviation (RSD) were calculated which is less. Twenty tablets were weighed and average. than 2%. Table No. 03: Precision Data’s. weight was found. The tablets were triturated to a fine powder. An accurately weighed. Drug. quantity of powder equivalent to 5 mg of LEVEC. was. transferred. in. to. 100ml. Intra day Precision. Inter-day Precision. S.D*. S.D*. %. RSD. %. RSD. LEVEC. 0.003312. 0.49. 0.003311. 0.48. IMEC. 0.002582. 0.31. 0.002583. 0.31. volumetric flask, sufficient distilled water was added and the solution was sonicated for 15. www.ijpir.com. *= average of six determinations.
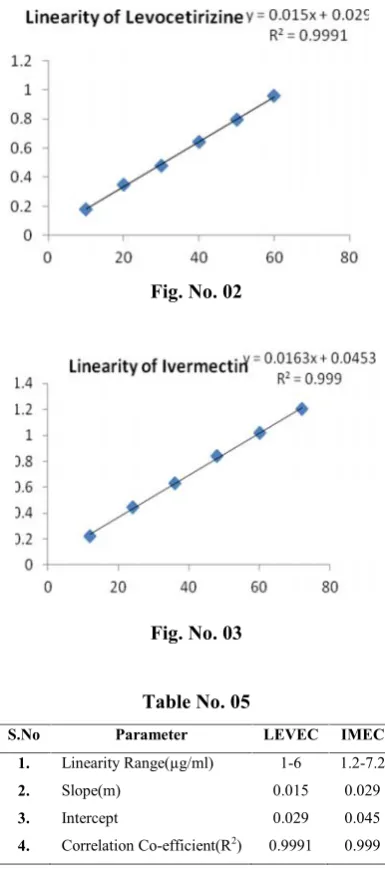
(4) Ashok Reddy S et al., Int. Journal of Pharmacy & Industrial Research Vol – 02 Issue – 02 Apr – Jun 2012. 157. Accuracy Accuracy of the method was studied by recovery. experiments.. The. recovery. experiments were performed by adding known amounts to tablet. The recovery was performed at 100% level at 3 different standard concentrations. The recovery samples were prepared in before mentioned procedure three different concentrations of the samples were Fig. No. 02. prepared for each recovery level. The solutions were then analyzed and the results of recovery studies were found to be satisfactory and the results are presented in table. Table No. 04: Accuracy Data’s S.no. % spike. 1.. 50%. Amount recovered. % recovery. LEVEC 48.87*. 97.75. *. 99.55. 2.. 100%. 99.55. 3.. 150%. 151.34*. 100.9. Fig. No. 03. IMEC 1.. 50%. 49.43. *. 98.85. *. 98.85. 2.. 100%. 98.85. 3.. 150%. 149.14*. Table No. 05. 99.43. S.No. *= average of six determinations Linearity The linearity of the response of the drugs was verified at 0-100ug/ml concentrations, the calibration graphs were obtained by plotting the absorbance versus the concentration data and. were. treated. by. linear. regression. analysis(table no.) The equation of the calibration curve for LEVEC and IMEC obtained Y=0.016x+0.011 and Y=0.042x + 0.016, the calibration curve were found to be. Parameter. LEVEC. IMEC. 1-6. 1.2-7.2. Slope(m). 0.015. 0.029. Intercept. 0.029. 0.045. 0.9991. 0.999. 1.. Linearity Range(µg/ml). 2. 3. 4.. 2. Correlation Co-efficient(R ). Limit of Detection (LOD) and Limit of Quantification (LOQ) The LOD and LOQ of the LEVEC and IMEC were determined by using standard deviation of the response and slope approach as defined in ICH guidelines. The LOD and LOQ was found to be as in table.. linear in therefore mentioned concentrations. The correlation co-efficients (r2) for LEVEC and IMEC were determined by 0.9991 and 0.999.. www.ijpir.com. Table No. 06 Drug. LOD. LOQ. LEVEC. 0.7286. 0.5325. IMEC. 2.2742. 1.6621.
(5) 158. Ashok Reddy S et al., Int. Journal of Pharmacy & Industrial Research Vol – 02 Issue – 02 Apr – Jun 2012. Discussion. 8.. T.S. Thompson, D.K. Noot, F. Forrest,. Based on the results, obtained from the. J.P. van den Heever, J. Kendall, J.. analysis of described method, it can be. Keenliside, Anal. Chim. Acta. 633 (2009). concluded that the method has linear response. 127.. in the range of 1-6 μg/ml and 1.2-7.5 μg/ml for. 9.. Validated. HPTLC. Method. for. LEVEC and IMEC, respectively with co-. Simultaneous Estimation of Ivermectin. efficient of correlation, (r2)=0.9991 and (r2) =. and Albendazole in Formulation AJPBR.. 0.999 for LEVEC and IMEC, respectively.. 2011; 1(3): 330-336.. The result of the analysis of pharmaceutical. 10. Hobart. H. Willard et al., Instrumental methods. formulation by the proposed method is highly. analysis,. CBS. Publand. st. Distributors, New Delhi, 1 edition ,1986.. reproducible and reliable and it is in good agreement with the label claim of the drug.. of. 11. Vogel’s. Text. book. of. quantitative. This method can be adopted as an alternative. chemical analysis. Published by Dorling. to the existing methods. Analysis of authentic. Kindersley pvt.ltd. 6th edition.2001.. samples containing LEVEC and IMEC showed. 12. Sethi P.D., Quantitative analysis of Drugs. no interference from the common additives. & Pharmaceuticals. CBS publishers and. and excipients. The method can be used for. distributors, New Delhi, 3rd edition, 2001.. the routine analysis of the LEVEC and IMEC in. combined. dosage. form. without. 13. Beckett A.H and Stenlake J.B Practical pharmaceutical chemistry CBS publishers. any. and distributors, New Delhi, 4th edition.. interference of excipients.. 2005. 14. ICH. References 1. R. Chiou, R.J. Stubbs, W.F. Bayne, J. Chromatogr., 416 (1987) 196.. 2. M. Fisher, H. Mrozik, in: W. Campbell (Ed.), Ivermectin and abamectin, Springer, New york, USA, 1989, pp.1.. 3. A. Lifschitz, G. Virkel, Sallovitz, J. F. Sutra, P. Galtier, Alvinerie, C. Lanusse , Vertin. Parasitol. 87 (2000) 327. 4.. Q. McKellar, H. Benchaoui, J. Vet. Pharmacol. Ther.19 (1996) 331.. 5.. T. Pereira, S.W. Chang, Rapid Commun. Mass Spectrom. 18 (2004) 1265.. 6.. K.A. Krogh, E. Björklund, D. Loeffler, G. Fink, B. Halling-Sørensen, T.A. Ternes, J. Chromatogr. A.1211 (2008) 60.. 7.. S. Croubels, S. De Baere, M. Cherlet, P. De Backer, J. Mass Spectrom. 37 (2002) 840.. www.ijpir.com. Guidelines. Q2A,. Q2B,. ICH. Guidelines 1994 & 1996. Validation of Analytical published. Procedure: in. Switzerland.. March. Definitions, 1996,. Geneva,.
(6)
Figure
Related documents
According to author define SFC dynamic metric is module cohesion obtained from common definition-use pairs of each type common to the various dynamic slices of the
A total of 905 providers were included in the survey, ie, 525 (58.0%) from Hanoi, 122 (13.5%) from Khanh Hoa, and 258 (28.5%) from Ho Chi Minh City; 58.3% came
We de- scribe experiences of seeking and receiving a diagnosis, and access to health care among 462 Australian families living with children affected by a large variety of
Corroborating their strong desire to ensure patients were informed were HCPs concerns that the ever- increasing mainstream specialities now ordering genetic tests might not grasp
In this section, performance of the proposed method is investigated considering classification accuracy obtained under different conditions, such as varying the feature
Yet the story presented by Skloot had the potential to generate a broader discussion in the media and among the public about the ethical concerns related to biobanks and
The optimum formula for CC NE was selected according to the following parameters: droplet size distribution, PDI, zeta potential viscosity, electroconductivity, pH, transmit-
In particular, we demonstrate the congruity between advertising strategy and consumer value-based product type in influencing consumers’ brand love, and show that
