47
International Journal of Engineering and Management Research, Volume-3, Issue-3, June 2013
ISSN No.: 2250-0758
Pages: 47-51
www.ijemr.net
Fuzzy Statistics Based Multi-HE for Image Enhancement with Brightness
Preserving Behaviour
Mrs. Sonia Mathur1, Dr. Rakesh Kr. Singh2
1
Head Of Department, EC Department, Govt. Girls Polytechnic, INDIA
2
Assistant Professor, Electronics Department, KNIT, INDIA.
ABSTRACT
Histogram equalization (HE) has proved to be a simple and effective image contrast enhancement technique. However, it tends to change the mean brightness of the image to the middle level of the gray-level range. Preserving the input brightness of the image is required to avoid the generation of non-existing artifacts in the output image. To surmount this drawback, many brightness preserving and contrast enhancement methods have been proposed. These methods produce images with do not look as natural as the input ones. In order to overcome this drawback, this work proposes a novel technique called Fuzzy based Multi-HE, which consists of decomposing the input image into several sub-images, and then applying the fuzzy HE process to each one. This methodology performs a less intensive image contrast enhancement, in a way that the output image presents a more natural look.
Keywords- Image enhancement, fuzzy statistics, brightness preserving, histogram equalization, contrast adjustment.
I.
INTRODUCTION
Histogram equalization (HE) is a technique commonly used for image contrast enhancement[1].It works by flattening the histogram and stretching the dynamic range of the gray-levels by using the cumulative density function of the image.
It does not preserve the brightness of the input image on the output one. HE is not suitable on consumer electronic products, such as video surveillance, where preserving the input brightness is essential to avoid the generation of non-existing artifacts. Variations of the classic HE technique have proposed these methods, described in details in Section III, use some statistical measures which consider the value of the gray levels in the image, during the decomposition step. Another method is based on histogram transformation for image contrast enhancement and brightness preserving with maximum entropy (BPHEME) presented in [2] is a histogram
specification of an entropy distribution. Both the methods based on Bi-HE and the method proposed in [2] perform image contrast enhancement with success while preserving the input brightness in some extend, but they might generate images with do not look as natural as the input ones.
This article proposes a Fuzzy based Multi- HE (MHE) technique which first decomposes the input image into several sub-images, and then applies the fuzzy membership function dependent HE process to each of them.
The remaining of this work is organized as follows. As the proposed method use many concepts previously introduced in the literature, Section II presents some basic definitions regarding gray-level images, whereas Section III describes previous works. The proposed methods are introduced -\in Section IV. Results of our methods are presented, discussed and compared with other HE methods in Section V. Finally, conclusions are drawn in Section VI.
II.
PREVIOUS WORK
48
A. Classical HE Method (CHE):
HE method uniformly distributes the histogram over the entire range of gray-levels.
The high performance of the HE in enhancing the contrast of an image is a consequence of the dynamic range expansion of the gray-level's image domain. That is, theoretically the output image enhanced by a HE method uses all the graylevel's image domain, i.e., from 0 up to L
−1 Based on information theory, the entropy of a message
source will get the maximum value when the message respects the uniform distribution property [3]. This means that an image enhanced by the CHE method has the maximum information (i.e., the entropy) with respect to its original one. Despite of the advantages offered the CHE method, it can introduce a significant change in the image brightness, i.e., its mean gray-level. That is, thanks to the uniform distribution specification of the output histogram, the CHE method shifts the brightness of the output image to the middle gray-level, i.e., L / 2. This change in brightness is not desirable.
B. Multi Peak GHE:
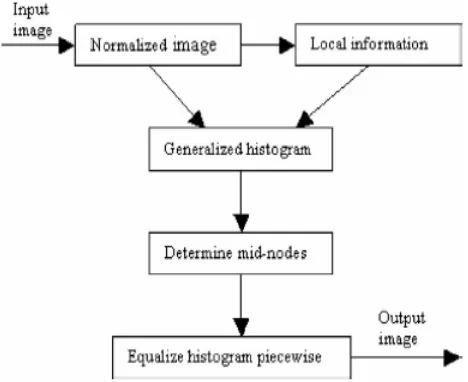
In multi-peak GHE approach, the function will be generalized. It depends not only on intensities u(x, y), but also on the local information v(x, y) of each pixel (x, y). It is described as
g(x, y) = f (u(x, y), v(x,y)).
p(g(x, y)) is the density function, and it can be described in short
p(g) = h(f (u,v))
This technique perform multi-peak histogram equalization based on the newly defined density function p(g(x, y)) . (Fig. 1).
The local information could be an edge value obtained by the edge operators such as Laplacian operator, Sobel operator, etc., or could be any local statistic value associated with the distribution of the gray levels in a small window. To make the change of the order of the gray levels of the original image completely controllable, the range of the value v(x, y) is normalized and shifted to the range [−0.5, 0.5], then Eq. (3) can be re-written as
p(x, y) = u(x, y)+w(x, y)×v(x, y),
where w(x, y) is the weight of the edge values. By adjusting the value w(x, y), the change of the order of the gray levels will be completely under the control.
Fig 1. The block diagram of the proposed approach.
III.
HISTOGRAM DENSITY ANALYSIS
BASED ON HISTOGRAM DIVISION
Histogram density based analysis method using splitting of image is explained by referring to Fig.2. Fig. 2(a) shows image histogram that has rapid variation and high density in specific histogram area. When GHE process through this image, the dark area around the cameraman which has high-density histogram has a wild interval as Equalization processing. And the sky around the area also has a large gap and increases the contrast as Equalization processing. (Reference Fig. 2(f)) However, as the histogram analysis of equalized image's light area and between dark area around the cameraman and ground area show the brightness information was missed. And Fig. 2(g) shows more flat histogram distribution as local histogram equalization, but the light area's missing information and distorting pixel value were increased.
The image that represents over-equalization effect has several characteristics that histogram distribution change quickly and hardly focus on some histogram areas. Therefore the reason of over-equalization can be known by analyzing histogram CDF function which is standard of brightness value redistribution.
49
Fig 2: Histogram of the objects in the original image asshown in (a)
B. Partitioning of the Histogram:
Every valley portion between two consecutive local maxima forms a partition. When the dynamic equalization of these partitions is performed the peaks of the histogram do not get remapped and this results in better preservation of the mean image-brightness while increasing the contrast.
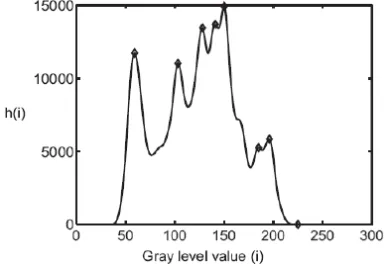
1) Detection of Local Maxima: The local maxima in the Fuzzy Histogram are located using the first and second derivative of the Fuzzy histogram.
Fig. 3. Fuzzy histogram with marked local maxima.
The second order derivative is computed directly from the fuzzy histogram using the second order central difference operator .
2) Creating Partitions: The local maxima points in the fuzzy histogram can now be used to form the partitions. Let (n+1) intensity levels corresponding to the local maxima, detected in the previous stage of operation, be denoted by {m0, m1, …, mn}. Assuming the original fuzzy
histogram to have a spread in the range of [Imin, Imax], then
the (n+1) sub-histograms obtained after partitioning are {[Imin, m0],[m0+1, m1],…, [mn+1, Imax]}.
3) Mapping Partitions to a Dynamic Range: The following set of equations give the parameters that are useful in dynamic equalization process.
where highi and lowi are the highest and lowest intensity values contained in the ith input sub-histogram, Mi is the total number of pixels contained in that partition. The dynamic range of the input sub-histogram is specified by
spani, while the dynamic range used in the output sub-histogram is rangei.
C. Normalization of Image Brightness:
The image obtained after the dynamic histogram equalization of each sub histogram is has the mean brightness that is slightly different than the input image. To remove this difference the normalization process is applied on the output image.
Let mi and mo be the mean brightness levels of the input image and the image (f) obtained after dynamic histogram equalization stage. If g is the output image of BPDFHE technique then the gray level value at the pixel location (x, y) for the image g is given as
This brightness preserving procedure ensures that the mean intensity of the image obtained after process is the same as that of the input.
IV.
SIMULATION RESULTS
50
without altering image brightness is the restrained goal ofthe histogram modification technique discussed here. Hence the algorithm performance should be evaluated and compared on the basis of these two parameters. Here we use Luminance Distortion measure and the Contrast feature value, computed from Fuzzy Gray Level D. Sheet et al.: Brightness Preserving Dynamic Fuzzy Histogram Equalization 2477 Co-occurrence Matrix, to compare performance of GHE, BPDHE and our BPDFHE techniques.
(a) Original
(b) Imadjust
(c) Histeq
p q
(d) Adapthisteq
(e) FMHE, gaussian , g
(f) FMHE, Triangular Fig. 4. Results for the image tire.tif.
Figure 4(a) indicates original image tire.tife (grayscale image) on performing imadjust we do not find any significant improvement in gray scale distribution for expressing details in image.histeq (fig 4c)however improving image contrast but image brightness has increased drastically. Due to which high luminousity details are washed out. Adaphisteq (fig 4d) is good in detail wise but it has also increased brightness undesirable and also giving non uniform and abrupt gray scale distribution. FMHE Gaussian is showing best output with preserved brightness with uniformity in gray distribution.
51
(b) Imadjust(c) Histeq
Adapthisteq
(d) Adapthisteq
FMHE,gaussian
(e) FMHE, Gaussian
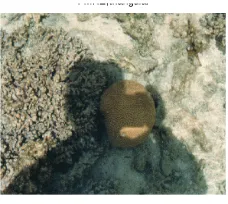
Similar to figure 4 test are performed on coloured image shadow.tif. We can see that here FMHE is also performing well in respect to other techniques in giving uniform color distribution with enhanced details along with preserving original brightness.
FMHE,triangular
(f) FMHE, Triangular
Fig. 5. Results for the image shadow.tif
V.
CONCLUSION
This paper proposes FMHE as a modification to BPDHE to improve its ability to enhance contrast and preserve brightness. The novelty of FMHE lies in the use of fuzzy statistics of digital images for representation and processing of the images. This gives it the improved ability to preserve brightness and provide better contrast enhancement ascompared to BPDHE. From the results it is seen that FMHE can very efficiently preserve the mean image-brightness and its performance is at least as good as BPDHE. In most cases the contrast improvement provided by FMHE is credibly more than that provided by other methods.
REFERENCES
[1] R. Gonzalez and R. Woods, Digital Image Processing, 2nd ed. Prentice Hall, Jan. 2002.
[2] C. Wang and Z. Ye, ”Brightness preserving histogram equalization with maximum entropy: A variational perspective,” IEEE Trans. On Consumer Electronics, vol. 51, no. 4, pp. 1326-1334, Nov. 2005.
[3] Y. Wang, Q. Chen, and B. Zhang, “Image enhancement based on equal area dualistic sub-image histogram equalization method,” IEEE Trans. On Consumer Electronics, vol. 45, no. 1, pp. 68-75, Feb. 1999.