American Journal of Remote Sensing
2014; 2(4): 30-36Published online October 30, 2014 (http://www.sciencepublishinggroup.com/j/ajrs) doi: 10.11648/j.ajrs.20140204.12
ISSN: 2328-5788 (Print); ISSN: 2328-580X (Online)
Comparison of natural frequencies of vibration for a bridge
obtained from measurements with new sensor systeme
Nobuhiro Shimoi
1, *, Masahiro Saijo
2, Carlos Cuadra
1, Hirokazu Madokoro
11
Department of Machine Intelligence and Systems Engineering, Akita Prefectural University, Yurihonjo, 015-0055 Japan 2
Department of Development Planning, OYO Corporation, Tsukuba, 305-0841 Japan
Email address:
[email protected] (N. Shimoi), [email protected] (M. Saijo),[email protected] (C. Cuadra), [email protected] (H. Madokoro)
To cite this article:
Nobuhiro Shimoi, Masahiro Saijo, Carlos Cuadra, Hirokazu Madokoro. Comparison of Natural Frequencies of Vibration for a Bridge Obtained from Measurements with New Sensor Systeme. American Journal of Remote Sensing. Vol. 2, No. 4, 2014, pp. 30-36.
doi: 10.11648/j.ajrs.20140204.12
Abstract:
Deterioration and aging of bridges structures and damage caused by strong earthquakes might be conducive to collapse of the bridge, sometimes with catastrophic consequences. Therefore, investigation of structural condition of bridges is necessary for secure safe road operations. This paper presents a prototype of piezoelectric-cable sensor for vibration monitoring system that permits easy evaluation of the bridge structure integrity. For this study, a bridge located at Yurihonjo city, Japan was chosen as a target structure. The structure is a continuous beam type bridge with steel beams of various sections and lengths and reinforced concrete slabs to support the asphalt carpet. The bridge comprises seven spans with total length of 256 m. Experimental measurements were taken of the first span near the left abutment. Quantitatively, the natural period of vibration is obtainable from signals recorded using the proposed data acquisition system. Subsequently, results obtained from the proposed system are compared with those obtained from common accelerometers. A piezoelectric sensor emits a signal when a change in the stress condition occurs. Therefore, the sensor was set up at the support of the bridge where large changes in the stress level are expected to occur. The target bridge was also subjected to moving loads. Its vibration response was also obtained. The experiment was performed using a track of 19 t of equivalent weight. Responses were captured appropriately using the proposed system. They are comparable to responses obtained using accelerometers. Although the general response pattern is obtained appropriately, it is necessary to improve the accuracy of the proposed system to gather more reliable data. As presented herein, the general outline of the proposed system is described, mentioning the main specifications and assessing possible means to improve the data acquisition system to permit stable and accurate monitoring of bridge structures.Keywords: Smart Sensor, Health Monitoring, Natural Vibration Characteristic, Piezoelectric Sensor
1. Introduction
In Japan, many bridges were constructed as part of the reconstruction program undertaken after 1945. Therefore older structures from that era are now in danger because of structural deterioration. During the decade of the 1980s, construction of large projects of building and bridges were initiated. Then high demands for materials, especially for reinforced concrete structures, induced the use of sea sand that contains salts that in reaction with water and cement originates the corrosion of steel reinforcements [1]. Outside Japan, an example of the necessity of health monitoring was evident in the collapse of the bridge I-35W on the Mississippi River in the USA. During the evening rush hour on August 1,
2007, the bridge collapsed suddenly, killing 13 people and injuring 145 people. In Japan, the Ministry of Land and Transportation has conducted a study of bridge vulnerability, identifying 121 cases of bridges in danger. The risk posed to bridges is attributable to the deterioration of aged concrete bridges (weathering) and to the corrosion of steel bridges [1] [2].
Continuous or real time structural health monitoring can help prevent or forestall damage, particularly catastrophic damage. Monitoring systems already exist, but they are generally designed to be installed in new structures. Moreover, they are expensive. Simple and cheap sensor systems are required for existing older structures.
31 Nobuhiro Shimoi et al.: Comparison of Natural Frequencies of Vibration for a Bridge Obtained from Measurements with New
cable inserted into a bolt shape. Its applicability to perform health monitoring of structures was verified using a series of measurements of vibrations of a target bridge. The selected bridge was located at Yurihonjo city, Akita
Results obtained using this novel simple smart sensor comparable to those obtained using more sophisticated and expensive commercial sensors [3].
2. Target Bridge
A general view of the structure selected for this study is portrayed in Figure 1. This bridge, called A
Bridge, was constructed in 1979. It spans the Koyoshi Riv with its 256 m total length.
Figure 1. General view of the target structure.
The target is a girder type bridge with seven spans, as shown in Figure 2(a). For measurements only of the first span (encircled left span in Figure 2(a)) was selected.
The bridge structure is formed by steel beams that support a reinforced concrete slab, as shown in Figure 2(b). The bridge has two abutments at both ends, with six intermediate piers. Therefore, the selected span for measurements has an abutment at one end and a pier at other end, with a 31 m span length. We compared a conventional test
system [4][5][6][7].
(a) Elevation and plan views of bridge
(b) Bridge in three-dimensional illustration
Figure 2. General scheme of target span.
Comparison of Natural Frequencies of Vibration for a Bridge Obtained from Measurements with New Sensor Systeme
ts applicability to perform verified using a series of of a target bridge. The selected located at Yurihonjo city, Akita Prefecture, Japan. simple smart sensor were those obtained using more sophisticated and
A general view of the structure selected for this study is n Figure 1. This bridge, called Asuka Ohashi , was constructed in 1979. It spans the Koyoshi River
General view of the target structure.
The target is a girder type bridge with seven spans, as 2(a). For measurements only of the first span (encircled left span in Figure 2(a)) was selected.
The bridge structure is formed by steel beams that support a reinforced concrete slab, as shown in Figure 2(b). The bridge has two abutments at both ends, with six intermediate piers. Therefore, the selected span for measurements has an and a pier at other end, with a 31 m span We compared a conventional test method and this
(a) Elevation and plan views of bridge
dimensional illustration
General scheme of target span.
3. Vibration Measurements Plan
Vibration measurement points of the selected span are presented in Figure 3. Bolt-type sensors were located at seven points of measurements together with accelerometers to compare both results. In addition, at the middle of a s laser displacement transducer was set up near point No. 7.
(a) Elevation
(b) Plan View
Figure 3. General setup of points of measurements.
Figure 4. General setup of points of measurements Comparison of Natural Frequencies of Vibration for a Bridge Obtained from Measurements with New
Vibration Measurements Plan
Vibration measurement points of the selected span are type sensors were located at seven points of measurements together with accelerometers to compare both results. In addition, at the middle of a span a laser displacement transducer was set up near point No. 7.
Elevation
Plan View
General setup of points of measurements.
American Journal of Remote Sensing 2014;
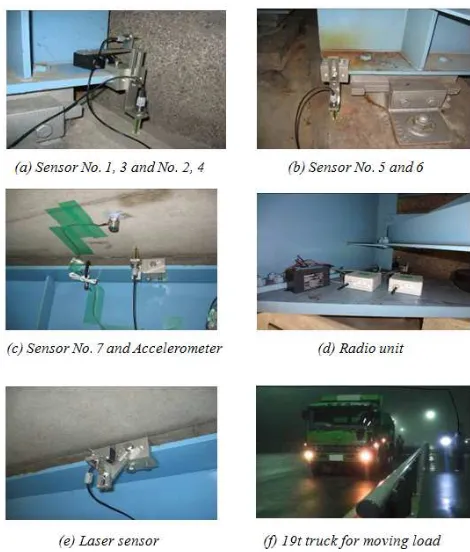
Figure 4 presents some details of the sensor setup. Fundamentally, the relative displacements between girders and support structure were measured at each point. For this purpose, sensors were fixed firmly to the girder flange with the end in contact with the support surface. Sensors 1, 2, 3, 4, 5, and 6 were set up for this method as shown in Figures 4(a) and 4(b). Figure 4(c) presents details of the accelerometer and sensor setup at point 7, which is the center of the span. Figure 4(d) shows the wireless transmission unit (radio unit) and corresponding battery. This unit receives a signal from the sensors and sends it to a computer for data acquisition. Figure 4(e) shows the setup of laser the displacement transducer. In addition, vibration caused by moving loads was measured. Figure 4(f) shows the19 t truck
for this test.
4. Characteristics of the Proposed
Piezoelectric Sensor
The basic scheme of measurement systems is presented in Figure 5. Figure 5(a) shows the proposed sensors system. Signals from piezoelectric bolt sensors are transmitted computer using a wireless module that contains a microcomputer board. As shown here, the proposed system is simple. It is easy to install in-situ. Conventional measurement systems require more equipment such as an energy generator, signal amplifiers, etc., as shown in Figure 5(b) for measurements using accelerometers.
(a) Proposed sensors system
(b) Conventional systems
Figure 5. Scheme of measurement systems.
The piezoelectric bolt sensor is shown in Figure 6(a). Fundamentally, it consists of a piezoelectric cable located in its inner core and an external cover of urethane resin resulting in a nominal 15mm diameter. The piezoelectric cable structure is shown in Figure 6(b). The piezoelectric
American Journal of Remote Sensing 2014; 2(4): 30-36
Figure 4 presents some details of the sensor setup. Fundamentally, the relative displacements between girders and support structure were measured at each point. For this purpose, sensors were fixed firmly to the girder flange with the end in contact with the support surface. Sensors 1, 2, 3, 4, e set up for this method as shown in Figures 4(a) and 4(b). Figure 4(c) presents details of the accelerometer and sensor setup at point 7, which is the center of the span. Figure 4(d) shows the wireless transmission unit (radio unit) ery. This unit receives a signal from the sensors and sends it to a computer for data acquisition. Figure 4(e) shows the setup of laser the displacement transducer. In addition, vibration caused by moving loads was measured. Figure 4(f) shows the19 t truck that was used
Characteristics of the Proposed
The basic scheme of measurement systems is presented in Figure 5. Figure 5(a) shows the proposed sensors system. Signals from piezoelectric bolt sensors are transmitted to a computer using a wireless module that contains a microcomputer board. As shown here, the proposed system is situ. Conventional measurement systems require more equipment such as an energy generator, etc., as shown in Figure 5(b) for
Scheme of measurement systems.
The piezoelectric bolt sensor is shown in Figure 6(a). Fundamentally, it consists of a piezoelectric cable located in its inner core and an external cover of urethane resin resulting in a nominal 15mm diameter. The piezoelectric Figure 6(b). The piezoelectric
film acts as an electric condenser and emits voltage when the cable is subjected to an external action that produces cable deformation, especially in cases of dynamic action or vibration[8][9].
(a) Design of vibration sens
(b) Detail of piezoelectric cable
Figure 6. Proposed piezoelectric bolt sensor.
As Figure 7(a) shows, the sensor is connected to a radio unit that sends a wireless signal to a controller that is connected to a computer. The sensor itself requires no energy. To emit its response, however, the radio unit requires a source of energy. Signals from the sensor can be monitored from an operation room, as shown in Figure 7(b). In this study, a prefabricated portable room was installed near the target bridge to conduct measurements
(a) Sensor unit
(b) Operation
Figure 7. Sensor signal transmission and general layout of control room. 32
film acts as an electric condenser and emits voltage when the cable is subjected to an external action that produces cable deformation, especially in cases of dynamic action or
Design of vibration sensor
(b) Detail of piezoelectric cable
Proposed piezoelectric bolt sensor.
As Figure 7(a) shows, the sensor is connected to a radio unit that sends a wireless signal to a controller that is connected to a computer. The sensor itself requires no input energy. To emit its response, however, the radio unit requires a source of energy. Signals from the sensor can be monitored from an operation room, as shown in Figure 7(b). In this study, a prefabricated portable room was installed near the
idge to conduct measurements [10] [11].
Sensor unit
(b) Operational room
33 Nobuhiro Shimoi et al.: Comparison of Natural Frequencies of Vibration for a Bridge Obtained from Measurements with New Sensor Systeme
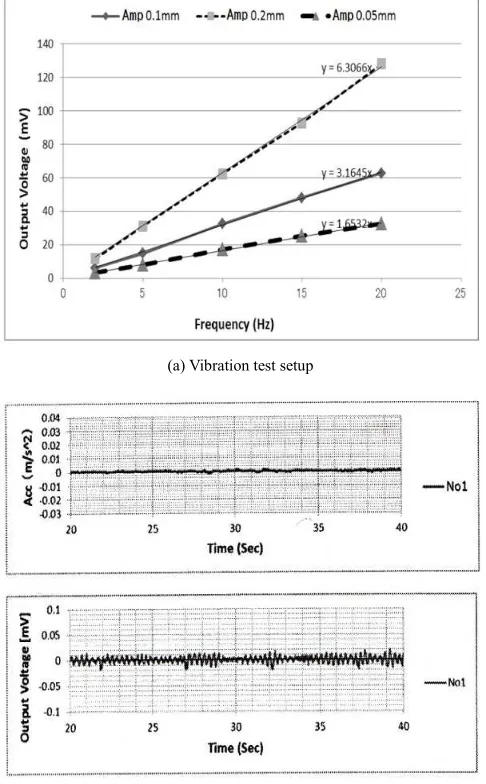
Figure 8(a) portrays the general layout of a vibration test of a bolt sensor using a small vibration machine. The test was conducted to ascertain the sensor response to dynamic actions. These tests were performed at fixed amplitudes. We consider that the sensors behave under a fixed harmonic force. For comparison, displacement of the vibration machine was measured using a laser displacement transducer. Vibration tests were performed, respectively, for 0.05 mm, 0.1 mm, and 0.2 mm of amplitude. For each amplitude value, the frequency was set up from 2 Hz to 20 Hz. The curves that relate the frequency, amplitude and the maximum output voltage of the sensor are presented in Figure 8(b).
(a) Vibration test setup
(b) Frequency and output voltage relation
Figure 8. Vibration test using bolt sensors.
5. Estimation of the Predominant
Frequency of the Target Bridge
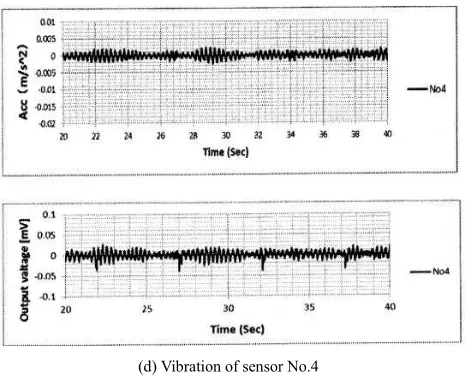
As an illustrative example of measurement results, responses at measurement points from No.1 to No. 4 are
shown in Figure 9. The upper part of Figure 9 portrays acceleration responses obtained using accelerometers. The bottom part of the figure shows the voltage output from the bolt sensors.
(a) Vibration of sensor No.1
(b) Vibration of sensor No.2
American Journal of Remote Sensing 2014; 2(4): 30-36 34
(d) Vibration of sensor No.4
Figure 9. Comparison of piezoelectric sensor and Accelerometer during vibration measurements. (Upper is Accelerometer.)
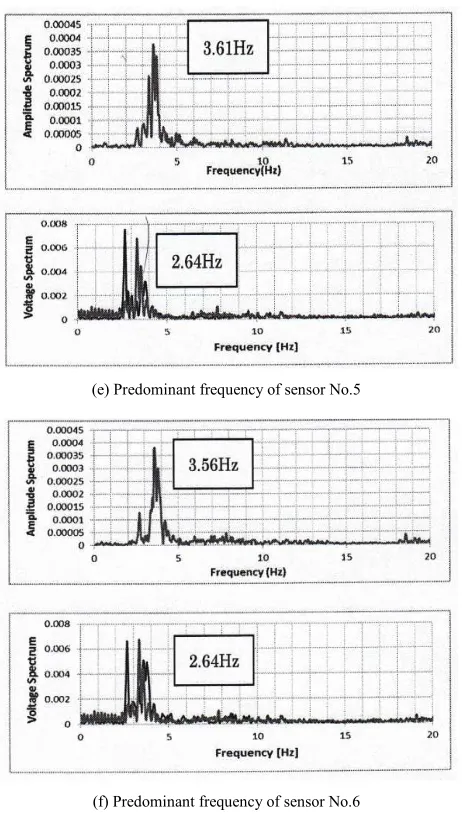
From recorded signals, predominant frequencies were obtained using Fourier analysis. In Figure 10, the Fourier spectrum for signals from points No. 1 to No. 6 are shown. The upper part of each figure corresponds to accelerometer results. The bottom part corresponds to the proposed sensor results.
Results for points No. 1, No. 2, and No. 4 exhibit good agreement between accelerometer results and the proposed sensor results. Regarding the difference of results at points No. 5 and No. 6, it we regard that the proposed sensors and accelerometers are not set up at the same location. However, in the Fourier spectrum for the proposed sensor, a second peak near 3.6 Hz is observed, which is comparable with the predominant frequencies obtained from accelerometers.
(a) Predominant frequency of sensor No.1
(b) Predominant frequency of sensor No.2
(c) Predominant frequency of sensor No.3
35 Nobuhiro Shimoi et al.: Comparison of Natural Frequencies of Vibration for a Bridge Obtained from Measurements with New Sensor Systeme
(e) Predominant frequency of sensor No.5
(f) Predominant frequency of sensor No.6
Figure 10. Comparison of predominant frequency obtained from piezoelectric sensor response and from accelerometers. (Upper plot corresponds to accelerometer.)
Figure 11. Comparison of piezoelectric sensor response and laser displacement transducer response.
Figure 11 presents a comparison of a proposed piezoelectric sensor response and the laser displacement
transducer response when the truck of 19t runs on the target span at 20 km/h. Although this measurement corresponds to relative displacement between the girder and slab and therefore only small displacement is detectable, external action (in this case the load from the truck) was captured clearly by both sensors, as shown in the disturbance at the central part of the figure.
6. Conclusion
In this research a new smart simple piezoelectric sensor and its corresponding data acquisition system were developed to be used for real time structural health monitoring of structures. Installation of the system in selected portion of selected bridge structure has permit to perform the monitoring of the structural response for free vibration and vibration in case of moving loads (vehicle loads). The applicability of this new bolt-type sensor for structural health monitoring and estimation of dynamic characteristics of a bridge structure was verified. Simultaneously commercial accelerometers were used for vibration measurements to compare with those measurements using proposed system. In general predominant frequencies obtained from in-situ measurements using accelerometers and proposed bolt sensors show good agreement.
It was also verified that proposed sensor could be used also to detected impact loads acting on bridge structures. In this case verification was done by performing measurements using moving loads from a truck of 19t. Measurements results from laser displacement transducer and proposed sensor are comparable.
Acknowledgements
The authors acknowledge the Japan Society for the Promotion of Science for a Grant-in-Aid for Scientific Research on Smart Structure Sensing System Using Piezoelectric Cable, under which this research was conducted.
References
[1] Ministry of Land, Infrastructure and Transport Report “Research on upgrading of soundness evaluation method for highway PC bridges,” Technical Notes of the National Institute for Land and Infrastructure Management, No.623, 2010, pp.6–14 (in Japanese).
[2] Asahi Shimbun, “Land transport services development table 121 bridge,” 2009 (in Japanese).
[3] N. Shimoi, C.H. Cuadra, H. Madokoro, and M. Saijo, “Simple Smart Piezoelectric Bolt Sensor for Structural Monitoring of Bridges,” International Journal of Instrumentation Science,
vol.1, No.5, 2012, pp.78–83, doi:
10.5923/j.instrument.20120105.03.
American Journal of Remote Sensing 2014; 2(4): 30-36 36
[5] Fu-kuo. Chang, “The Demands and Challenges,” Proceedings of the 3rd International Workshop on Structural Health Monitoring, Stanford, CA: Stanford University, 2001, pp.1–8.
[6] M. Nakamura and Y. Yasui, “Damage Evaluation of a Steel Structure Subjected to Strong Earthquake Motion Based on Ambient Vibration Measurements,” Journal of Structural and Construction Engineering. Transactions of AIJ, vol.517, 1999, pp.61–68 (in Japanese).
[7] T. Okabayashi, T. Okumatsu, and Y. Nakamiya, “Experimental Study of Structural Damage Detection Using the High Accurate Structural Vibration-Estimation System,” Journal of Structural Engineering A, vol.51A, 2005, pp.479–490 (in Japanese).
[8] S. Kurosaki, Y. Sasaki, and S. Izumi, “Trial of Measurements
for Axial Force of Bolt Using Piezo Cable,” Journal of the Japanese Society for Non-Destructive Inspection, vol.56 (3), 2007, pp.149–154 (in Japanese).
[9] Y. Nitta, K. Imamoto, and A. Nishitani , “Structural Health Monitoring using Piezoelectric Cable,” Summaries of Technical Papers of Annual Meeting Architectural Institute of Japan. B-2, Structures II, Structural Dynamics Nuclear Power Plants, 2006, pp.891–892 (in Japanese).
[10] Tokyo Sensor Co., Ltd. , “Piezoelectric Cable,” Traffic Sensors, 2010, pp.18–19 (in Japanese).
[11] Tokyo Sensor Co., Ltd. , “Piezo Film Technical Manual,” V1.0,
R1, 2001, pp.17–18 (in Japanese).