Covariance-based Clustering in Multivariate and Functional
Data Analysis
Francesca Ieva [email protected]
Department of Mathematics “F. Enriques” Universit`a degli Studi di Milano
Via Cesare Saldini 50, 20133 Milano, Italy
Anna Maria Paganoni [email protected]
Nicholas Tarabelloni [email protected]
MOX – Modeling and Scientific Computing Department of Mathematics
Politecnico di Milano
Via Bonardi 9, 20133 Milano, Italy
Editor:Sara van de Geer
Abstract
In this paper we propose a new algorithm to perform clustering of multivariate and func-tional data. We study the case of two populations different in their covariances, rather than in their means. The algorithm relies on a proper quantification of distance between the estimated covariance operators of the populations, and subdivides data in two groups maximising the distance between their induced covariances. The naive implementation of such an algorithm is computationally forbidding, so we propose a heuristic formulation with a much lighter complexity and we study its convergence properties, along with its computational cost. We also propose to use an enhanced estimator for the estimation of discrete covariances of functional data, namely a linear shrinkage estimator, in order to improve the precision of the clustering. We establish the effectiveness of our algorithm through applications to both synthetic data and a real data set coming from a biomedical context, showing also how the use of shrinkage estimation may lead to substantially better results.
Keywords: Clustering, covariance operator, operator distance, shrinkage estimation, functional data analysis
1. Introduction
of data that are scarcely distinguishable in terms of locations, while showing differences in their variability.
Examples can be found in biostatistics where, for instance, the dichotomy between physio-logical and pathophysio-logical features often shows an interesting change in pattern of variability. Also, this is of great interest in genomics, where instead of focusing on gene expression lev-els, one could be interested in finding different correlation structures among subsets of data. This is the core task in the analysis of the differential co-expression of genes, namely the differential correlation structure among expression levels in different subsets of experimen-tal conditions. In (Watson, 2006), for instance, the author proposes a method to identify groups of genes that are correlated in a first group of microarrays, and are not in a second one. In (Mitra et al., 2016), the authors provide a more complex modeling strategy that is able to specify the differential dependence structure by using Bayesian graphical models, and in (Cai and Zhang, 2016) authors provide, within a supervised framework, a way to es-timate the differential correlation matrices of data belonging to two differentially expressed groups.
In this paper we tackle the problem from a different point of view, and focus on differences between global covariance structures of data belonging to two unknown groups, which will also be identified. We focus on the specific case of a set of observations from two popula-tions whose probability distribupopula-tions have the same mean but differ in terms of covariances. The method we propose can be applied both to the traditional case of random vectors, and to the recently developed setting of functional data, arising as outcomes of infinite-dimensional stochastic processes (see, for instance, the monographs Ramsay and Silverman, 2005; Horv´ath and Kokoszka, 2012). We will introduce the method according to the latter case.
In particular, we first introduce a suitable notion of distance between covariance operators, i.e. the functional generalisation of covariance matrices, which is the instrument we use to measure dissimilarities. Then we make use of such distance to search, among two-class partitions of data, the one maximising the distance between the class-specific covariances, under the assumption that, if the two populations can be distinguished from their covari-ances, this would be the most likely subdivision detecting the true groups.
A naive implementation of this algorithm, involving an exhaustive sampling strategy inside the set of subsets of data, would face a combinatorial complexity with respect to the number of observations, thus forbidding the analysis of data sets with common sizes. We therefore transform the method into a heuristic, greedy algorithm, with greatly reduced complexity, which can be efficiently implemented and effectively applied.
The paper is organised as follows: in Section 2 we briefly recall some properties of covari-ance operators for functional data. In Section 3 we introduce the new clustering method for two groups of data which differ in variance-covariance structures, we derive its heuristic formulation and describe the shrinkage strategy we used to enhance the estimation perfor-mances. In Section 4 we assess the clustering performances through the application to both synthetic and real data sets. Discussion and conclusions are presented in Section 5.
2. Covariance Operators for Functional Data
Whenever our data can be interpreted as finite-dimensional samples of quantities that are intrinsically dependent on some continuous variable, such as time, we may resort to the model of functional data (see, for instance, Ramsay and Silverman, 2005; Horv´ath and Kokoszka, 2012). At its core is the assumption that data are sample measurements of trajectories of stochastic processes valued in suitable function spaces.
In the following we recall the definition of covariance operator for functional data, along with its most important properties (for more details see, e.g., Bosq, 2000). Let X be a stochastic process taking values in L2(I), with I ⊂ R a compact interval, having mean function E[X] = µ and such that EkX k2 <∞, where we denote by k · k the L2(I) norm induced by the scalar product h·,·i. Without loss of generality we can assume µ = 0 and define the following covariance operator C ∈ L L2(I);L2(I)
:
hy,Cxi=E[hx,X ihy,X i], ∀x, y∈L2(I). (1) C is a compact, self-adjoint, positive semidefinite linear operator between L2(I) andL2(I). Therefore it can be decomposed into:
C= ∞
X
k=1
λk ek⊗ek, (2)
where⊗indicates an outer product inL2(I),{ek}∞k=1 is the sequence of orthonormal
eigen-functions, forming a basis ofL2(I), and{λk}∞k=1 is the sequence of eigenvalues. We assume that eigenvalues are sorted in decreasing order, so that:
λ1 ≥λ2≥. . .≥0.
By expressing X with respect to the eigenfunctions basis,X =P∞
k=1ξkek, it holds
λk=hek,Ceki=Eξk2
,
thus, the covariance operator is nuclear, meaning that
EkX k2= ∞
X
k=1 λk=
∞
X
k=1
|λk|<∞.
C is also a Hilbert-Schmidt operator (see, for instance, Bosq, 2000), since it holds:
∞
X
k=1
We equip the space of Hilbert-Schmidt operators with the Hilbert-Schmidt norm, defined as kU k2
S =
P∞
k=1λ2k, where{λk}
∞
k=1 are the eigenvalues ofU. This is induced by the following scalar product:
hU,ViS =
q
Tr (U − V) (U − V)∗, (4)
where Tr(·) denotes the trace operator, and U∗ is the Hilbertian adjoint ofU, i.e.,
hU(x), yi=hx, U∗(y)i ∀x, y∈L2(I).
The space of Hilbert-Schmidt operators onL2(I), endowed with the scalar product (4) and the associated norm, becomes a separable Hilbert space itself.
Within this theoretic framework, a natural definition of dissimilarity between Hilbert-Schmidt operators (among which are covariance operators) may be the Hilbert-Hilbert-Schmidt distance:
d(U,V) =kU − Vk2S = ∞
X
k=1
η2k, (5)
where{ηk}∞k=1 is the sequence of eigenvalues ofU − V. 3. Covariance-based Clustering
We face now the problem of classifying observations belonging to two different functional populations. Let X and Y be stochastic processes on L2(I) generated by the laws PX and PY. We imagine to have a set of N data in some data set D (i.e., a collection of observations) composed in the following way by an equal number of observations from two families: D = {X1, . . . , XK, Y1, . . . , YK}, with K = N/2 and where {Xi}Ki=1,{Yj}Kj=1 are
i.i.d and follow respectivelyPX andPY. We introduce the following quantities:
µ1 =E[Xi], C1 =E[Xi⊗Xi], ∀i= 1, . . . , K,
µ2 =E[Yj], C2=E[Yj ⊗Yj], ∀ j= 1, . . . , K.
Let us consider the vector of indexes of units constituting the two populations inD:
I(0)=
I1(0)
z }| {
1,2, . . . , K,
I2(0)
z }| {
K+ 1, . . . , N
, (6)
which is unique, provided we don’t distinguish among permutations of sub-intervalsI1(0) and I2(0). In the following we shall consider recombinations of these indexes into two subsets:
I(i)=
I1(i); I2(i)
, i∈ {1, . . . , NC}, (7)
whereI(i) denotes the i-th combination out ofNC = NK
, however enumerated.
The sample estimators of means and covariance operators induced by this subdivision are denoted, respectively, withµb
(i) 1 ,µb
(i) 2 andCb
(i) 1 ,Cb
(i)
µ(0)1 ,µ(0)2 , andC1(0),C2(0).
Our clustering method is based on the following, crucial assumption:
Assumption 1 We assume that observations drawn from families PX andPY constituting
the data setDmay be distinguished on the basis of their covariances, but not of their means,
i.e. µ(0)1 =µ(0)2 and C1(0)6=C2(0), and therefore kµ1(0)−µ(0)2 k= 0 and d(C1(0),C2(0))0.
As a consequence of this assumption we conveniently center data and assume they have zero means.
In order to illustrate the clustering method we propose, let us consider a situation where the original data set has been split according to a vector of indices I(i) = [I1(i);I2(i)]. For the sake of simplicity, let us encode this through the binary variables wj,g =1(Xj ∈Ig(i)),
j= 1, . . . , K,g= 1,2, andvj,g =1(Yj ∈Ig(i)),j = 1, . . . , K,g= 1,2. In other words, such
variables express the fact that observation j from the original population X orY belongs to the first (I1(i)) or second (I2(i)) group into which data are split. According to the setting previously introduced, it is:
K = 2
X
g=1
K
X
j=1
wj,g, K=
2
X
g=1
K
X
j=1 vj,g,
K=
K
X
j=1 wj,1+
K
X
j=1
vj,1, K=
K
X
j=1 wj,2+
K
X
j=1 vj,2.
Then, we can re-write the sample covariances Cb
(i) 1 and Cb
(i) 2 as:
b
C1(i) =
PK
j=1wj,1Xj⊗Xj+
PK
k=1vk,1Yk⊗Yk
K ,
b
C2(i) =
PK
j=1wj,2Xj⊗Xj+PKk=1vk,2Yk⊗Yk
K .
If we compute the differenceCb
(i) 1 −Cb
(i)
2 , we obtain:
b
C1(i)−Cb
(i) 2 =
1 K
K
X
j=1
(wj,1−wj,2)Xj ⊗Xj+
1 K
K
X
k=1
hence, exploiting the distance between covariance operators:
K2kCb
(i) 1 −Cb
(i) 2 k2S=
K X j=1
(wj,1−wj,2)Xj⊗Xj
2 S + K X j=1
(vj,1−vj,2)Yj⊗Yj
2 S + + 2 K X j=1 K X k=1
(wj,1−wj,2) (vk,1−vk,2)hXj, Yki2
=
K
X
j=1
kXj⊗Xjk2S+ 2
X
j<k
(wj,1−wj,2) (wk,1−wk,2)hXj, Xki2+
+
K
X
j=1
kYj⊗Yjk2S+ 2
X
j<k
(vj,1−vj,2) (vk,1−vk,2)hYj, Yki2+
+ 2 K X j=1 K X k=1
(wj,1−wj,2) (vk,1−vk,2)hXj, Yki2.
(8)
Let us now callδXj,k= (wj,1−wj,2) (wk,1−wk,2),δj,kY = (vj,1−vj,2) (vk,1−vk,2) and δXYj,k =
(wj,1−wj,2) (vk,1−vk,2). Now, it is: δj,kX = +1 if observations Xj and Xk are assigned to
the same group, while on the contrary it isδXj,k=−1. The same applies forδj,kY withYj and
Yk. Finally, δj,kXY = +1 if Xj and Yk are assigned to different groups, and δXYj,k =−1 on the
contrary. It is now clear that, the distance between covariance operators is increased when two observations of populations X orY are both assigned to the same group, or when two observations of the opposite populations X and Y are assigned to different groups. These remarks suggest the idea that, under the previous assumption, by recovering the original labelling of the two populations X and Y the distance between the induced covariance op-erators is increased.
If we replace the estimators of covariance operators in (8) with their expected values,
E
h b
C1(i)i=C1(i)=
PN
j=1wj,1 K C1+
PK
j=1vj,1 K C2, E
h b
C2(i)i=C2(i)=
PN
j=1wj,2 K C1+
PK
j=1vj,2 K C2,
then, by denoting N1,2 =PKj=1wj,2 and also considering the relations among the variables wj,g and vj,g we get:
d(C(1i),C2(i)) =
E
h b
C1(i)i−EhCb
(i) 2 i 2 S =
1−2N1,2 K
2
If assumption (1) is true and in view of (9), a natural way to recover the true indexing can be to find the recombination of data in two groups maximising the distance between the induced covariance operators, i.e., to solve the optimization problem:
[I1∗;I2∗] = arg max
i∈RC n
d
C1(i),C2(i)o, RC ={1, . . . , NC}. (P)
Identity (9) ensures that either I1∗ =I1(0) and I2∗ =I2(0), or I1∗ = I2(0) and I2∗ = I1(0). The double solution is due to the symmetry of (9), yet the groups represent the same partition of data, for this reason in the following we will not distinguish between them.
Practically, only approximate estimates of C1(i) and C2(i) are available, thus we must recast problem (P) into:
h b
I1∗;Ib2∗ i
= arg max
i∈RC n
dCb
(i) 1 ,Cb
(i) 2
o
, RC ={1, . . . , NC}, ( ˆP)
The method we propose coincides with finding a solution to problem ( ˆP). In general Ib1∗ and Ib2∗ may differ from I
(0) 1 and I
(0)
2 , since they are determined based on estimates of covariance operators. Indeed, provided that the chosen distance is capable of emphasizing the actual differences between covariances of the two populations, results could be improved by enhancing the accuracy of estimators. In Subsection 3.2 we will address the former issue.
3.1 Greedy formulation
In order to solve problem ( ˆP), it would be required to test each of the NC recombinations
of indexes in order to find the desired pair Ib1∗ and Ib2∗. Of course, the number of tests
to be performed, NC = NK
, with K = N/2, undergoes a combinatorially-fast growth, as N increases. Thus, unless we have only a small number of observations in our data set, the naive approach of performing an exhaustive search in the set of recombinations is not feasible. This calls for a proper complexity-reduction strategy, aimed at restraining the complexity and enabling the application of our method also to data sets with a common size.
3.1.1 Max-Swap algorithm
We propose to rephrase problem ( ˆP) into a greedy algorithm, with a greatly reduced com-plexity. The driving idea is to interpret d(Cb
(i) 1 ,Cb
(i)
2 ) as an objective function of i, and, starting from an initial guess (I10, I20), to iteratively increase it by allowing exchanges of units between the two groups. The exchange of data must preserve the total number of units inside each group, so each group discards and receives an equal number of units, say up to J per group.
This strategy can be also motivated by (8), since it performs swaps between observations in order to increase kCb
(i) 1 −Cb
(i)
2 k, thus trying to assign the correct values to wj,g and vj,g.
Algorithm 1:Max-Swap algorithm Input: Initial guess: I0
1, I20
Output: Estimated indexingIb1∗∗,Ib2∗∗
Compute Cb10,Cb20
induced by I0 1, I20
;
d0 =dCb10,Cb20
;
k= 1; (∆d)k = 1;
while (∆d)k>0 do for s∈1, . . . , K do
for t∈1, . . . , K do
Swap in first group: I˜1 =Sp6=sI k−1 1 (p)∪I
k−1 2 (t); Swap in second group: ˜I2 =Sq6=tI
k−1 2 (q)∪I
k−1 1 (s); Compute
e
C1,Ce2
induced by ( ˜I1,I˜2); Ds,t =d
e
C1,Ce2
;
(s∗, t∗) = arg maxs,tDs,t;
dk=Ds∗,t∗;
(∆d)k =dk−dk−1; Ik
1 =
S
p6=s∗I1k−1(p)∪I2k−1(t∗);
I2k=S
q6=t∗I2k−1(q)∪I1k−1(s∗);
k=k+ 1;
d∗∗=dk−1; I1∗∗=I1k−1; I2∗∗=I2k−1;
When searching the best swap of size up toJ, we must explore a number of combinations of the current groups equal to PJ
i=1
K i
2
. Therefore it is evident that J affects both the computational effort and the robustness of our algorithm: the lower is J, the less permutations we have to search among to find the optimal swap; the greater isJ, the more likely we are to detect and exchange at once a block of truly extraneous units. We point out that, for J =K we recover the original complexity of solving problem ( ˆP) in just one step, since it holds:
N K = K X i=0 K i 2 = K X i=1 K i 2
+ 1.
the second group. Then we select the one yielding the maximum increment in the distance. The complete formulation of our Max-Swap algorithm is summarised in Algorithm 1, where we specify for the sake of clarity that the symbol I1k(p), for instance, indicates the p-th element of the set of indexesI1k. In the following we will denote the estimated set of indexes at step kof algorithm with superscript kwithout brackets, (I1k,I2k).
3.1.2 Convergence
We turn now to the study of the convergence of our proposed algorithm. With reference to the notation of Algorithm 1, it is easy to prove that
Proposition 1 The monotonicity constraint:
(∆d)k>0 ∀k≥1, (10)
ensures that convergence always happens, at least to a local maximum of d(Cb
(i) 1 ,Cb
(i) 2 ). Proof As a simple consequence of (10), the list of intermediate indexings:
I10, I20
, I11, I21
, . . . ,I1k, I2k, . . .
does not have cycles (a contiguous sub-sequence with equal extrema). In fact, let there be a cycle of minimal periodL starting at iterationk0, then it should hold:
0 =dk0+L−dk0 =
L
X
j=1
(∆d)j+k0 >0,
which is a contradiction. Thus each element in the list is unique and contained in the set of all the possible recombinations of data:
(I1(0), I2(0)),(I1(1), I2(1)), . . . ,(I(NC)
1 , I (NC)
2 ),
which has a finite number of elements. Therefore the algorithm, however initialised, con-verges.
Now that convergence has been established, we can formulate the following proposition:
Proposition 2 When estimates of covariance operators, Cb1 and Cb2, are exact, i.e., when b
C1=C1 andCb2=C2, the greedy algorithm converges to the exact solution(I1∗, I2∗)of problem
(P) in at most K/2 steps.
Proof This is a consequence of Proposition 1 and the convexity of the objective function d(C1(i),C2(i)) w.r.t N1,2 showed in (9), making it impossible that local maxima exist.
A consequence of Proposition 1 is that in general (I1∗∗, I2∗∗) 6= (Ib1∗,Ib2∗), since the algorithm
and the development of possible remedies is a very active research field in algorithmics and optimization disciplines. A simple way to correct for the possibility to select only a local optimum is to implement a restart-like strategy, namely run multiple instances of the al-gorithm with different initialisations and to select the best results in terms of optimised objective function. This is a simple and classic solution to the drawbacks of general local-optimisation algorithms.
However, Proposition 2 assures that the algorithm converges to the exact solution, provided that we have a thorough knowledge of covariance operators. Therefore, the possible non-convexity of the objective function d(C1(i),C2(i)), being the reason why local maxima exist, would be a direct consequence of the small precision in estimating covariances.
Under this light, we can rephrase the problem of enhancing our method from finding an algorithmics-like remedy to the aforementioned drawback, to the study of accuracy proper-ties of covariance estimators. This will be the focus of Subsection 3.2. Another possibility to reduce the risk of selecting only local maximisers, which we don’t investigate in the fol-lowing, would be to assess the stability of the maximiser found when running a standard Max-Swap algorithm by running a general version of Max-Swap with J >1.
3.1.3 Rate of convergence and complexity
Max-Swap algorithm increases the objective function starting from an initial guess, (I10, I20). In general, we have no prior knowledge on the distribution of true groups among the data set, then we should choose the initial guess at random, and in particular by drawing from the set of indexes without replacement, assigning equal probability to each outcome. This strategy causes the quantityN1,2 in (9) to follow a hypergeometric distribution:
N1,2 ∼Hyper(N, K, K), i.e.,
P(N1,2 =h) =
K h
K
K−h
N K
, E[N1,2] =
K 2,
with typically large values of N and K =N/2. Owing to the fast decay of hypergeometric mass function away from its mean, we can presume that the random initial draw will cause N1,2 to be most likely in some neighbourhood ofK/2 (we imagineK to be even).
Let us assume that hypotheses of Proposition 2 are true, then if we consider a value for N1,2 resulting from the initial guess, the number of iterations to convergence is Nit = min(N1,2, K−N1,2), corresponding to Nit consecutive and correct swaps.
Then, by initialising at random the algorithm:
Nit ≤ K
2.
If we summarise the complexity of solving problem ( ˆP) with the number of combinations Ncomb processed to recover the estimated groups (I1∗, I2∗), and we compare our proposed method (MS) with the naive, exhaustive strategy (N), we have:
NcombM S =K2 Nit ≤ K3
2 , N
N comb =
N K
where the multiplicative factor K2 in NcombM S accounts for the number of combinations searched for to find the best swap at each step of Max-Swap algorithm.
This shows how Max-Swap algorithm entails a far lower complexity than the brute force approach.
3.1.4 Classification of new observations
Once the algorithm has been run and the two groups constituting the mixed data set have been found, a simple rule can be applied to use the clusters in order to classify new observations. We suggest to consider each new unit separately, and compute the covariances obtained by including the unit either in the first or second group. For the sake of simplicity, we denote them, respectively, byCe1 andCe2. Then we compute the distances ˜d1 =d(Ce1,Cb1)
and ˜d2 =d(Ce2,Cb2), where here we indicate byCb1 and Cb2 the covariances of the two groups
determined at the end of the clustering stage. Then we attribute the new unit to the group for which the distance ˜dis minimum.
3.2 Shrinkage estimation of covariance
In this subsection we consider the problem of improving the estimation of covariance op-erators, so that clustering is more accurate. In particular, we will describe an alternative estimator of data covariance than the sample covariance, which is better conditioned and in some circumstances achieves lower MSE. We will make use of it in our clustering algorithm as an alternative to sample covariance.
Let us consider a generic family of functional dataX ∼PX, such that E[X] = 0,EkX k2< ∞. We denote its covariance with C and we imagine to estimate it withC. Our purpose isb
to find its best possible approximation, or saying it otherwise, being:
MSES(C) :=b EkC − Ckb 2S ,
our measure of the estimation error of C, to solve the following estimation problem (E):b
b
C∗ = arg min
b C
MSES(C) = arg minb
b C
EkC − Ckb 2S , (E)
where the minimum is sought among all possible estimators Cbof C. We point out that in
MSES we use our selected distance to measure the discrepancy of estimation.
Of course, from a practical viewpoint, only a finite-dimensional estimation of C can be attained, given data. In addition, functional data are often available from sources as discrete measurements of a signal over some one dimensional grid. Let us indicate by Xi the i-th
(out ofN) sample realisation of processX, i.e,:
Xi = (Xi(tj))Pj=1, Ih = [t1, . . . , tP], (11)
where, for the sake of simplicity, we have imagined the grid Ih to be regularly spaced (al-though this is not mandatory), i.e., tj+1−tj =h >0 forj = 1, . . . , P −1. A crucial point
Xi, which requires the use of some proper smoothing technique. Furthermore, the so called
phase variability of reconstructed signals, involving the dispersion of features along the grid axis, can be separated fromamplitude variability, appearing as the dispersion of magnitudes of values of Xi. This process is known as registration (see, for instance, Ramsay and
Sil-verman, 2005). Once data have been smoothed and registered, they can be re-evalued onto another one dimensional grid. To save notation we will assume that discrete representations in (11) have already been preprocessed.
It is clear that, within this habit, covariance estimators of C are discrete, matrix-type approximations obtained starting from pointwise observations Xi. For instance, standard
sample covariance estimator for zero-mean data is:
S= 1 N
N
X
i=1
Xi XiT. (12)
If we denote the true, discrete covariance structure related to each Xi by C the discrete
version of problem (E) is:
C∗ = arg min
b C
EkCb −Ck2F , (E)ˆ
where the minimum is sought inside the set of symmetric and positively defined matrix-type estimators of dimensionP. We point out that the subscript F in (E) indicates the Frobeniusˆ norm, that is the finite-dimensional counterpart of the Hilbert-Schmidt norm for operators.
When the sample size N is low compared to the number of features P, sample covariance may loose in accuracy, meaning that the actual estimate might be quite distant from the true covarianceC (this can be seen as a consequence of the so-calledStein’s phenomenon, Stein, 1956).
A typical remedy to the poor performances of sample covariance, often used in the setting
of Large P - Small N problems, is to replace it with a biased, shrinkage estimator. Other
solutions might be jackknife or bootstrap, but their computational cost renders them prac-tically useless in our clustering algorithm, which requires to repeatedly estimate covariance matrices. Shrinkage estimation has been explicitly applied to the context of large covariance matrices in (Ledoit and Wolf, 2003, 2004) and (Schafer and Strimmer, 2005), turning out in a sufficiently lightweight procedure. In those works, authors start from problem (E) andˆ build an estimator that is asymptotically more accurate and better conditioned than sample covariance. We follow the approach described in (Ledoit and Wolf, 2004) and consider the class of linear shrinkage estimators of the form:
b
C=µγI+ (1−γ)S, (13)
whereI is theP×P identity matrix andγ ∈[0,1], µ∈R+ and S is the sample covariance estimator. Obviously, the class contains the sample covariance estimator itself. Then (E)ˆ is solved with respect to the optimal values ofµ and γ:
(µ∗, γ∗) = arg min
µ,γ E
kC−µγI−(1−γ)Sk2
F
If we introduce the quantities:
α2 = kC−µIk 2
F
P , β
2 = EkS−Ck2F
P , δ
2 = E kS−µIk2F
P , (15)
and note that these are subjected toα2+β2=δ2, we can perform the explicit minimization in equation (14). The expressions ofµ∗ and γ∗ are:
µ∗= hC,IiF
P =
Tr (C)
P , γ
∗ = β2
δ2, (16)
where we have used µ = µ∗ in the computation of δ. The desired shrinkage estimator becomes:
S∗ =µ∗β 2 δ2I+
α2
δ2S. (17)
Of course, estimator (17) depends on the unknown exact covariance matrixC, even though only through four scalar functions. In (Ledoit and Wolf, 2004) authors solve this problem by proposing the following estimators for α,β,δ and µ∗:
b
µ∗ = Tr (S)
P , δb
2 = kS−bµ
∗Ik2
F
P , (18)
c
β2 = min δb2; 1 N2
N
X
k=1
kXk XkT −Sk2F
P
!
, (19)
and cα2 =δb2−βc2.
Then, the actual shrinkage estimator is:
b
S∗ =cµ∗ c
β2
b
δ2I+
c
α2
b
δ2S. (20)
In (Ledoit and Wolf, 2004) authors show how estimates (18) are consistent, in the sense that they converge to the exact values in quadratic mean, under the general asymptotic limits of P andN, i.e., when bothP andN are allowed to go to infinity but there exists ac∈R independent onN such thatP/N < c(see Ledoit and Wolf, 2004 and references therein for theoretical details on general asymptotics). Moreover, estimator Sb∗ is an asymptotically
optimal linear shrinkage estimator for covariance matrixCwith respect to quadratic loss. Besides its asymptotic properties, extensive use in applications shows that the accuracy gain resulting fromSb∗in terms of decrease in MSE is substantial also in many finite sample cases,
and that standard covariance is almost always matched and often outperformed bySb∗. For
a detailed description of how and when shrinkage estimation of covariance is recommended over the sample estimation, see for instance (Ledoit and Wolf, 2004).
4. Case Studies
give a clear geometric idea of clustering based on covariance structures. In Subsection 4.2 we show an application to synthetic functional data. In these former two examples the true subdivision of samples is known, so the goodness of the clustering arising from Max-Swap algorithm is assessed against the true identities of data. In Subsection 4.3, instead, we apply the clustering algorithm on real functional data expressing the concentration of deoxygenated hemoglobin measured in human subjects’ brains.
4.1 Multivariate data
This test is meant to provide a first, visual example of the features of the clustering aris-ing from usaris-ing Max-Swap algorithm. In order to ease the geometrical interpretation, we chose to focus on two bivariate data sets, composed of simulated data with a-priori designed covariances. Indeed, by representing bi-dimensional data we are able to support our con-siderations with a clear graphical counterpart.
We exploit two reference data sets having the same means but different variance-covariance structures. In particular, a generic clustering based on locations run on these data is meant to fail. The first set of data, hereafter hourglass data, has covariances whose difference lies in the directions along which variability expresses. We generated it according to the following laws:
X =ρx cosθx, sinθx
, ρx ∼ U[−1,1], θx ∼ U
π
12, 5π
12
,
Y =ρy cosθy, sinθy
, ρy ∼ U[−1,1], θy ∼ U
7π
12, 11π
12
,
where the four random variables, ρx, ρy, θx, θy are independent. Simple calculations reveal
thatE[X] = 0 and E[Y] = 0, while covariances are:
Cx=
1
/6 √
3/4π √
3/4π 1/6
, Cy =
1
/6 − √
3/4π −√3/4π 1/6
.
Note thatX andY differ only in their covariances. Moreover, since only off-diagonal terms of Cx and Cy are different (and indeed opposed), the two families have the same kind of
variability, only expressed along orthogonal directions in the plane. We generate a data set D of N = 400 data, according to the previous laws, made up of K = 200 samples fromX and K= 200 samples fromY, which are displayed in Figure 1.
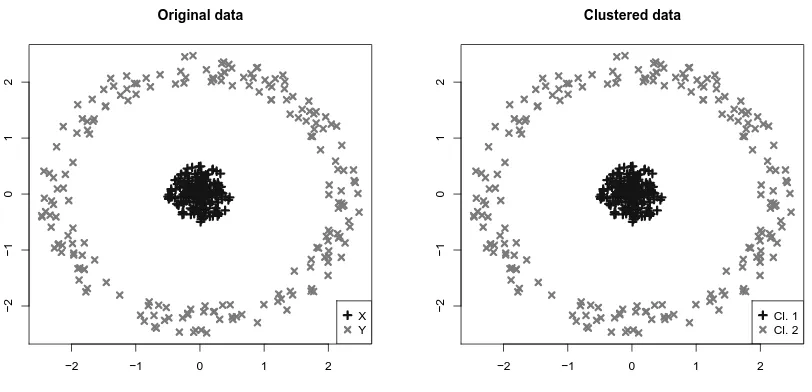
We considered also another data set, referred to asbull’s eye, whose features are somehow complementary to the ones of hourglass, since variabilities of bull’s eye sub-populations express along the same directions, though with different magnitudes. In particular, we considered the following laws:
X=ρx cosθx, sinθx
, ρx ∼ U
0,12
, θx ∼ U[0,2π],
Y =ρy cosθy, sinθy
, ρy ∼ U
2,52
, θy ∼ U[0,2π],
where, still, the four random variables ρx, ρy, θx, θy are independent. This leads to
covari-ances:
Cx =
1
−0.5 0.0 0.5 1.0
−1.0
−0.5
0.0
0.5
1.0
Original data
X Y
−0.5 0.0 0.5 1.0
−1.0
−0.5
0.0
0.5
1.0
Clustered data
Cl. 1 Cl. 2
Figure 1: Left: Hourglass data set used in the first multivariate experiment, collecting N = 400 points subdivided into family X (K = 200 points, marked by +) and family Y (K = 200 points, marked by ×). Right: Outcome of clustering via Max-Swap algorithm.
−2 −1 0 1 2
−2
−1
0
1
2
Original data
X Y
−2 −1 0 1 2
−2
−1
0
1
2
Clustered data
Cl. 1 Cl. 2
that clearly differ only in terms of their variability’s magnitude. Bull’s eye data set is generated according to these laws for an overall cardinality ofN = 400 data subdivided in two groups of sizeK = 200 each, and it is shown in Figure 2.
We point out that, in order to improve the robustness of results with respect to the chance of selecting only a local maximiser of the distance between variance-covariance structures, Max-Swap algorithm was run for 10 times, keeping the result for which the objective function was highest. Since the number of data in each sub-population, K, is high with respect to their dimensionality,P = 2, we used Max-Swap algorithm in combination with the standard sample estimator of covariance, S. The results of the clustering procedure are also shown in Figure 1 and Figure 2 (right panels), where it is clear how the clustering method is able to detect the observations belonging to the two populations, whose difference is is only in their covariances. Since in this simulated scenario we know the law generating observations, and therefore the labels of the generated data, we are able to assess the performances of the clustering procedure by comparing the two identified groups of data with the original labels. In particular, in the case of hourglass data, only 3 observations out of 200 in each cluster belong to the other population, and are all located very close to the data centre. In the bull’s eye example, instead, the two clusters are composed of elements coming from only one population.
The outcome of standard clustering algorithms, like K-means or hierarchical clustering, show the complete inefficacy of location-based clustering for such data sets, where data are mostly different in terms of their variability. In particular, 20 K-means (K = 2) runs on Bull’s eye and Hourglass data sets yield, if compared with the true labelling of observations, a mis-classification rate of 0.27±0.01 and 0.47±0.01, respectively, while 20 runs of a hierarchical clustering with euclidean distance and Ward linkage give a mis-classification rate of 0.29±0.05 and 0.46±0.04, respectively.
4.2 Synthetic functional data
In this subsection we apply our clustering algorithm to functional data. We use a data set composed of two populations of functions, X and Y, with null means and covariance operators:
Cx =
L
X
i=1
σi ei⊗ei, Cy = L
X
i=1
ηi ei⊗ei, (21)
where {ei}Li=1 are the first L elements of the orthonormal Fourier basis on the interval I = [0,1], save for the constant, i.e.,:
e2k−1 = √
2 sin (2kπx), e2k=
√
2 cos (2kπx), x∈I,
fork= 1, . . . , L/2, and the eigenvalues are chosen as:
σi = 1, ηi =
σi
√
5, ∀ i= 1, . . . , L. (22)
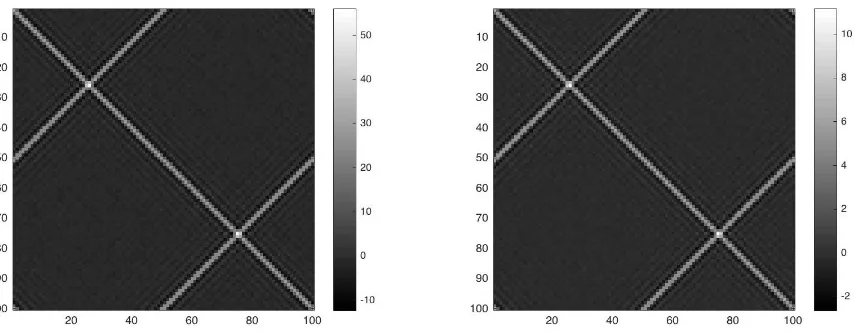
Figure 3: Contour plot of covariancesCxandCyfor the experiment with synthetic functional
data. The different scales of contour plots show that the difference between the variance-covariance structures is only in magnitude.
Cy are different only in terms of variability’s magnitudes, while their eigenfunctions are the same.
We generated several sets of the following synthetic families of Gaussian functional data having covariances like in (21):
Xi= L
X
j=1 ξij
√
σj ej, Yi= L
X
j=1 ζij
√
ηj ej, (23)
for i = 1, . . . , K, where ξij i.i.d
∼ N(0,1), and are independent from ζij i.i.d.
∼ N(0,1). Each synthetic functional unit has been evaluated on a grid of P = 100 points, evenly spaced on I. The different sets have been generated choosing K ∈ {20,25,30, 35, 40,45,50}, corre-sponding to total cardinalities ofN ∈ {40,50,60,70,80,90,100}.
We applied our clustering algorithm to each synthetic data set. The different values of K (i.e., of N) allow to study the performances of clustering as the sample size increases. This is of interest since our method relies on the estimation of covariance matrices, thus we expect that when the number of data increases the performances tends to improve.
We used Max-Swap algorithm both with the standard sample covariance estimator,S, and with the shrinkage covariance estimator Sb∗.
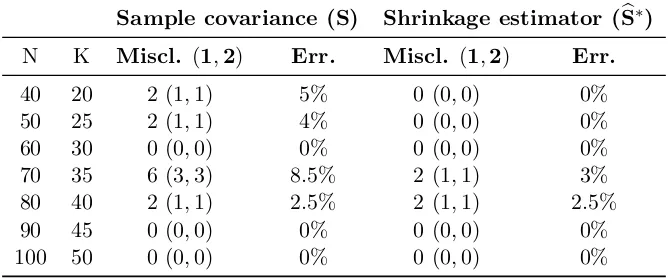
Sample covariance (S) Shrinkage estimator (Sb∗)
N K Miscl. (1,2) Err. Miscl. (1,2) Err.
40 20 2 (1,1) 5% 0 (0,0) 0% 50 25 2 (1,1) 4% 0 (0,0) 0% 60 30 0 (0,0) 0% 0 (0,0) 0% 70 35 6 (3,3) 8.5% 2 (1,1) 3% 80 40 2 (1,1) 2.5% 2 (1,1) 2.5% 90 45 0 (0,0) 0% 0 (0,0) 0% 100 50 0 (0,0) 0% 0 (0,0) 0%
Table 1: Clustering performances results for the application with synthetic functional data.
account of the heuristic nature of the algorithm.
Results undoubtedly highlight that covariance-based clustering is effective, yielding groups which can easily be interpreted as the original ones up to an error always lower than 10%, also for challenging cases of scarce data. In addition, for reasonable sample sizes, the error tends to get lower. The results are even more satisfactory if related to the dimension of the covariance matrices of these data, i.e. P = 100, since a successful clustering may be carried out with only 25-30 units per family.
If we compare the performances gained when using S with those attained by using Sb∗,
we see that a substantial improvement in accuracy has been achieved. Moreover, in this experiment the performances of Max-Swap combined with bS∗ were more stable across the
trials, and almost always close to the best one for all trials. This may be an advantage with respect toS, which in turn gave results more variable from trial to trial. On the contrary, from a computational point of view, resorting to S leads to faster simulations, while using
b
S∗ requires higher effort, especially when K is large.
4.3 Deoxygenated hemoglobin data
0 10 20 30 40
−1.0
−0.5
0.0
0.5
1.0
Deoxygenated hemoglobin data
Time [s]
Concentr
ation
0 10 20 30 40
−1.0
−0.5
0.0
0.5
1.0
Cluters of deoxygenated hemoglobin data
Time [s]
Concentr
ation
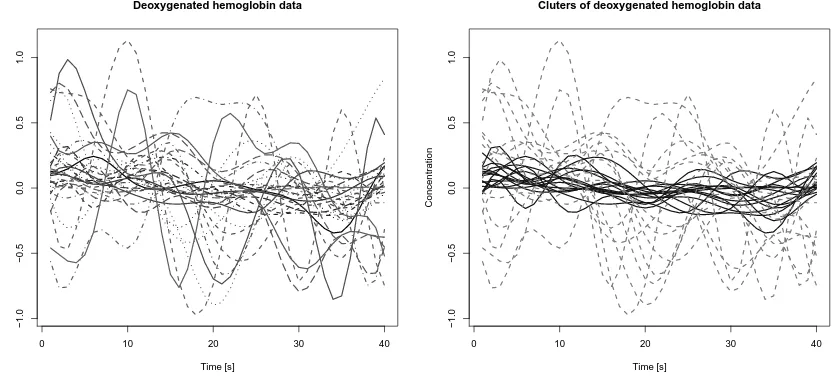
Figure 4: Deoxygenated hemoglobin’s concentration data. In the left panel are represented the preprocessed data on which the clustering is carried out. In the right panel is shown the output.
measurement and preprocessing techniques as well as the experimental instruments used to collect data are described in (Torricelli et al., 2014; Zucchelli et al., 2013; Re et al., 2013).
Each statistical unit of the data set consists of a sampling along 40 seconds of deoxygenated hemoglobin’s concentration at the related location on the brain. Our clustering purpose is to recognize the signals of patients whose trends in hemoglobin’s concentration show wide fluctuations across their mean profiles from signals where the concentration varies little. The aim of the study was in fact to detect different behaviours corresponding to activated vs. non activated cerebral areas. This activation is reflected in difference in covariance operators more than in difference in the mean level of deoxygenated hemoglobin concentra-tion, thus we wish to apply our clustering algorithm in order to detect the two clusters. In a pre-processing stage, signals affected by artifacts due to the measurement procedure were removed, while the others were de-trended and smoothed thanks to a B-Spline smooth-ing basis.
At the end of the pre-processing stage, a set of N = 30 signals, subdivided into two groups ofK= 15 are available with a sampling rate of 1s, so thatP = 40. These data are depicted in Figure 4.
We run the Max-Swap clustering algorithm on these data to perform clustering, both using S and Sb∗ estimators, finding equal partitions of initial data. The results are shown in
5. Conclusions
In this paper we have studied the problem of performing clustering on two groups of data whose difference lies in their variance-covariance structures rather than in their means. We have formulated it according to the general statistical framework of functional data, yet it can be of interest also in other contexts, such as for multivariate data. We have shown how the naive clustering strategy is computationally intractable and we have proposed a new heuristic algorithm to override such issue. The algorithm is based on a proper quantification of the distance between estimates of covariance operators, which we assumed to be the natural Hilbert-Schmidt norm, and seeks for the partition of data producing the highest possible distance among estimated covariances. The partition is sought by modifying two initial guesses of the true groups with subsequent exchanges of units, in order to maximise the distance between estimated covariances. We have given its pseudo-code formulation and studied its convergence properties and complexity. A crucial point of the algorithm is the estimation of covariance operators, which can be done by standard sample covariance, but we have proposed a variant involving a linear shrinkage estimator, which promises to be at least as accurate as sample covariance, and often better in terms of mean square error. By means of some examples we have collected empirical evidence to prove that the algorithm is able to solve suitably the clustering problem, both when the variabilities are different in their magnitudes or in their directions. We compared the performances gained on functional data under the use of the sample estimator and of the linear shrinkage one, and found that both of them give definitely satisfactory results and that the use of linear shrinkage may provide a substantial improvement in terms of clustering performances.
References
V. Bonomini, R. Re, L. Zucchelli, F. Ieva, L. Spinelli, D. Contini, A. M. Paganoni, and Tor-ricelli A. A new linear regression method for statistical analysis of fnirs data. Biomedical optics express, 2(6):615–630, 2015.
D. Bosq. Linear Processes in Function Spaces: Theory and Applications, volume 149 of
Lecture Notes in Statistics. Springer, 2000.
T. T. Cai and A. Zhang. Inference for high-dimensional differential correlation matrices.
Journal of Multivariate Analysis, 143:107–126, 2016.
J. A. Hartigan. Clustering Algorithms. John Wiley & Sons, Inc., New York, NY, USA, 1st edition, 1975.
L. Horv´ath and P. Kokoszka. Inference for Functional Data with Applications, volume 200 of Springer Series in Statistics. Springer, 2012.
O. Ledoit and M. Wolf. Improved estimation of the covariance matrix of stock returns with an application to portfolio selection. Journal of Empirical Finance, 10(5):603–621, 2003.
R. Mitra, P. M¨uller, and Y. Ji. Bayesian graphical models for differential pathways.Bayesian Analysis, 11(1):99–124, 2016.
J. O. Ramsay and B.W. Silverman. Functional Data Analysis. Springer, New York, 2005.
R. Re, D. Contini, M. Turola, L. Spinelli, L. Zucchelli, M. Caffini, R. Cubeddu, and A. Torri-celli. Multi-channel medical device for time domain functional near infrared spectroscopy based on wavelength space multiplexing. Biomedical optics express, 4(10):2231–2246, 2013.
J. Schafer and K. Strimmer. A shrinkage approach to large-scale covariance matrix estima-tion and implicaestima-tions for funcestima-tional genomics. Statistical Applications in Genetics and
Molecular Biology, 4(1):1175–1189, 2005.
C. Stein. Inadmissibility of the usual estimator for the mean of a multivariate normal distribution. In J. Neyman, editor, Proceedings of the Third Berkeley Symposium on
Mathematical Statistics and Probability, volume 1, pages 197–206, 1956.
A. Torricelli, D. Contini, A. Pifferi, M. Caffini, R. Re, L. Zucchelli, and L. Spinelli. Time domain functional nirs imaging for human brain mapping. Neuroimage, 85:28–50, 2014.
M. Watson. Coxpress: differential co-expression in gene expression data. BMC bioinfor-matics, 7(1):1, 2006.
L. Zucchelli, D. Contini, R. Re, A. Torricelli, and L. Spinelli. Method for the discrimination of superficial and deep absorption variations by time domain fnirs. Biomedical optics