R E S E A R C H A R T I C L E
Open Access
Use of the structure-function relationship in
detecting glaucoma progression in early glaucoma
Kazuyuki Hirooka
*, Saki Manabe, Kaori Tenkumo, Eri Nitta, Shino Sato and Akitaka Tsujikawa
Abstract
Background:To evaluate the use of optical coherence tomography (OCT) retinal nerve fiber layer (RNFL) thickness and visual field (VF) measurements in detecting disease progression in patients with early glaucoma.
Methods:Over a 3-year period, this study examined 60 eyes of 39 glaucoma patients whose total deviation in the superior or inferior hemifield was more than−6 dB. All eyes underwent at least four serial RNFL measurements performed by Cirrus OCT, with the first and last measurements separated by at least three years. On the same day as the RNFL imaging, VF testing was also performed by using the Swedish Interactive Threshold Algorithm Standard 30–2 program of the Humphrey Field Analyzer. Serial RNFL thicknesses and VF progression were assessed using the Guided Progression Analysis (GPA) software program. RNFL thickness progression and VF progression were evaluated by the event analysis.
Results:The mean observation period was 57.6 ± 10.0 months, and during this time, a total of 366 OCT and 366 VF measurements were performed. Using only OCT, progression was found in 2 eyes, while progression was found in 1 eye when only using VF GPA. When combined measurement findings were used, the analysis found progression in 8 eyes.
Conclusions:When mild VF defect is present, OCT RNFL thickness measurements can be helpful in discerning
glaucoma progression.
Keywords:Optical coherence tomography, Visual field, Retinal nerve fiber layer, Glaucoma progression
Background
Glaucoma is a progressive optic neuropathy character-ized by the loss of retinal ganglion cells and the retinal nerve fiber layer (RNFL), with an associated visual field loss [1,2]. In glaucoma, the precise nature of the relation-ship between the structure and function is important, as it can be used for detecting glaucomatous damage, deter-mining the stage of the disease, and monitoring the pro-gression of the disease.
In routine clinics, spectral-domain optical coherence tomography (SD-OCT) has rapidly become one of the most widely used technologies due to its high image resolution and measurement precision. Changes in the appearance of the RNFL thickness often precede the development of glaucomatous visual field (VF) loss [3]. As a way of improving our ability to detect the presence
and progression of glaucomatous damage, a number of studies have used SD-OCT to specifically focus on the relationship between the structural and functional dam-age. Results of these studies have demonstrated there are high correlations between the global VF sensitivity and the peripapillary RNFL [4,5]. In contrast, however, sev-eral other studies have reported finding poor agreement between the structure- and function-based results and the extent of the progression [6-8]. We have recently re-ported that the average of the progressive hemifield total deviation (TD) at baseline for the both RNFL and VF progression was −3.21 ± 1.38 dB, while individually it was −2.17 ± 1.14 dB for RNFL progression and −9.12 ± 3.75 dB for VF progression [9]. In this study, if progres-sion was noted in the inferior RNFL thickness, we then evaluated the TD of the superior hemifield. The average of the progressive hemifield TD demonstrated that there was a significant advancement of VF progression as compared to RNFL progression. Based on these results, * Correspondence:[email protected]
Department of Ophthalmology, Kagawa University Faculty of Medicine, 1750–1 Ikenobe, Miki, Kagawa 761-0793, Japan
we speculated that determination of the RNFL thickness by OCT might be an important diagnostic tool, as these measurements should be able to help discern glaucoma progression when the VF defect is mild.
Therefore, the purpose of our current study was to examine the relationship between the RNFL thickness and VF measurements, and then evaluate the ability of using these findings to determine progression in patients with early glaucoma.
Methods Patients
We performed a retrospective review of patients with glaucoma who underwent OCT measurements of RNFL thickness and VF testing at Kagawa University Hospital, Kagawa, Japan, between October 2008 and January 2014. Each of the eyes underwent at least four serial RNFL measurements, with the first and last measurements sep-arated by at least 3 years. All eligible subjects received a detailed explanation of the study and signed an informed consent form in accordance with the principles em-bodied in the Declaration of Helsinki. This study was ap-proved by the Institutional Review Board at Kagawa University Hospital. At the baseline examination, all sub-jects underwent a complete ophthalmic evaluation that included visual acuity testing with refraction, intraocular pressure, and dilated fundus examination with stereo-scopic biomicroscopy of the optic nerve head using slit-lamp and indirect ophthalmoscopy. To be included in the study, all subjects had to have a best-corrected visual acuity of 20/40 or better, a spherical error within a range between +4.0 and−6.0 diopters, and a cylinder within ± 2.0 diopters. Exclusion criteria included a history of any kind of retinal pathology, retinal laser procedure, retinal surgery, or neurologic disease. In addition, we also ex-cluded patients with advanced hemifield VF defect who had an initial TD in the superior or inferior hemifield under −6 dB. However, if the superior and the inferior hemifield were each above −6 dB, we included both hemifields. In addition, since we assessed each hemifield in these patients, the global TD was not included in the exclusion criteria. Glaucomatous eyes were defined as eyes exhibiting structural glaucomatous changes (vertical cup-disc asymmetry between fellow eyes of≥0.2, a cup-disc ratio of≥0.6, and a neuroretinal rim narrowing, notches, localized pallor, or RNFL defects with glau-comatous VF loss in the corresponding hemifield). A glaucomatous VF was defined as a glaucoma hemifield test outside of the normal limits on at least two con-secutive baseline tests and the presence of at least three contiguous test points within the same hemifield on the pattern deviation plot at P< 1%, with at least one at P< 0.5% (excluding those points on the edge of the field or those directly above and below the blind spot).
VF testing and RNFL imaging were performed during the same visit.
Cirrus HD-OCT RNFL measurement
Cirrus HD-OCT uses spectral domain technology (Carl Zeiss Meditec, Dublin, CA). This technique utilizes an optic disc cube that is generated from a 3-dimensional data set composed of 200 A-scans from each of 200 B-scans that cover a 6 mm2 area centered on the optic disc. After creating an RNFL thickness map from the cube, the software automatically determines the center of the disc and then extracts a circumpapillary circle (1.73 mm radius) from the data set. All of the images obtained in the current study had signal strengths of at least 6. The RNFL thickness deviation and the RNFL thickness change maps were automatically generated by the OCT instrument and exported to a computer that analyzed the progression pattern of the RNFL defects. The RNFL defects were visualized in the RNFL thickness deviation map, which was composed of 50 × 50 pixels. A pixel was coded in yellow if the RNFL measurement was below the lower 95% and coded in red if below 99% of the percentile ranges for that particular pixel.
The RNFL thickness change map was a component of the Guided Progression Analysis (GPA) software (Carl Zeiss Meditec), which provided both event- and trend-based analysis of the RNFL progression trend-based on the serial RNFL thickness maps. This software automatically aligned and registered the baseline and follow-up OCT images so that the same pixel locations could be mea-sured for change. In order to be able to generate a GPA report, at least four patient visits were necessary. The GPA program then overlaid and compared the serial RNFL thickness against the duration of the follow-up.
Visual field examination
Standard visual field testing was performed using static automated white-on-white threshold perimetry (Hum-phrey Field Analyzer II (HFA); Carl Zeiss Meditec, Dublin, CA), using the 30–2 Swedish Interactive Thresh-old Algorithm Standard test. The visual field was defined as reliable only when the fixation losses and the false-positive and false-negative rates were less than 20%. Only reliable test data were used in all of our analyses.
eccentricity and advancing disease. Each of the consecu-tive tests examined the same locations (≥3) and deter-mined if there was progression during any of the consecutive VF tests. Based on the findings of a previous study [10], “possible progression” was considered to be present when the GPA printouts reported finding pro-gression in 2 locations, while “likely progression” was considered to be present when progression was found in 3 locations.
Analysis
Using the GPA software, RNFL thickness progression was assessed by event analysis. Event analysis defined progression as a change that exceeded a predefined limit when compared to the baseline value. The baseline values were obtained by averaging the data from the first two exams. After completing a series of RNFL thickness measurements, the GPA software then compared the baseline RNFL thickness value to the final measurement value. A “possible loss” was identified when the differ-ences between the baseline and final measurement values exceeded the test-retest variability. If the“possible loss” criterion was met on two successive visits, the patient was considered to show a “likely loss”. In the current study, if the RNFL Thickness Map Progression indicated that there was a“likely loss”or“possible loss”, we defined the RNFL thickness as having progressed. The VF GPA classification indicated“likely progression” or“possible progression”, this was defined as progression of the glaucoma.
Statistics
All statistical values are presented as mean ± standard deviation (SD), with P values < 0.05 considered statisti-cally significant. Data were analyzed using a pairedt-test. Statistical analyses were performed using SPSS version 19.0 (IBM, New York).
Results
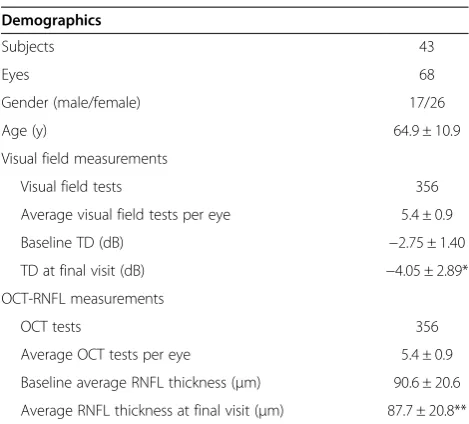
We analyzed 366 OCT scans and 366 VF test results ob-tained from 60 eyes of 39 patients with glaucoma (Table 1). The average number of OCT scans and VF tests for each eye was 5.4. The follow-up duration ranged from 36 to 70 months. Table 1 presents the pa-tient’s demographics, along with the VF and RNFL mea-surements. Mean age was 64.9 ± 10.9 years. The baseline visual field TD and RNFL thickness values were−2.75 ± 1.40 dB (range, −0.79 to −6.00 dB) and 90.6 ± 20.6 μm (range, 45 to 140 μm), respectively. Significant differ-ences were observed between the baseline and the final TD and RNFL thickness measurements (P< 0.05).
Eight eyes had concurrent progression in structure and function. Topographical correspondence between the VF progression and the RNFL progression was
present in 8 eyes (Figure 1). In 3 of the 8 eyes, OCT identified damage before it was detected by HFA. In 4 of the 8 eyes, both OCT and HFA detected progression at the same time. In 1 out of 8 eyes, HFA identified pro-gression before it was detected by OCT. OCT GPA re-ported that 2 eyes exhibited progression, while VF GPA showed there was progression in 1 eye (Figure 1).
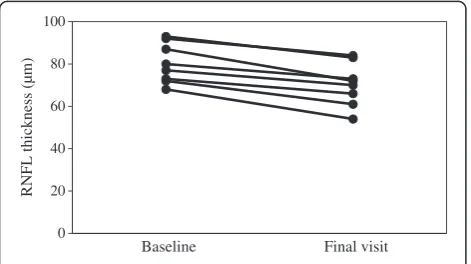
Table 2 shows the RNFL measurements in eyes with or without progression. Significant differences were ob-served between the baseline and the final measurements (P< 0.001). Figure 2 shows the initial and final RNFL thickness in each eye with progression.
Table 1 Demographics, visual field, and OCT RNFL measurements
Demographics
Subjects 43
Eyes 68
Gender (male/female) 17/26
Age (y) 64.9 ± 10.9
Visual field measurements
Visual field tests 356
Average visual field tests per eye 5.4 ± 0.9
Baseline TD (dB) −2.75 ± 1.40
TD at final visit (dB) −4.05 ± 2.89*
OCT-RNFL measurements
OCT tests 356
Average OCT tests per eye 5.4 ± 0.9
Baseline average RNFL thickness (μm) 90.6 ± 20.6
Average RNFL thickness at final visit (μm) 87.7 ± 20.8**
*P< 0.001 compared with baseline. **P< 0.05 compared with baseline.
TD, total deviation; dB; decibels, OCT, optical coherence tomography RNFL, retinal nerve fiber layer.
In 1 eye, VF GPA indicated there was significant im-provement. However, OCT in this eye showed the oppos-ite, indicating that there was no significant improvement.
Discussion
Worsening optic disc excavation, RNFL atrophy and de-terioration in visual function are all used to detect the progression of glaucoma. If progression is confirmed, treatment needs to be modified or enhanced in order to prevent further irreversible loss of the patient’s visual function. In the current study, we evaluated the effect-iveness of using OCT RNFL thickness and VF measure-ments by HFA to detect progression in patients with early glaucoma.
It has been previously recommended that glaucoma be monitored by both VF and digital imaging devices [11]. However, it has been reported that there is poor agree-ment between the VF and RNFL results when used to detect progression [6-8]. Structural assessment by OCT has been shown to be much worse when performed dur-ing advanced stages of damage [12]. It has been further reported that a complete loss in standard automated perimetry sensitivity is not due to an RNFL thickness of zero, but is in fact is associated with a finite RNFL thick-ness. Previous findings have also shown that there is a minimum value beyond which the thickness cannot be reduced, as glial cells or other factors do not contribute
to the number of axons [12]. For these reasons, our study excluded the initial TD in the superior or inferior hemifield when values were under −6 dB as changes in RNFL thickness with this advanced loss are minimal.
In 7 of the 8 eyes in which both techniques reported progression, OCT was able to identify damage prior to or at the same time that HFA detected the damage. Results of previous cross-sectional studies in early glau-coma patients have also suggested that progression determined by the RNFL thickness is more noticeable than that determined by the visual field, based on the observed curvilinear structure-function relationship [13-15]. Furthermore, it is notable that depending on the stage of the disease, the ability to detect progression may vary considerably between the structural and func-tional tests. HFA seems to be relatively insensitive when detecting changes in early glaucoma, whereas OCT seems to perform relatively worse during the advanced stage of glaucoma.
In our current study, an event-based approach was se-lected for analysis of both the structural and functional progression. When using trend analysis, one important assumption is that the amount of change will be linearly proportional to the duration of the follow-up. However, it is known that the rate of progression can vary over time due to loosening or tightening of the control of the glaucoma treatment, as well as due to changes related to the natural progression of the disease. For this reason, our study assessed the functional and structural progres-sions by using the event analysis of the GPA software for both the HFA and OCT.
The limitations of our present work include having a small sample size and a small number of tests. There-fore, larger studies will need to be undertaken in the fu-ture in order to be able to more precisely determine the structure-function relationship present when detecting the glaucoma progression.
Conclusions
In conclusion, our current study demonstrated in this limited group that there was good agreement between the structural and functional tests used to evaluate glau-coma progression during the early stage of the disease.
Competing interests
The authors declare that they have no competing interest.
Authors’contributions
Conception and design: KH Acquisition of data: SM Analysis and interpretation of data: SM Preparation: KH, SM Review: KH Approval of manuscript: KH, SM, SS, KT, EN, AT All authors read and approved the final manuscript.
Acknowledgement
We are grateful to Forte Science Communications for proofreading this manuscript.
Table 2 RNFL measurements in eyes with or without progression
Eyes with progression
Eyes without progression
(8 eyes) (52 eyes)
Baseline average RNFL thickness (μm)
83.6 ± 19.7 91.9 ± 20.6
Average RNFL thickness at final visit (μm)
72.9 ± 25.4* 90.6 ± 18.6
*P< 0.05 compared with baseline. RNFL, retinal nerve fiber layer.
0 20 40 60 80 100
Baseline Final visit
RNFL thickness (µm)
This work was supported by a Grant-in-Aid for Scientific Research from the Ministry of Education, Culture, Sports, Science, and Technology of Japan (26462689).
Received: 3 June 2014 Accepted: 24 September 2014 Published: 4 October 2014
References
1. Quigley HA, Addicks EM, Green WR:Optic nerve damage in human glaucoma. III. Quantitative correlation of nerve fiber loss and visual field defect in glaucoma, ischemic neuropathy, papilledema, and toxic neuropathy.Arch Ophthalmol1982,100:135–146.
2. Quigley HA, Dunkelberger GR, Green WR:Retinal ganglion cell atrophy correlated with automated perimetry in human eyes with glaucoma.
Am J Ophthalmol1989,107:453–464.
3. Hood DC, Kardon RH:A framework for comparing structural and functional measures of glaucomatous damage.Prog Retina Eye Res2007,
26:688–710.
4. Takagishi M, Hirooka K, Baba T, Mizote M, Shiraga F:Comparison of retinal nerve fiber layer thickness measurements using time domain and spectral domain optical coherence tomography, and visual field sensitivity.J Glaucoma2011,20:383–387.
5. Nilforushan N, Nassiri N, Moghimi S, Law SK, Giaconi J, Coleman AL, Caprioli J, Nouri-Mahdavi K:Structure-function relationships between spectral-domain OCT and standard achromatic perimetry.
Invest Ophthalmol Vis Sci2012,53:2740–2748.
6. Wollstein G, Schuman JS, Price LL, Aydin A, Stark PC, Hertzmark E, Lai E, Ishikawa H, Mattox C, Fujimoto JG, Paunescu LA:Optical coherence tomography longitudinal evaluation of retinal nerve fiber layer thickness in glaucoma.Arch Ophthalmol2005,123:464–470.
7. Leung CK, Cheung CY, Weinreb RN, Qiu K, Liu S, Li H, Xu G, Fan N, Pang CP, Tse KK:LamDS. Evaluation of retinal nerve fiber layer progression in glaucoma: a study on optical coherence tomography guided progression analysis.Invest Ophthalmol Vis Sci2010,51:217–222. 8. Leung CK, Liu S, Weinreb RN, Lai G, Ye C, Cheung CY, Pang CP, Tes KK, Lam
DS:Evaluation of retinal nerve fiber layer progression in glaucoma: a prospective analysis with neurotetinal rim and visual field progression.
Ophthalmology2011,118:1551–1557.
9. Tenkumo K, Hirooka K, Baba T, Nitta E, Sato S, Shiraga F:Evaluation of relationship between retinal nerve fiber layer thickness progression and visual field progression in patients with glaucoma.Jpn J Ophthalmol 2013,57:451–456.
10. Heijl A, Leske MC, Bengtsson B, Bengtsson B, Hussein M, Early Manifest Glaucoma Trial Group:Measuring visual field progression in the Early Manifest Glaucoma Trial.Acta Ophthalmol Scand2003,81:286–293. 11. Consensus statements: InGlaucoma Diagnosis Structure and Function:
Reports and Consensus Statements of the 1st Global AIGS Meeting on
“Structure and Function in the Management of Glaucoma”.Edited by Weinreb RN, Greve EL. The Netherlands: Kugler: The Hague; 2004:155–156. 12. Hood DC, Anderson SC, Wall M, Kardon RH:Structure versus function in
glaucoma: an application of a linear model.Invest Ophthalmol Vis Sci 2007,48:3662–3668.
13. Leung CK, Medeiros FA, Zangwill LM, Sample PA, Bowd C, Ng D, Cheung CY, Lam DS, Weinreb RN:American Chinese glaucoma imaging study: a comparison of the optic disc and retinal nerve fiber layer in detecting glaucomatous damage.Invest Ophthalmol Vis Sci2007,48:2644–2652. 14. Schlottmann PG, De Cilla S, Greenfield DS, Caprioli J, Garway-Heath DF:
Relationship between visual field sensitivity and retinal nerve fiber layer thickness as measured by scanning laser polarimetry.
Invest Ophthalmol Vis Sci2004,45:1823–1829.
15. Leung CK, Chong KK, Chan WM, Yiu CK, Tso MY, Woo J, Tsang MK, Tse KK, Yung WH:Comparative study of retinal nerve fiber layer measurement by StratusOCT and GDx VCC II: structure/function regression analysis in glaucoma.Invest Ophthalmol Vis Sci2005,46:3702–3711.
doi:10.1186/1471-2415-14-118
Cite this article as:Hirookaet al.:Use of the structure-function relationship
in detecting glaucoma progression in early glaucoma.BMC Ophthalmology
201414:118.
Submit your next manuscript to BioMed Central and take full advantage of:
• Convenient online submission • Thorough peer review
• No space constraints or color figure charges • Immediate publication on acceptance
• Inclusion in PubMed, CAS, Scopus and Google Scholar
• Research which is freely available for redistribution