Iranian Journal of Fisheries Sciences 17(1) 107-117 2018
DOI: 10.22092/IJFS.2018.115588
A comparative study on morphometric and meristic
characters of
Nemipterus japonicus
(Bloch, 1791)
in the coasts
of India
Edwin Prabakaran T.
1; Jeyasingh Thompson R.
2*; Deepak Samuel V.
3Received: December 2015 Accepted: October 2016
Abstract
A total of 200 threadfin bream Nemipterus japonicus was collected from Chennai in the east coast and Kochi in the west coast during January to February 2013 and studied for their morphometric and meristic characters. In total, 21 characters were analyzed out of which 3 characters namely dorsal, ventral and anal fins were not considered since they were unaltered. The findings indicate that 91% of the total variation in the data can be accounted for by three clusters. Small values of 1-R**2 ratio for the three clusters obtained indicate good clustering. The small values of p (≤0.0001) indicate that there are significant differences in the variables of Chennai and Kochi data which are shown through MANOVA. This might depict that the fish of Chennai and Kochi might be of 2 different stocks. Moreover, the study has also aided in identifying the importance of regular monitoring of stock assessment and the biology of commercially important fishes.
Keywords: Nemipterus japonicus, Threadfin bream, Biometric study, Coastal area, India, Morphometric, Meristic characters
1- Department of Statistics, Loyola College, Chennai-600034
2- Deptment of Statistics, Madras Christian College, Chennai-600059.
3- UNDP, Gulf of Mannar Biosphere Reserve Trust, JawanBhavan, Ist Floor, Devipattinam Road, Kenikarai, Ramanathapuram, Tamilnadu, 623 501 India
*Corresponding author's Email: [email protected]
108 Edwin Prabakaran et al., A comparative study on morphometric and meristic characters of …
Introduction
The Japanese threadfin bream
Nemipterus japonicus (Nemipteridae)
constitutes an important group of commercial fishes in India. About 20
Nemipterus species have been recorded
by Weber and Beaufort (1936), out of which 10 species have been well recognized from Indian coastal waters as reported in Somashekar (2013), viz.
Nemipterus marginatus (Cauvier,
Valenciennnes), N. hexodon
(QuoyandGailard), N. leteus
(Schneider, 1801), N. japonicus (Bloch, 1791), N. mesoprion (Bleeker, 1853),
N. tolu (Valenciennes),
N.delagoae(Smith, 1941), N. metopias
(Bleeker, 1852), N. bleekeri (Day, 1875) and N. nematophorus (Bleeker, 1853). Satyanarayanan et al. (1972) reported that threadfin breams were abundant in the ocean area beyond 200 m depth. Threadfin breams are sub-demersal in nature and are observed to move in schools with distribution from the Mediterranean Sea to the Indo-west Pacific (Russel, 1990). In the Indian coast, N. japonicus is caught maximum
numbers during the south-west
monsoon season, particularly in the west coast of India. The catch is abundant in the coastal regions of Kerala and usually the catch rate shoots
up during the monsoon period.
Substantial research work has been carried out on the family of N.
japonicus in terms of their stock
assessment, biology and a few reports exist on the length-weight relationships too. A useful report regarding the catch,
effort and biology from Cochin (Kochi now) are available (Vinci, 1983; Nair and Jayaprakash, 1986; John, 1989; Murty et al., 1992). Further, there is a research report on biology, and
population dynamics from the
Vishakhapatnam coast (Rajkumar et al.
2003).A study on the differential
growth rate was also recently
investigated (Joshi, 2010) while, a study on the age determination and feeding habits of this species from the Northern Oman Sea has been carried out of late by Afshari et al. (2013). An attempt to study the meristic and morphometric characteristics of N.
japonicus in two locations from the east
and west coasts of India is carried out in the present research. The aim is to understand whether the two locations namely Chennai and Kochi in India had
significant differences in the
population. This study is a means of assenting analysis by which we either confirm or fail to confirm the research hypothesis (i.e. our prior expectation) that N. japonicus fish at Chennai and Kochi do not differ significantly in their
meristic and morphometric
characteristics.
Materials and methods
A sample of size n=200 fish belonging to the threadfin bream species was collected from two different states,
namely Tamil Nadu (Chennai,
Kasimedu - 13° 7'32.82"N;
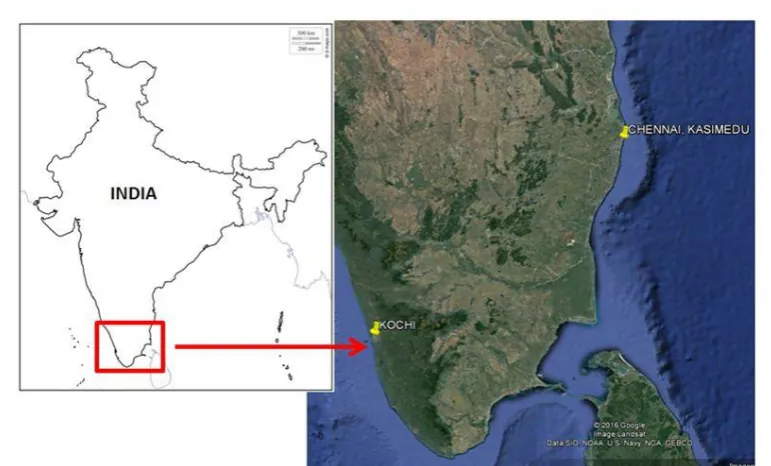
80°17'49.64"E) and Kerala (Kochi - 9°58'8.52"N; 76°14'52.57"E) (Fig.1).
Iranian Journal of Fisheries Sciences 17(1) 2018 109
Figure 1: Map of study areas Chennai (east coast) Kochi (west coast).
100 specimens from each of the sites were collected from trawl nets and analyzed during the period of January - February 2013. The information was collected regarding the morphometric and meristic characters. Due to the vastness of the population, we decided to select a sample from the population. A total of 21 variables which comprises 5 meristic and 16 morphometric characters were analyzed. As we found that the counts for 3 variables namely dorsal fin (DF), anal fin (AF) and ventral fin (VF) were unaltered for fish of both coasts, we considered only 18 variables (Table 1) for the statistical analysis. By using variable clustering of the statistical analysis system (SAS), it was found that the 3 variables namely total weight (TW), pectoral fin (PF) and caudal fin (CF) did not form a linear combination. Hence, we could not include these 3 variables for our study. Therefore, we have taken only 15
variables for our analysis. Further, 7 fish out of 200 fish sampled were found to be outliers using the measure of dispersion. Omitting outliers resulted in data reduction. Hence, only a sample of 193 specimens was considered.
We use variable clustering procedure to divide a set of variables into non-overlapping clusters in such a way that each cluster is a linear combination of variables. Thus, each cluster can essentially be interpreted as uni-dimensional cluster of variables. For each cluster, PROC VARCLUS computes the first principal component and the centroid component and, tries to maximize the sum across clusters of the variation accounted for by the cluster components. PROC VARCLUS was used to divide the variables into 3 clusters and each cluster was treated as a subtest, with the subtest scores given by the cluster components.
110Edwin Prabakaran et al., A comparative study on morphometric and meristic characters of …
Table1: The variables considered for analysis.
No. Variable Description
1 SL Snout length
2 ED Eye diameter
3 POL Post orbital length 4 PDL Pre dorsal length 5 PPD Pre pelvic distance 6 WDF Width of dorsal fin
7 HL Head length
8 BD Body depth
9 STL Standard length
10 FL Fin length
11 TL Total length
12 CPL Caudal peduncle length 13 PDL1 Post dorsal length 14 TW Total weight 15 PF Pectoral fin
16 CF Caudal fin
17 DFLmin Dorsal fin spine minimum 18 DFLmax Dorsal fin spine maximum
19 DF Dorsal fin
20 AF Anal fin
21 VF Ventral fin
The Data set created by SAS
programming of PROC VARCLUS displays the output of clusters (SAS, 2014).
Proper selection of the sample is highly necessary for the significance of the results of the data analysis. If not, the results will be unpredictable and possibly biased. We have considered the selection of sample on the basis of convenience sampling method on both the coastal regions during the same period of time and we measured the morphometric and meristic characters with a digital vernier caliper up to 1 mm accuracy and weighed with a digital balance up to the nearest 0.1g. For the analysis, we have used PROC VARCLUS, MANOVA, Correlation and descriptive statistics.
Results
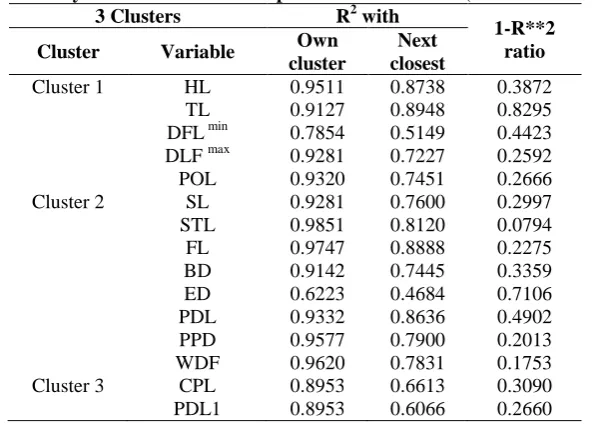
The Japanese threadfin bream collected from Chennai and Kochi was tested with cluster variation for morphometric and meristic characters. For each cluster, Table 2 displays the number of variables in the cluster, the cluster variation, the total explained variation and the proportion of the total variance explained by the variables in the cluster. The column labeled “Variation Explained” in this table provides the sum of the explained variation over all clusters. The final „Proportion‟ represents the total explained variation divided by the sum of cluster variation. This value, 0.9052, indicates that about 91% of the total variation in the data can be accounted for by the three clusters. Tables 2 and 3 display how the variables are clustered.
Iranian Journal of Fisheries Sciences 17(1) 2018 111
Table 2: Cluster summary for 3 clusters by oblique centroid component analysis variation among meristic and morphometric characters (Chennai and Kochi, 2013).
Oblique centroid component cluster analysis cluster summary for 3 clusters
Cluster Members
Cluster variation
Variation explained
Proportion explained
Second eigenvalue
1 5 5 4.509411 0.9019 0.2738
2 8 8 7.277176 0.9096 0.4180
3 2 2 1.790684 0.8953 0.2093
Total variation explained=13.57727, Proportion=0.9052
Table 3: Cluster analysis of meristic and morphometric characters (Chennai and Kochi, 2013).
3 Clusters R2 with
1-R**2 ratio
Cluster Variable Own
cluster
Next closest
Cluster 1 HL 0.9511 0.8738 0.3872
TL 0.9127 0.8948 0.8295
DFL min 0.7854 0.5149 0.4423 DLF max 0.9281 0.7227 0.2592
POL 0.9320 0.7451 0.2666
Cluster 2 SL 0.9281 0.7600 0.2997
STL 0.9851 0.8120 0.0794
FL 0.9747 0.8888 0.2275
BD 0.9142 0.7445 0.3359
ED 0.6223 0.4684 0.7106
PDL 0.9332 0.8636 0.4902
PPD 0.9577 0.7900 0.2013
WDF 0.9620 0.7831 0.1753
Cluster 3 CPL 0.8953 0.6613 0.3090
PDL1 0.8953 0.6066 0.2660
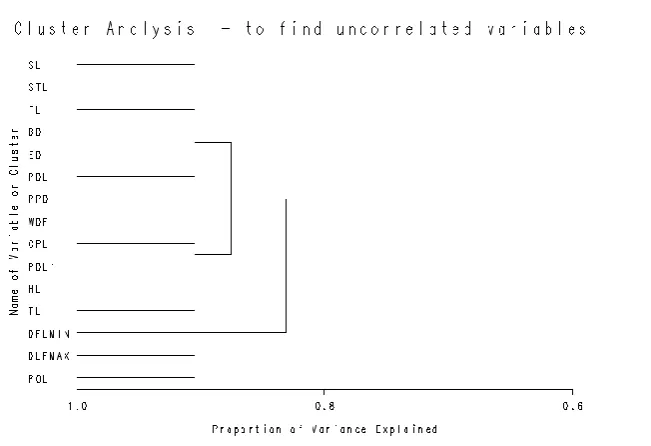
The clusters are represented in the form of a dendrogram in Fig. 2.
Table3 displays the R2 value of each variable with its own. The R2 value for a variable with the nearest cluster should be low if the clusters are well separated. The last column displays the1-R**2ratio for each variable. Small values of this ratio indicate good clustering. Those small values that indicate significant difference in the variables among Chennai and Kochi data are shown through MANOVA. The multivariate ANOVA is simply an
ANOVA with several dependent
variables. That is, the ANOVA tests for the difference in means between two or more groups, while MANOVA tests for the difference in two or more vectors of
means. In Generalized Linear Model
(GLM) procedure all univariate
statistics (ANOVA) show that majority of all morphometric measurements are significantly different for the investigated fish of Chennai and Kochi (p<0.0001). Hence Chennai and Kochi have significantly a different stock of
N. japonicus fish from the variables
studied (Table 4).
Other statistics can be calculated in addition to Wilks‟ λ. The following is a short list of some of the popularly reported test statistics for MANOVA:
112 Edwin Prabakaran et al., A comparative study on morphometric and meristic characters of …
Figure 2: Cluster dendrogram for Nemipterus japonicus using morphometric and meristic
variables (Chennai and Kochi, 2013).
Table 4: MANOVA test for meristic and morphometric characters (Chennai and Kochi, 2013).
MANOVA test criteria and exact F statistics for the typothesis of no overall sample effect H = Type III SSCP matrix for sample; E=Error SSCP matrix; S=1 M=6.5 N=87.5
Statistic Value F value Num DF Den DF Pr>F
Wilks' Lambda 0.05425894 205.68 15 177 <.0001
Pillai's Trace 0.94574106 205.68 15 177 <.0001
Hotelling-Lawley Trace 17.43014129 205.68 15 177 <.0001
Roy's Greatest Root 17.43014129 205.68 15 177 <.0001
Wilks‟ λ=pooled ratio of error variances to effect variance plus error variance.
This is the most commonly reported test statistic, but not always the best choice.
Gives an exact F-statistic.
Hotelling‟s trace=pooled ratio of effect variance to error variance. Roy‟s Greatest root (also called
Roy‟s Largest root)=Maxi(λi).
Pillai's trace=trace[H(H +E)-1] Some statisticians consider it to be the mostpowerful and most robust of the four statistics namely Wilks' Lambda, Pillai's Trace, Hotelling-Lawley Trace and Roy's Greatest Root.
From Table 4, all tests indicate that
there are significant differences in morphometric and meristic characters
of N. japonicusobserved at Kochi and
Chennai.
We observed from the pooled correlation coefficients for Chennai as well as for Kochi (asgiven in Table 5) that there is better association among the variables. Due to an increase in total
length (TL), other variables
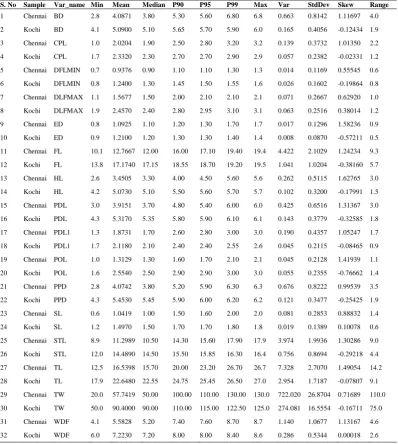
proportionately increase. From the descriptive statistics, we found that Kochi has greater differences in the majority of the morphometric and meristic variables in comparison to Chennai as seen in the Table6.
Iranian Journal of Fisheries Sciences 17(1) 2018 113
Table 5: Pooled correlation co-efficient of morphometric and meristic variables (Chennai and Kochi, 2013).
Correlations
SL HL STL FL TL BD CPL DFL
MIN DLF
MAX ED PDL PDL1 POL PPD WDF
SL 1.000 0.905 0.952 0.947 0.900 0.908 0.755 0.671 0.814 0.705 0.925 0.757 0.840 0.954 0.933
HL 0.905 1.000 0.925 0.960 0.948 0.847 0.702 0.796 0.917 0.712 0.944 0.609 0.961 0.917 0.901
STL 0.952 0.925 1.000 0.988 0.944 0.951 0.831 0.707 0.844 0.765 0.950 0.796 0.849 0.966 0.982
FL 0.947 0.960 0.988 1.000 0.962 0.931 0.791 0.757 0.887 0.744 0.964 0.736 0.902 0.964 0.971
TL 0.900 0.948 0.944 0.962 1.000 0.886 0.752 0.786 0.895 0.708 0.938 0.669 0.900 0.927 0.930
BD 0.908 0.847 0.951 0.931 0.886 1.000 0.822 0.622 0.759 0.706 0.903 0.811 0.759 0.931 0.942
CPL 0.755 0.702 0.831 0.791 0.752 0.822 1.000 0.524 0.618 0.636 0.772 0.791 0.600 0.780 0.805
DFLMIN 0.671 0.796 0.707 0.757 0.786 0.622 0.524 1.000 0.842 0.572 0.753 0.368 0.799 0.681 0.700
DLFMAX 0.814 0.917 0.844 0.887 0.895 0.759 0.618 0.842 1.000 0.623 0.872 0.503 0.916 0.830 0.833
ED 0.705 0.712 0.765 0.744 0.708 0.706 0.636 0.572 0.623 1.000 0.705 0.573 0.630 0.710 0.742
PDL 0.925 0.944 0.950 0.964 0.938 0.903 0.772 0.753 0.872 0.705 1.000 0.707 0.897 0.960 0.937
PDL1 0.757 0.609 0.796 0.736 0.669 0.811 0.791 0.368 0.503 0.573 0.707 1.000 0.502 0.760 0.782
POL 0.840 0.961 0.849 0.902 0.900 0.759 0.600 0.799 0.916 0.630 0.897 0.502 1.000 0.855 0.829
PPD 0.954 0.917 0.966 0.964 0.927 0.931 0.780 0.681 0.830 0.710 0.960 0.760 0.855 1.000 0.954
WDF 0.933 0.901 0.982 0.971 0.930 0.942 0.805 0.700 0.833 0.742 0.937 0.782 0.829 0.954 1.000
Table 6: Descriptive statistics for meristic and morphometric characters (Chennai and Kochi, 2013).
S. No Sample Var_name Min Mean Median P90 P95 P99 Max Var StdDev Skew Range
1 Chennai BD 2.8 4.0871 3.80 5.30 5.60 6.80 6.8 0.663 0.8142 1.11697 4.0
2 Kochi BD 4.1 5.0900 5.10 5.65 5.70 5.90 6.0 0.165 0.4056 -0.12434 1.9
3 Chennai CPL 1.0 2.0204 1.90 2.50 2.80 3.20 3.2 0.139 0.3732 1.01350 2.2
4 Kochi CPL 1.7 2.3320 2.30 2.70 2.70 2.90 2.9 0.057 0.2382 -0.02331 1.2
5 Chennai DFLMIN 0.7 0.9376 0.90 1.10 1.10 1.30 1.3 0.014 0.1169 0.55545 0.6
6 Kochi DFLMIN 0.8 1.2400 1.30 1.45 1.50 1.55 1.6 0.026 0.1602 -0.19864 0.8
7 Chennai DLFMAX 1.1 1.5677 1.50 2.00 2.10 2.10 2.1 0.071 0.2667 0.62920 1.0
8 Kochi DLFMAX 1.9 2.4570 2.40 2.80 2.95 3.10 3.1 0.063 0.2516 0.38014 1.2
9 Chennai ED 0.8 1.0925 1.10 1.20 1.30 1.70 1.7 0.017 0.1296 1.58236 0.9
10 Kochi ED 0.9 1.2100 1.20 1.30 1.30 1.40 1.4 0.008 0.0870 -0.57211 0.5
11 Chennai FL 10.1 12.7667 12.00 16.00 17.10 19.40 19.4 4.422 2.1029 1.24234 9.3
12 Kochi FL 13.8 17.1740 17.15 18.55 18.70 19.20 19.5 1.041 1.0204 -0.38160 5.7
13 Chennai HL 2.6 3.4505 3.30 4.00 4.50 5.60 5.6 0.262 0.5115 1.62765 3.0
14 Kochi HL 4.2 5.0730 5.10 5.50 5.60 5.70 5.7 0.102 0.3200 -0.17991 1.5
15 Chennai PDL 3.0 3.9151 3.70 4.80 5.40 6.00 6.0 0.425 0.6516 1.31367 3.0
16 Kochi PDL 4.3 5.3170 5.35 5.80 5.90 6.10 6.1 0.143 0.3779 -0.32585 1.8
17 Chennai PDL1 1.3 1.8731 1.70 2.60 2.80 3.00 3.0 0.190 0.4357 1.05247 1.7
18 Kochi PDL1 1.7 2.1180 2.10 2.40 2.40 2.55 2.6 0.045 0.2115 -0.08465 0.9
19 Chennai POL 1.0 1.3129 1.30 1.60 1.70 2.10 2.1 0.045 0.2128 1.41939 1.1
20 Kochi POL 1.6 2.5540 2.50 2.90 2.90 3.00 3.0 0.055 0.2355 -0.76662 1.4
21 Chennai PPD 2.8 4.0742 3.80 5.20 5.90 6.30 6.3 0.676 0.8222 0.99539 3.5
22 Kochi PPD 4.3 5.4530 5.45 5.90 6.00 6.20 6.2 0.121 0.3477 -0.25425 1.9
23 Chennai SL 0.6 1.0419 1.00 1.50 1.60 2.00 2.0 0.081 0.2853 0.88832 1.4
24 Kochi SL 1.2 1.4970 1.50 1.70 1.70 1.80 1.8 0.019 0.1389 0.10078 0.6
25 Chennai STL 8.9 11.2989 10.50 14.30 15.60 17.90 17.9 3.974 1.9936 1.30286 9.0
26 Kochi STL 12.0 14.4890 14.50 15.50 15.85 16.30 16.4 0.756 0.8694 -0.29218 4.4
27 Chennai TL 12.5 16.5398 15.70 20.00 23.20 26.70 26.7 7.328 2.7070 1.49054 14.2
28 Kochi TL 17.9 22.6480 22.55 24.75 25.45 26.50 27.0 2.954 1.7187 -0.07807 9.1
29 Chennai TW 20.0 57.7419 50.00 100.00 110.00 130.00 130.0 722.020 26.8704 0.71689 110.0
30 Kochi TW 50.0 90.4000 90.00 110.00 115.00 122.50 125.0 274.081 16.5554 -0.16711 75.0
31 Chennai WDF 4.1 5.5828 5.20 7.40 7.60 8.70 8.7 1.140 1.0677 1.13167 4.6
32 Kochi WDF 6.0 7.2230 7.20 8.00 8.00 8.40 8.6 0.286 0.5344 0.00018 2.6
114Edwin Prabakaran et al., A comparative study on morphometric and meristic characters of …
Discussion
The present study was undertaken to compare the morphometric and meristic characters of N. japonicus from the east and west coasts of India and identify
whether the same species have
significant difference in the variables under study. The analysis revealed that Kochi located on the west coast had higher differences than Chennai in the majority of the variables. As per the work carried out by Pawar (2011), there was no significant difference in the morphometric and meristic ratios for stock assessment from three different localities in India viz. Mumbai, Ratnagiri and Panaji. Isometric growth pattern was observed and the study envisaged that the fish that landed at all the three localities belonged to a single stock. Joshi (2010) in his study compared males and females of N.
mesoprion, another commercially
important Nemipterid off Kochi. His study revealed the biology and population dynamics and in terms of length –weight relationship, there was no significant difference among the sexes. An analysis on meristic characters for N. japonicus was carried out by Sreekanth et al. (2013) from four southern states namely Andhra Pradesh, Tamil Nadu in the east coast and Maharashtra, Kerala in the west coast on the same species. Their study brought forth 15 characters (variables) that had no significant difference between locations that depicted the similarity of the stock collected. The interesting finding in their study was
the difference in the counts of gill rakers that helped them to confirm population and stocks in various locations. In our study, the gill rakers count was eliminated and only macro characters for meristic values were carried out. Moreover, following the standard morphometric and meristic
characters, 21 characters were
identified and readings were recorded. In earlier studies Edwin Prabakaran et al. (2014) had attempted to study 16 morphometric and meristic characters of 489 N. japonicus collected from Chennai waters and observed that there was a high degree of correlation of the characters to the total length of the fish. In the work carried out by Sreekanth et al. (2015), various stocks were identified for threadfin breams based on morphometric characters and the samples were collected from 4 different sites along the east and west coasts. The 21 morphometric distances measured have indicated that there were more than 1 stock present in the east and west coasts of India. From the descriptive statistics in the present study, it was observed that Kochi has high difference in majority of the morphometric and meristic variables in comparison to Chennai. This clearly portrays that the populations that were sampled at both the sites were from different stocks. In a study carried out by Krishnamoorthi (1971) on N. japonicus, it was observed that this species attains an average length of 150mm (15cm) in the 1st year, 210mm (21cm) in the 2nd year and 240mm (24cm) at the end of the 3rdyear
Iranian Journal of Fisheries Sciences 17(1) 2018 115
along the Andhra Pradesh (west) coast. The study also brings to light the spawning season to be from November to March and the size involved is from 160–170mm (16-17cm). In the case of Kerala west coast, Vinci (1983) reports that the peak landing during the 80s was September and records a size increase of 136mm (13.6cm) for the 1st year, 186mm (18.6cm) for the 2nd year and 236mm (23.6cm) for the 3rd year. Similarly a study for Veraval coast in Gujarat (Gopal and Vivekanandan, 1991) have identified that this species matures at 180mm (18cm) total length. In the present study, the maximum size recorded in Chennai waters was 267mm (26.7cm) total length and from Kochi waters 270mm (27cm) total length. The study also suggests that adults above the maturation sizes were caught in
abundance vis-a-vis providing
information that the larger size exists in the wild. Nammalwar (1972) suggested that biometric studies in relation to sex ratio from Porto-Novo waters as an important tool to study measurements based on secondary sexual characters. The peak season for N. japoniucs was found to be from October to March in this region especially in size. Since the study was focused only the growth parameters, an attempt on sex ratio, Gonado somatic index and other biology related information was not attempted in this study.
The present study on the
morphometric and meristic characters for the threadfin bream N. japonicas
helps in understanding the minor
differences that ascertain and
differentiate populations that are diverse from each other. Application of statistics thus comes into effect in assisting fishery biologists involved in stock assessments for natural stocks that are being depleted due to overexploitation arising from demand both locally and globally. Regular stock assessment will help in proper exploitation of the resources of threadfin breams because they are currently exploited with great demand. Though there is no overexploitation, the trend to change is not far off purely due to the local demand.
References
Ashrafi, M., Seifabadi,J. and Kamaly, E., 2013.Age determination and feeding habits of
Nemipterus japonicus (Bloch, 1791)
in the Northern Oman Sea.Iranian
Journal of Fisheries Science,12(2),
248-264.
Edwin Prabakaran, T., Jeyasingh Thompson, R. and Deepak Samuel, V., 2014. A study on the
morphometric and mersitic
characters of the threadfin bream
(Nemipterusjaponicus Bloch, 1791)
off Chennai coast. Indian Journal of
Applied Research, 4(1), 521-524.
Gopal, C. and Vivekanandan, E., 1991. Threading bream fishery and biology of Nemipterus janponicus
off Veraval. Indian Journal of
Fisheries, 38(2), 97–102.
John, M.E., 1989.Population dynamics and stock estimates of the threadfin breams (Nemipterus japonicus) off Kerala, India. In: Venema, S. C. and
116Edwin Prabakaran et al., A comparative study on morphometric and meristic characters of …
Van Zalinge, N.P. (Eds.)
Contributions to Tropical Fish Stock
Assessment in India.
FAO/DANIDA/ ICAR/ National
follow up training course on fish stock assessment, pp. 45-62.
Joshi, K.K., 2010.Poulation dynamics
of Nemipterus japonicus (Bloch) in
trawling ground off Cochin. Indian
Journal of Fisheries, 57(1), pp. 7-12.
Krishnamoorthi, B., 1971. Biology of
the threadfin bream
Nemipterusjaponicus (Bloch). Indian
Journal of Fisheries, 8(1 and 2), 1–
21.
Murty, V.S.R., Rao, T.A., Srinath, M., Vivekanandan, E., Nair, K.V.S., Chakraborty, S. K., Raje, S.G. and Zacharia, P.U., 1992.
Stock assessment of threadfin breams (Nemipterus spp.) of India.
Indian Journal of Fisheries, 39,
9-41.
Nair, K.V.S. and Jayaprakash, A.A., 1986. A note on the monsoon fishery of threadfin breams off Cochin.
Indian Journal of Fisheries, 33,
106-112.
Nammalwar, P., 1972.A short note of
the biometry of Nemipterus
japonicus (Bloch) in relation to sex.
In: Porto-Novo waters. Scientific
Culture, 39(8), 349-350.
Pawar, H.B., Shirdhankar, M.M., Barve, S.K. and Patange, S.B., 2011. Discrimination of Nemipterus
japonicus (Bloch, 1791) stock from
Maharashtra and Goa states of India.
Indian Journal of Geo-Marine
Sciences, 40(3), 471 – 475.
Rajkumar,U., NarayanaRao, K. and Jose Kingsly, H., 2003. Fishery, biology and population dynamics
of Nemipterus japonicus (Bloch) off
Visakhapatnam Indian Journal of
Fisheries, 50(3), 319–324.
Russell, B.C., 1990. FAO species catalogue. Nemipterid fishes of the world. (Threadfin breams, Whiptail breams, Monocle breams, Dwarf monocle breams, and Coral breams.) Family Nemipteridae. An annotated and illustrated catalogue of Nemipterid species known to date.
FAO Fisheries Synopsis, 125P.
SAS, 2014. SAS/STAT® 13.2 User‟s Guide. Cary, NC: SAS Institute Inc.
Satyanarayana, A.V.V.,
Narayanappa, G. and Raju, D.A.N., 1972. On the comparative fishing experiments with a four-seam and two-seam trawls on the east coast. Fishing Technology, 9(2), 169–179.
Somashekar, S.R., 2013. Studies on fishery biology and population characteristics of threadfin bream
Nemipterus mesoprion Bleeker off
Mangalore. Ph.D Thesis, Karnataka Veterinary, Animal and Fisheries Sciences University, 112P.
Sreekanth, G.B., Chakraborty, S. K., Jaiswar, A.K., Renjith, R.K., Deepak George Pazhayamadom, Kamei, G., Vaisakh, G. and Sunil S.A., 2013. Analysis of meristic characters of the Japanese threadfin
bream, Nemipterus japonicus
(Bloch, 1791) along Indian coast.
Indian Journal of Fisheries, 60(4),
Iranian Journal of Fisheries Sciences 17(1) 2018 117
119-121, 2013.
Sreekanth, G.B., Chakraborty, S.K., Jaiswar, A.K., Renjith R.K., Ratheesh Kumar, Sandeep, K.P., Vaisakh, G., Sunil S.A., ManjuLekshmi, N. and Deepak George P., 2015. Can the
Nemipterus japonicus stocks along
Indian coast be differentiated using morphometric analysis? Indian Journal of Geo-Marine Sciences,
44(4), pp. 840-846
Vinci, G.K., 1983. Threadfin bream
(Nemipterus) resources along the
Kerala coast with notes on biology
of Nemipterus japonicus. Indian
Journal of Fisheries, 29, 37– 49.
Weber, M. and DE Beaufort, L.F., 1936. The fishes of Indo-Australian Archipelago. Leiden - 1913E. J. Brill
Ltd (Holland), 7, 607P.