Copyright © The Author(s). All Rights Reserved. Published by American Research Institute for Policy Development DOI: 10.15640/ijmp.v7n1a3 URL: https://doi.org/10.15640/ijmp.v7n1a3
Evaluation of Insulin Resistance in Type 2 Diabetic Nigerians
N N Oranye
1, P O Anaja
2& A G Bakari
3Abstract
Background: The link between Insulin Resistance (IR) and type 2 Diabetes Mellitus (T2DM) has been well recognized for well over half a century. Not only is it the most powerful predictor of future development of type 2 diabetes mellitus, it is also a therapeutic target once hyperglycaemia is present. The current study seeks to evaluate Insulin Resistance in type 2 Diabetic subjects and proffer a reference range for insulin resistance in the ABUTH, Zaria area. Materials and Methods: Serum insulin resistance, insulin, lipids, fasting plasma glucose, glycated haemoglobin and anthropometric parameters were measured in 180 type 2 diabetic and 180 control subjects. Insulin resistance was calculated using the Homeostasis Model Assessment (HOMA) method. Serum insulin was measured using the ELISA method while spectrophotometric methods were used for blood glucose, glycated haemoglobin and serum lipids. The results were analysed statistically using the two-tailed student’s t-test and the one way analysis of variance (ANOVA). Results: Mean serum insulin resistance levels were significantly higher in the type 2 diabetic group than in the control group (P < 0.05). Mean FPG, HBA1C and serum insulin levels were also significantly higher in the diabetic group than in the control group (P < 0.05). Mean TC, LDL-C and TC/HDL-C levels were higher but not significantly in the diabetics than in the controls (P > 0.05). Mean TG level was significantly higher in the diabetic group than in the control group (P < 0.05) while mean HDL-C level was non- significantly lower in the diabetic group than in the control group (P > 0.05). Mean values for anthropometric parameters (BMI and SBP) were significantly higher in the type 2 diabetic subjects than in the control subjects (P < 0.05) while mean DBP was higher in the diabetic group but not significantly (P > 0.05). A significant positive correlation was observed between insulin resistance and insulin (r = 0.817, P < 0.000), FPG (r = 0.560, P < 0.000) and HBA1c (r = 0.275, P < 0.000) in the entire study, but only with FPG (r =0.482, P <0.000) and insulin (r = 0.803, P < 0.000) in the diabetic group. The results of the current study show an increased insulin resistance level in type 2 diabetic subjects compared to the control group and reference range for insulin resistance was obtained as 0.51 – 2.27. Conclusion In view of the importance of insulin resistance as a powerful predictor of future T2DM, a periodic measurement of insulin resistance is suggested for all.
Keywords: Insulin resistance (IR), HOMA, Type 2 Diabetes Mellitus (T2DM).
Introduction
Diabetes mellitus (DM) affects numerous people worldwide and poses major public health and socioeconomic challenges. The disorder was previously thought to be rare or undocumented in rural Africa, but over the past few decades it has emerged as an important non-communicable disease in sub-Saharan Africa (1, 2, 3). Several reports on global estimates and projections have confirmed a diabetes epidemic and indicated that the numbers of people with diabetes and prevalence of both diabetes and impaired glucose tolerance will rise (4,5). The increases are expected to be largest in developing regions of the world because of population ageing and urbanization (6,7). Estimates from 2009 by the International Diabetes Federation suggest that the number of adults with diabetes mellitus in the world will expand by 54%, from 284.6 million in 2010 to 438.4 million in 2030 (8). Diabetes mellitus (DM) is a group of metabolic diseases in which a person has high blood glucose; either because the pancreas does not produce enough insulin or because cells do not respond to the insulin that is produced(9).
This high blood glucose produces the classical symptoms of derangement of fluid and energy metabolism, seen as polyuria (frequent urination), polydipsia (increased thirst) and polyphagia (increased hunger).
1 Dept of Chemical Pathology, Abu Teaching Hospital, Shika - Zaria, Nigeria
Type 2 diabetes mellitus is characterized by insulin resistance, which may be combined with relatively reduced insulin secretion (9). The defective responsiveness of body tissues to insulin is believed to involve the insulin receptor, however, the specific defects are not known. Cases of diabetes mellitus due to a known defect are classified separately. Type 2 diabetes mellitus is the most common type. In the early stages of type 2 DM, the predominant abnormality is reduced insulin sensitivity. At this stage, hyperglycaemia can be reversed by a variety of measures and medications that improve insulin sensitivity or reduce glucose production by the liver. When control of insulin levels fails, diabetes mellituscan result. As a consequence, insulin is used medically to treat some forms of diabetes mellitus. Patients with type 2 DM are often insulin resistant and, because of such resistance, may suffer from a "relative" insulin deficiency. Some patients with type 2 DM may eventually require insulin if dietary modifications or other medications fail to control blood glucose levels adequately. Over 40% of those with type 2 DM require insulin as part of their diabetes management plan (10).
Insulin resistance (IR) is a physiological condition in which cells fail to respond to the normal actions of the hormone, insulin. The body produces insulin, but the cells in the body become resistant to insulin and are unable to use it as effectively, leading to hyperglycaemia. Beta cells in the pancreas subsequently increase their production of insulin, further contributing to hyperinsulinaemia. This often remains undetected and can contribute to a diagnosis of type 2 DM. One of insulin's functions is to regulate delivery of glucose into cells to provide them with energy (11). Insulin resistant cells cannot take in glucose, amino acids and fatty acids. Thus, glucose, fatty acids and amino acids 'leak' out of the cells. A decrease in insulin/glucagon ratio inhibits glycolysis which in turn decreases energy production. The resulting increase in blood glucose may raise levels outside the normal range and cause adverse health effects, depending on dietary conditions (11). Certain cell types such as fat and muscle cells require insulin for glucose uptake. When these cells fail to respond adequately to circulating insulin, blood glucose levels rise. The liver helps regulate glucose levels by reducing its secretion of glucose in the presence of insulin. This normal reduction in the liver’s glucose production may not occur in people with insulin resistance (11).
Insulin resistance in muscle and fat cells reduces glucose uptake (and also local storage of glucose as glycogen and triglycerides, respectively), whereas insulin resistance in liver cells results in reduced glycogen synthesis and storage and a failure to suppress glucose production and release into the blood. Insulin resistance normally leads to reduced glucose-lowering effects of insulin. However, other functions of insulin can also be affected. For example, insulin resistance in fat cells reduces the normal effects of insulin on lipids and results in reduced uptake of circulating lipids and increased hydrolysis of stored triglycerides. Increased mobilization of stored lipids in these cells elevates free fatty acids in the blood plasma. Elevated blood fatty-acid concentrations (associated with insulin resistance and type 2 diabetes mellitus), reduced muscle glucose uptake, and increased liver glucose production all contribute to elevated blood glucose levels. High plasma levels of insulin and glucose due to insulin resistance are a major component of the metabolic syndrome. If insulin resistance exists, more insulin needs to be secreted by the pancreas. If this compensatory increase does not occur, blood glucose concentrations increase and type 2 DM occurs (11).
Insulin resistance is a common denominator of many diseases in Western societies (12,13) and it is a central component in the so called metabolic syndrome. Other proposed names are “syndrome X” and “the insulin resistance syndrome”. The definition of this syndrome has been extensively discussed. In 1998 the World Health Organization (WHO) recommended a definition of the metabolic syndrome that includes insulin resistance, impaired glucose tolerance (IGT) or type 2 DM as a necessary component combined with at least two among obesity, dyslipidaemia, hypertension and microalbuminuria (14).
It is of great importance to develop tools for quantifying insulin sensitivity/resistance in humans, which may be used to appropriately investigate the epidemiology, pathophysiologic mechanisms, outcomes of therapeutic interventions, and clinical course of patients with insulin resistance. A number of methods have been devised to do this and include:
1. Hyperinsulinaemic Euglycaemic Glucose Clamp (HIEC) originally developed by DeFronzo and is accepted as the “gold standard” (15).
2 Homeostasis Model Assessment (HOMA) which is calculated as HOMA= Fasting Insulin (µIU/mL) X Fasting Glucose (mmol/L)
22.5
Where 22.5 is a normalizing factor obtained from an “ideal and normal” individual (16). 3. Quantitative Insulin Sensitivity Check Index (QUICKI).
QUICKI= 1
(17) and many others.
Defects in insulin action and hyperglycaemia could lead to changes in plasma lipoproteins in patients with diabetes mellitus. Alternatively, especially in the case of type 2 DM, the obesity/insulin-resistant metabolic disarray that is at the root of this form of diabetes could, itself, lead to lipid abnormalities exclusive of hyperglycaemia.
The lipoprotein abnormalities commonly present in type 2 diabetes, previously termed noninsulin-dependent diabetes mellitus, include hypertriglyceridemia and reduced plasma HDL cholesterol. In addition, low density lipoprotein (LDL) are converted to smaller, perhaps more atherogenic, lipoproteins termed small dense LDL (18). In contrast to type 1 diabetes, this phenotype is not usually fully corrected with glycaemic control. Moreover, this dyslipidaemia often is found in pre diabetics, patients with insulin resistance but normal indices of plasma glucose (19). Therefore, abnormalities in insulin action and not hyperglycaemia per se are associated with this lipid abnormality. In support of this hypothesis, some thiazoladinediones improve insulin actions on peripheral tissues and lead to a greater improvement in lipid profiles than seen with other glucose-reducing agents (20). The current study is aimed at evaluating insulin resistance using HOMA as there is paucity of data in our environment.
Materials and Methods
A total of 360 subjects were recruited for the study. These comprised 180 (45 male, 135 female; age: 25 – 70 years) consecutive type 2 diabetic patients attending the diabetic clinic at the Ahmadu Bello University Teaching Hospital, Zaria and 180 (127 male, 53 female; age: 24 – 65 years) apparently healthy subjects from the hospital and Zaria environs as controls.
Ethical approval was obtained from the ethical committee of the Faculty of Medicine (now College of Medical Sciences) ABU/ABUTH,Zaria.
Ten (10) microliters (mls) of fasting venous blood was collected from each subject. Seven (7) mls was dispensed into a plain blood sample bottle appropriately labelled for the subject. This was allowed to clot and the serum was harvested after spinning in the centrifugeat 3000g for 5 minutes. Three (3) mls was carefully dispensed into a fluoride bottle also appropriately labelled for the subject and gently mixed by inversion. Glycated haemoglobin was measured using the whole blood. The plasma was extracted after spinning at 3000g for 5 minutes and was used for glucose estimation.
Full medical history of recruited subjects was obtained including weight, height and blood pressure.
Fasting plasma glucose was estimated using the enzymatic glucose oxidase - peroxidase method(21). Glycated haemoglobin was measured using the Ion Exchange Resin method(22). Total cholesterol and triglycerides were assayed by enzymatic method (21).HDL-C was measured by the precipitation method (23), while LDL-C was calculated using the Friedewald formula (24). Atherogenic index was calculated as a ratio of the TC/HDL-C. Insulin was assayed by the enzyme linked immunosorbent assay method of Anderson et al (25). Insulin resistance was calculated using the Homeostasis Model Assessment (HOMA) method (16).
The data obtained were analysed on Windows Seven using Statistical Package for Social Sciences (SPSS) version 20.0 (2013).The results were compared using the two-tailed Student’s t-test and one way analysis of variance (ANOVA). A P value of equal to or less than 0.05 (P ≤ 0.05) was considered as statistically significant. A correlation analysis was done to evaluate the correlation between insulin resistance and FPG, HbA1c, TG and obesity respectively using Pearson’s correlation.
Results
The results obtained in the present study are presented in tables 1 – 9 and figures 1 -2.
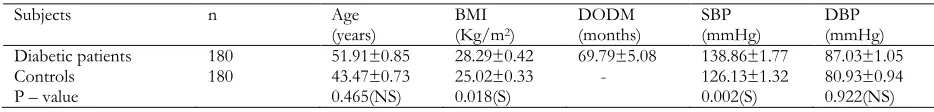
Table 1 shows the clinical parameters of the diabetic and control subjects. The mean values of BMI and SBP were significantly higher (P< 0.05) in the diabetic patients than in the controls.
Table 1 Clinical parameters (mean ±SEM) in diabetic patients and control group.
Subjects n Age
(years) BMI (Kg/m2)
DODM
(months) SBP (mmHg) DBP (mmHg)
Diabetic patients 180 51.91±0.85 28.29±0.42 69.79±5.08 138.86±1.77 87.03±1.05
Controls 180 43.47±0.73 25.02±0.33 - 126.13±1.32 80.93±0.94
P – value 0.465(NS) 0.018(S) 0.002(S) 0.922(NS)
DODM= Duration of Diabetes mellitus SBP= Systolic Blood Pressure
DBP= Diastolic Blood Pressure SEM= Standard Error of Mean
(P< 0.018 and P<0.002) shows significant differences in the clinical parameters (BMI and SBP) between the diabetic and control groups.
S = Statistically Significant (P < 0.05) NS = Not significant (P > 0.05)
Table 2 shows the mean values of FPG, HbA1c, Insulin and Insulin resistance in the diabetic and control subjects. The mean values of all the analytes in the diabetic patients were significantly higher (P < 0.05) than similar values in the controls.
Table 2 FPG, HbA1c, Insulin and Insulin Resistance (HOMA) levels (mean ± SEM) in diabetic patients and controls
Subjects n FPG
(mmol/L) HBA1c (%) Insulin (µIU/ml) Insulin Resistance (HOMA) Diabetics 180 8.86±0.31 8.59±0.18 14.10±0.92 5.79±0.63 Controls 180 4.73±0.06 5.86±0.12 7.54±0.26 1.58±0.06 P – value 0.000(S) 0.000(S) 0.000 (S) 0.000 (S)
n=Number of subjects
FPG= Fasting Plasma Glucose HBA1c=Glycated Haemoglobin SEM= Standard Error of Mean
(P < 0.000) for FPG, HBA1c, Insulin and Insulin Resistance are all significant indicating a significant difference between the diabetic patients and the control group.
S = statistically significant (P < 0.05).
Table 3 shows the mean values of the lipid profile in the diabetic and the non- diabetic subjects. The mean value of TGs was significantly higher (P < 0.05) in the diabetic patients than in the controls. The mean values of the other analytes were similar (P> 0.05).
Table 3 Serum lipid profile (mean ±SEM) in diabetic patients and controls
Subjects n TC
(mmol/L) TG (mmol/L) HDL-C (mmol/L) LDL-C (mmol/L) TC/HDL Diabetic patients 180 4.59±0.72 1.56±0.11 1.31±0.03 2.80±0.20 4.02±0.24
Controls 180 4.34±0.08 1.07±0.04 1.35±0.03 2.52±0.07 3.43±0.08
P – value 0.570(NS) 0.002(S) 0.425(NS) 0.174(NS) 0.111(NS)
n=Number of subjects TC-= Total Cholesterol TG= Triglyceride
HDL-C= High Density Lipoprotein Cholesterol LDL-C= Low Density Lipoprotein Cholesterol
TC/HDL= Ratio of Total Cholesterol to High Density Lipoprotein Cholesterol SEM= Standard Error of Mean
(P < 0.002) shows a significant difference for TG between the groups S = Statistically significant (P < 0.05).
NS = Not significant (P > 0.05).
Table 4 Serum Insulin and Insulin Resistance (HOMA) levels (mean ± SEM) in diabetic patients with good and poor glucose control
Diabetic patients n Insulin
(µIU/mL) Insulin Resistance (HOMA)
Good control
(≤ 6.0mmol/L) 64 15.08±1.76 3.46±0.45
Poor control
(> 6.0mmol/mL) 116 13.56±1.06 7.13±0.93
P – value 0.410(NS) 0.037(S)
n= Number of subjects
SEM= Standard Error of Mean
(P<0.037) indicates a significant difference in Insulin Resistance between the diabetics with good glucose control and those with poor glucose control.
S = Statistically significant (p < 0.05) NS = Not significant (P > 0.05).
Table 5 shows the mean values of IR, insulin and TG in diabetic patients with good and poor HbA1C control. The differences in the mean values of all the analytes in both good and poor HbA1C control were not significant (P > 0.05).
Table 5 Serum Insulin Resistance (HOMA), insulin and TG levels (mean ±SEM) in diabetic patients with good and poor HBA1c control
Diabetic patients n Insulin Resistance (HOMA)
Insulin
(µIU/mL) TG (mmol/l)
Good control
(≤ 6.5%) 31 4.27±0.68 12.16±0.93 1.32±0.10
Poor control
(> 6.5%) 149 6.15±0.75 14.50±1.07 1.61±0.13
P – value 0.321(NS) 0.125(NS) 0.190(NS)
n = Number of subjects SEM= Standard Error of Mean TG = Triglycerides
NS = Not significant (P > 0.05).
Table 6 shows the relation of insulin, IR, FPG, HbA1c and TGs to DODM. No significant relationship was obtained (P > 0.05).
Table 6 Serum insulin, Insulin Resistance (HOMA), FPG, HBA1C and TG levels (mean ± SEM) in
relation to DODM
DODM
(months) n Insulin (µIU/mL) Insulin Resistance (HOMA) FPG (mmol/L) HBA1(%) C TG (mmol/l) <12 16 13.33±2.42 5.36±1.22 8.71±1.14 8.88±0.71 1.24±0.1 12-60 80 14.85±1.44 5.74±0.53 8.81±0.46 8.54±0.26 1.43±0.09 61-120 48 15.00±2.24 7.30±2.13 9.13±0.63 8.31±0.33 1.68±0.34 121-180 17 11.71±0.93 4.93±0.50 10.01±1.09 8.84±0.74 1.88±0.26 >180 8 10.00±1.30 3.65±0.57 8.30±0.59 8.26±0.82 1.08±0.15 P-value 0.511(NS) 0.709(NS) 0.944(NS) 0.595(NS) 0.694(NS)
n = Number of subjects
DODM= Duration of Diabetes Mellitus SEM= Standard Error of Mean
FPG= Fasting Plasma Glucose HBA1C= Glycated Haemoglobin TG = Triglycerides
NS = Not significant (P > 0.05).
Table 7 Serum Insulin Resistance, insulin, FPG, HBA1c and TG levels (mean ± S.E.M) in diabetics in relation to BMI
BMI n Insulin Resistance
(HOMA) Insulin (µIU/mL) FPG (mmol/L) HBA1c (%) TG (mmol/l) HBA1C (%) 18.5-24.9 53 5.81±0.79 14.69±2.11 8.88±0.57 8.85±0.33 1.24±0.09 6.78±0.41 25.0-29.9 66 6.87±1.54 15.38±1.60 8.84±0.55 8.57±0.26 1.40±0.11 7.81±0.33 30.0-34.9 34 4.95±0.53 12.38±1.31 9.38±0.69 8.73±0.42 2.32±0.48 7.49±0.50 35.039.9 19 4.54±0.83 11.42±1.66 8.79±0.86 8.21±0.68 1.65±0.24 7.52±0.74 >40 6 3.41±0.33 12.83±0.98 5.98±0.45 6.78±0.66 1.73±0.31 6.57±0.59 P-value 0.686(NS) 1.000(NS) 0.496(NS) 0.311(NS) 0.011(S) 0.664
n = Number of subjects BMI= Body Mass Index FPG= Fasting Plasma Glucose HBA1c= Glycated Haemoglobin TG = Triglycerides
SEM= Standard Error of Mean
P < 0.011shows a significant difference for triglyceride across the various BMI groups. NS = Not significant (P > 0.05)
Table 8 shows the reference values for IR and insulin in apparently healthy subjects. Percentage diabetics with values above the upper limit of reference range is 80.6 (145/180) and 26.1(47/180) for IR and insulin respectively.
Table 8 Reference values for serum Insulin Resistance and insulin from the present study
Analyte Ref
Range
Unit
Insulin Resistance
0.51 – 2.27
Insulin 0.69-14.39 µIU/mL
Ref range= Reference range.
The reference range was calculated using the formula for parametric method for Gaussian distribution after removal of outliers.
Reference range = X ± 2SD Where X = Mean
SD = Standard Deviation.
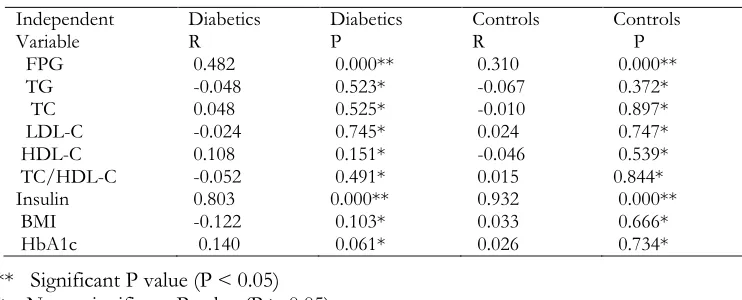
Table 9 shows the correlation between IR and some parameters in the diabetic patients and controls. Significant correlation was observed for only FPG and insulin in both diabetic patients and controls (P < 0.05).
Table 9 Correlation between Insulin resistance and some parameters
** Significant P value (P < 0.05) * Non - significant P value (P > 0.05)
Figures 1 and 2 show the relationship between FPG and IR, insulin and IR in diabetic patients respectively. Significant correlations were observed (P < 0.05).
Independent
Variable Diabetics R Diabetics P Controls R Controls P
FPG 0.482 0.000** 0.310 0.000**
TG -0.048 0.523* -0.067 0.372*
TC 0.048 0.525* -0.010 0.897*
LDL-C -0.024 0.745* 0.024 0.747*
HDL-C 0.108 0.151* -0.046 0.539*
TC/HDL-C -0.052 0.491* 0.015 0.844*
Insulin 0.803 0.000** 0.932 0.000**
BMI -0.122 0.103* 0.033 0.666*
Figure 1 showing the relationship between insulin resistance and FPG in the diabetic group. r = 0.482 shows a moderately strong but positive correlation.
Figure 2 showing the relationship between insulin resistance and insulin in the diabetic group. A strong positive correlation(r = 0.803) exists between the two.
Discussion
Insulin resistance, a pathological situation characterised by reduced tissue sensitivity to insulin and marked compensatory hyperinsulinaemia has continued to generate interest. It has been implicated in the pathogenesis of type 2 diabetes mellitus and essential hypertension and is closely associated with dyslipidaemia, coronary artery disease, obesity and a cluster of metabolic and cardiovascular abnormalities that define the metabolic syndrome (26,27).
controls. This is in agreement with the work of Edo and Adediran, (28) in which they reported higher mean values for SBP in type 2 diabetics than in the non- diabetic controls. This increase they attributed to the higher force needed to pump blood through the narrowed blood vessels associated with artherosclerosis. This higher blood pressure levels in the diabetics could also be as a result of the higher BMI and dyslipidaemia often associated with type 2 diabetes mellitus or components of metabolic syndrome.
Biochemical metabolic analysis has established that fatty acids which constitute the body fat content can be synthesized from simple carbohydrates such as glucose (29). Thus, it is not unexpected for increase in blood glucose to induce increase in body mass index (BMI); as increase in blood glucose associates with increase in lipid synthesis (lipogenesis) and hence, an increase in weight (29). Body mass index was statistically significantly higher in the diabetic patients than in the controls. This is in agreement with the findings of Bays et al, (30) in which they reported that type 2 diabetic men and women had a disproportionate increase in BMI and waist circumference than the rest of the study population. Josiah et al, (31) also reported a positive correlation between blood glucose levels and BMI from their work among some Nigerian undergraduates. Obot et al (32) also reported higher BMI levels in type 2 diabetic subjects than in their non- diabetic counterparts.
Obesity is probably the most important modifiable acquired risk factor in the etiology of type 2 diabetes mellitus (33,34). A prospective study involving normoglycaemic Swedish men followed up for the development of type 2 diabetes mellitus found that the incidence of diabetes mellitus rose by a factor of twenty two when individuals with highest BMI were compared with those who had the lowest BMI (33). These observations are expected as obesity is known to induce insulin resistance (35,36).
Fasting plasma glucose (FPG) levels were significantly elevated in the type 2 diabetic subjects compared to the control group.
Glycated haemoglobin (HBA1c) was also significantly increased in the type 2 diabetic subjects compared to values obtained for the control group.
The findings in the present study are in agreement with the findings of Sadaf et al, (37).
Insulin resistance in muscle and fat cells reduces glucose uptake (and also local storage of glucose as glycogen and triglyceride respectively) whereas insulin resistance in liver cells results in reduced glycogen synthesis and storage, as well as a failure to suppress glucose production and release (13). This leads to the increased blood glucose levels seen in type 2 diabetes mellitus. Increased blood glucose levels in turn, give rise to increased glycated haemoglobin levels which is glucose attached non-enzymatically to haemoglobin throughout the 90 days life time of a red blood cell. It gives insight into the previous three months control of blood glucose level (38).
Derangement in serum lipid levels has been observed in many conditions including insulin resistance which is a feature of type 2 diabetes mellitus (39). This derangement also referred to as dyslipidaemia shows an altered lipid profile which can manifest as raised serum total cholesterol (TC), raised serum triglyceride (TG), decreased serum high density lipoprotein cholesterol (HDL – C), raised low density lipoprotein cholesterol (LDL – C) and raised very low density lipoprotein cholesterol (VLDL – C).
In the present study, HDL-C, LDL-C and TC/HDL ratio (atherogenic index) showed no significant differences between the diabetic and control groups.
This is in agreement with the work of Edo and Adediran, (28) in which they reported no significant difference in TC, HDL-C and LDL-C values between type 2 diabetic patients and controls. Serum triglyceride, on the other hand, showed a statistically significant increase in the diabetic patients than in the controls. This is in agreement with the findings of Farhan et al, (40) and Edo and Adediran, (28) who reported significantly increased levels of triglycerides in type 2 diabetics than in the controls. Sadaf et al, (37), however, reported a non-significant decrease in triglycerides in type 2 diabetic men than in their non-diabetic counterparts. Increased plasma levels of triglycerides (TG) in very low density lipoproteins (VLDL) are not only common characteristics of the dyslipidaemia associated with insulin resistance and type 2 diabetes mellitus (T2DM) but are the central pathophysiologic features of the abnormal lipid profile.
Treatment of the dyslipidaemia in insulin resistant individuals and patients with T2DM has been successful in reducing cardiovascular disease. LDL cholesterol, TG, and HDL cholesterol are all appropriate targets for therapy when diet, exercise, and weight loss do not achieve goals (41).
Serum insulin and HOMA (IR) levels from the present study showed a statistically significant increase in the type 2 diabetic patients compared to the controls. The term “insulin resistance” usually connotes resistance to the effects of insulin on glucose uptake, metabolism, or storage. Insulin resistance in type 2 diabetics is manifested by decreased insulin-stimulated glucose transport and metabolism in adipocytes and skeletal muscle and by impaired suppression of hepatic glucose output. These functional defects may result, in part, from impaired insulin signalling in all three target tissues and in adipocytes, also from downregulation of the major insulin-responsive glucose transporter, GLUT4. In both muscle and adipocytes, insulin binding to its receptor, receptor phosphorylation and tyrosine kinase activity are reduced leading to glucose accumulation and subsequent increased insulin from the pancreas.
Serum insulin resistance showed a positive and significant correlation with fasting plasma glucose and insulin and a negative correlation with triglycerides and BMI in the diabetic group, agreeing with the findings of Tahira et al, (42). Reference ranges for IR and insulin obtained in the present study compare favourably with those obtained by other workers in other studies. Beineke (43) reported HOMA IR as > 2.0 (indicative of insulin resistance) and >2.5 (probable insulin resistance). According to da Silver (44), Optimal Range: 1.0 (0.5–1.4). Less than 1.0 means you are insulin-sensitive which is optimal. Above 1.9 indicates early insulin resistance. Above 2.9 indicates significant insulin resistance.
Insulin values obtained in the present study also agree with values obtained by other workers. For most current radio immunoassay methods the upper limit of the normal range is between 20 and 26 mIU/l, while the lower cut-off is often close to the detection limit, i.e. around 2 mIU/l.
The insulin values given by most enzyme immunoassay methods are generally lower than corresponding RIA values, but only a few studies have involved large population samples. Published fasting insulin plasma concentrations in a small sample of normal subjects were 3.3 ± 0.6 mIU/l (in 8 non-diabetic, non-obese men aged 22-36 years) (45), between 0.7 and 10 mIU/l (in 30 otherwise undefined "controls") (25), and <1.8-10 mIU/l (in 20 healthy subjects with normal fasting plasma glucose, aged 23-47 years) (46).
In a study of 207normoglycaemic non-obese young adults, the reported fasting insulinaemia for up to75% of the population was in the 11mIU/l range (47). Thus, ,taken together, published data converge towards an upper limit of 11 mIU/l and a lower limit close to the detection limit, i.e. around 0.5-1 mIU/l.
Conclusion
In view of the important role insulin resistance can play as an early and powerful predictor of future development of type 2 diabetes mellitus, it is necessary that periodic assessment of insulin resistance be done both in routine screening for T2DM and for management of type 2 diabetic patients.
Acknowledgements
The authors are most grateful for the assistance of the doctors and nurses at the diabetic clinic of ABUTH, Zaria. The immense contributions of colleagues at the Department of Chemical Pathology, ABUTH, Zaria are also sincerely appreciated.
References
McLarty D.G., Pollitt C. and Swai A.B.M. (2009). Diabetes in Africa. Diabet Med mellitus and impaired glucose tolerance in adults: WHO adhoc Metabolic Syndrome and Related Disorders 7: 595–599.
Levitt N.S. (2008). Diabetes in Africa: epidemiology, management and health care challenges. Heart; 4: 1376–1382. Motala A.A., Omar M.A.K. and Pirie F.J. (2008). Epidemiology of diabetes in Africa. In: Ekoe J-M, Rewers M, Williams R, Zimmet P, eds. The epidemiology of diabetes mellitus (2nd edn). Chichester: Wiley, 133–146. Kings H., Aubert R.E. and Herman W.H. (1998). Global burden of diabetes: prevalence, numerical estimates and
projections. Diabetes Care. 21: 1414–1431.
Amos A.F., McCarty D.J. and Zimmet P. (1997). The rising global burden of diabetes And Its complications: estimates and projections to the year 2010. DiabeticMedicine; 12 (suppl 5): S1-85.
Wild S., Roglic G., Green A., Sicree R. and King H. (2004). Global prevalence of diabetes: estimates for the year 2000 and projections for 2030. Diabetes Care . 27: 1047–1053.
Shoback, edited by David G. Gardner, Dolores (2011). Greenspan's basic & clinical endocrinology (9th edition). New York: McGraw-Hill Medical. Chapter 17: 162243 - 162248. ISBN
Banerji M. and Lebovitz H. (1989). Insulin sensitive and insulin resistant variants in IDDM. Diabetes;38:784–792. DeFronzo R.A. and Ferrannini E. (1987) Regulation of hepatic glucose metabolism in humans. Diabetes Metabolism
Review 3(2): 415-459.
Reaven G.M. (1998). Role of insulin resistance in human disease. Diabetes. 37:1595– 1607. 13 DeFronzo R.A. and Ferrannini E. (1991). Insulin resistance. A multifaceted syndrome responsible for NIDDM, obesity, hypertension, dyslipidaemia, and atherosclerotic cardiovascular disease. Diabetes Care 14(3): 173-194. Alberti K.G. and Zimmet P.Z. (1998) Definition, diagnosis and classification of diabetes mellitus and its
complications. Part 1: diagnosis and classification of diabetes mellitus provisional report of a WHO consultation. Diabetic Medicine 15(7): 539-553.
DeFronzo R.A., Tobin J.D. and Andres R. (1979). Glucose clamp technique: a method For quantifying insulin secretion and resistance. American Journal of Physiology 237:E214-223.
Matthews D.R., Hosker J.P., Rudenski A.S., Naylor B.A., Treacher D.F. and Turner R.C. (1985). Homeostasis model assessment: insulin resistance and beta-cell function from fasting plasma glucose and insulin concentrations in man. Diabetologia. 28:412-419.
Mather K.J., Hunt A.E., Steinberg H.O., Paradisi G., Hook G. and Katz A. (2001). Repeatability characteristics of simple indices of insulin resistance: Implications for research applications. Journal of Clinical Endocrinology Metabolism. 86:545754 - 64.
Krauss RM.1994. Heterogeneity of plasma low-density lipoproteins and atherosclerosis risk. Curr Opin Lipidol 5:339 –349
Haffner SM, Mykkanen L, Festa A, Burke JP, Stern MP. 2000.Insulin-resistant pre- diabetic subjects have more atherogenic risk factors than insulin-sensitive pre- diabetic subjects: implications for preventing coronary heart disease during the pre- diabetic state. Circulation.101:975 –980.
Ginsberg H, Plutzky J, Sobel BE.1999. A review of metabolic and cardiovascular effects of oral antidiabetic agents: beyond glucose-level lowering. J Cardiovasc Risk. 6:337– 346.
Trinder, P. (1969). Annals of Clinical Biochemistry 6: 24.
Trivelli L. A., Ranney H. M. and Lai H.T. (1971). Haemoglobin Components of patients with Diabetes. 353-357. Jacobs D.S., Kasten B.L., De Mott W.R., Wolfson W.L and Jacobs D. (1990). Laboratory and Test Handbook;
Lexi-Comp Inc; Hudson 9Cleveland), P 219.
Friedewald W.T., Levy R.I. and Fredrickson D.S. (1972): “Estimation of the Concentration of low density lipoprotein cholesterol in plasma, without the use of the preparative ultracentrifuge”. Clinical Chemistry 18 (6) 499 – 502.
Andersen L., Dinesin B., Jorgensen P.N., Poulsen F. and Roder M.F. (1993) Enzyme immuno assay for intact Human insulin in serum or plasma. Clinical clan 28:578 – 582.
Reaven GM (1991) Insulin resistance and compensatory hyperinsulinemia: role in hypertension, dyslipidaemia, and coronary heart disease. American heart journal.121: 1283–1288.
Rader DJ. (2007) Effect of insulin resistance, dyslipidaemia, and intra- abdominal adiposity on the development of cardiovascular disease and diabetes mellitus. The American journal of medicine.120: S12–518.
Edo A. and Adediran O.S. (2011). “Dyslipidaemia among Nigerian oil workers with type 2 Diabetes Mellitus”.
West African Journal of Medicine. 30; (3): 206 – 209.
Nelson D.L. and Cox M.M. (2005). Lehninger Principles of Biochemistry. 4th (ed), W.H Freeman and Company, New York
Bays H.E, Fox K.M. Grady S. (2010) Anthropometric measurements and diabetes mellitus: clues to the "pathogenic" and "protective" potential of adipose tissue. Metab Syndr Relat Disord.Aug 8 (4):307-15. Josiah I E, Innocent O, ThankGod O O, Sandra E O (2013): Correlation between body mass index and blood
glucose levels among some Nigerian undergraduates. HOAJ Biology 2013, 2:4/10.7243/2050-0874-2-4 Obot A.S., Chinyere A., Usoro O., Nsonwu-Anyanwu A.C., Egbe E.R., Ekott J.U. and Usoro A.J. (2013).
“Adiponectin and Cardiovascular risk factors in relation with glycemic control in type 2 diabetes”.
International Journal of Research in Medical sciences. 1(4):563-570.
Skarfors ET, Selinus KI and Lithell HO. (1991). Risk factors for developing non- insulin dependent diabetes: a 10 year follow up of men in Uppsala. BMJ 303:755-60.
Bakare A.G. and Onyemelukwe G.C. (2005). Total Insulin Output is low in type 2 Diabetic Nigerians. International Journal of Diabetes andMetabolism. 13: 93-95.
Kahn C.R. (1994). Banting Lecture. Insulin action, diabetogenes, and the cause of type II diabetes. Diabetes , 43:1066-1084.
Sadaf D., Jasmin S., Mudassar A.K. and Rasul J. (2013). Relationship of Adiponectin Level with Glycemic Status and Lipid Profile in Type 2 Diabetic Men. Journal of Biomedical sciences. 23 (2); 223-227.
Nathan D.M., Turgeon H. and Regan S. (2007). Relationship between glycated haemoglobin levels and mean glucose level over time. Diabetologia, 50 (11): 2239 - 2244.
Li J Liao C., Su H., Peng Q., Zhang Z., Yan S. and Yang Q. (2011). The relationship among Adiponectin, High Sensitive C Reactive Protein and Triacylglycerol Level in Healthy Young Persons. Lipid in Health and Diseases, 10 (6): 109-113.
Farhan J., Anila J., Jawed A. and Ateur M.R. (2006). “Relationship between adiponectin, glycemic control and blood lipids in diabetic type 2 Postmenopausal women with and without complication of ischemic heart disease”Clinica Chimica ActaVol 370, Issues 1 - 2, 76 – 81.
Ginsberg HN, Le N-A, Gibson JC 1985. Regulation of the production and catabolism of plasma low density lipoproteins in hyper triglyceridaemic subjects. Effect of weight loss. J Clin Invest;75: 614–623.
Tahira N., Riffat Y., Naeema A., Ambreen F., Rubina F.P. and Mukhtiar H. “Insulin Deficiency among Newly Diagnosed Type 2 Diabetics” (2012) Journal of Ayub Medical College Abottabad. 27(1)32; 24(2)
Beineke M, https://www.bioscientia.de/en/files/2011/10/Marker-f0r-the-diagnosis-of-an-Insulin-resistance. Da Silva, R. C. (2007) Insulin resistance, beta-cell function, and glucose tolerance in Brazilian adolescents with
obesity or risk factors for type 2 diabetes mellitus.J Diabetes Compl. 21(2):84–92.
Sobey WJ, Beer SF, Carrington CA. (1989) Sensitive and specific two-site Immunoradiometric assays for human insulin, proinsulin, 65-66 split and 32-33 split proinsulin. Biochem J, 260, 535-541.
Deberg M, Houssa P, Frank BH, Sodoyez-Goffaux F, Sodoyez J-C (1998) Highly specific radioimmunoassay for human insulin based on immune exclusion of all insulin precursors. Clin Chem,44, 1504-1513.