*Corresponding author: [email protected] 33
Simulation, Control and Experimental Analysis of 1,3 Butadiene
Purification Unit
R. Rahimi1*, Sh. Boulaqhi2, E. Ziarifar3
1Shahid Nikbakht, Faculty of Engineering, Department of Chemical Engineering, University of Sistan and
Baluchestan, Zahedan, Iran.
2M.Sc. graduate, School of Graduate Studies, University of Sistan and Baluchestan, Zahedan, Iran.
3Amir Kabir Petrochemical Plant, Mahshahr, Iran.
ARTICLE INFO ABSTRACT
Article history:
Received: 2015-11-08 Accepted: 2016-02-03
Simulation of a process and analysis of its resulting data in both dynamic and steady-state conditions are fundamental steps in understanding the process in order to design an efficient system control, as well as implementing operational cost reduction scheme. In the present paper, steady and unsteady state simulation of Amir Kabir1,3 butadiene purification units has been done by using Aspen and Aspen Dynamic software together with the Peng- Robinson equation of state to investigate the system responses to the disturbances.
In the unsteady state simulation mode the flow rates, pressure, temperature and level (FPTL) were controlled by Proportional-Integral-Derivative (PID) controllers in the unit. Finally, transient responses to changes such as feed temperature, feed flow rates, steam flow rates and the duties of the re-boiler of columns in unit were gained. For reaching purified 1,3 butadiene, sensitivity of the process to the fluctuations of feed temperature and on the duties of the re-boilers of the columns is noticeable.
Keywords:
Simulation Steady-State Dynamic Distillation PID
1. Introduction
Effluents from chemical reactors need to be separated in order to achieve product purity of commercial specifications. Several unit operations are available for this purpose such as adsorption, absorption, and stripping, liquid-liquid extraction, leaching, and distillation. Distillation is the most popular
and important separation method in the petroleum industries for purification of final products.
34 Iranian Journal of Chemical Engineering, Vol. 13, No. 4 (Autumn 2016) vaporization of the liquid, a condenser to
condense the vapor from the top of the column, and a reflux drum to hold the condensed vapor so that liquid reflux can be recycled back to the top of the column. Variation of feed components and its condition are considerable. Therefore, the chosen thermodynamic model greatly affects the column design and prediction of its behavior whilst considering its performance by modeling and simulation. Hence, data of butadiene purification unit [1] were used to analyze the unit behavior and to establish a foundation for its retrofit, say, to more efficient columns such as Dividing or Divided Wall Column (DWC) [2]. Butadiene is a primary feed stock for production of synthesized rubber and polymers such as PER, ABS AND BDSR [1].
Rahimi et al. [3] employed a combination of Peng-Robinson and Peng-Robinson-Twu equations of state for the feed to the columns that were under steady state conditions. Whilst the PR’s equation of state was accepted, the column was modeled under steady and dynamic states using suitable controllers.
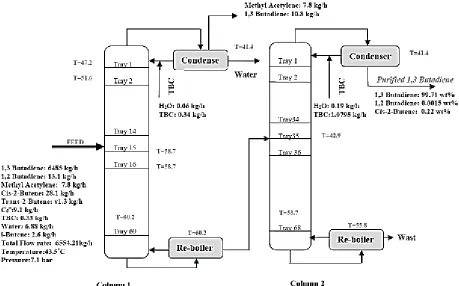
Figure 1 shows the block flow diagram of the two conventional columns for purification of 1,3 butadiene with the necessary data [1, 4]. Feed to the column 1 consisted of 6485 kg/h 1,3 butadiene with purity of 98.95 % which was purified to 99.71 % in column 2 as product.
2. Mathematical and thermodynamic models of the distillation column
In the problems of multiple-stage separation for systems with different phases and different
Iranian Journal of Chemical Engineering, Vol. 13, No. 4 (Autumn 2016) 35 components, it is necessary to specify
sufficient number of design variables so that the number of unknown quantities (output variables) become equal to the number of equations (independent variables). The number of equations can be found and counted in a mathematical model. The usual method to mathematically model a distillation process in refining columns is the theoretical stage method. To find the number of the theoretical stages of an existing column, the real number of stages might be multiplied by column efficiency. For each theoretical stage, the mass balance of individual components or pseudo components, energy balance, and vapor-liquid equilibrium equations can be written. The set of these equations creates the mathematical model of a theoretical stage.
For selecting thermodynamic model, range of pressure and temperature, type of real components in the solution, polar or non-polar components and number of real phases in process are considered. For the set of components in the unit(see Tables 1 and 2), Braun K10 “BK10”, Chao-Seader and Peng-Robinson equation of states were examined. Those models are suitable for mixtures of heavier hydrocarbons and non-polar or mildly polar components [5]. Tables 1 and 2 show simulated results for top products of columns 1 and 2 by using each of those three thermodynamic models.
Even though the use of Peng-Robinson-Twu equation has been reported for first column and Peng-Robinson equation for second column [2], the Peng-Robinson equation of state was selected for the 1,3 butadiene purification unit. As the result of simulation for temperature, pressure and mass percent of
Table 1
Model predictions of top product of column 1 by using different EOS.
Plant data[1] Equation of State
Components
rates (kg/hr)
Peng-Robinson B-K10 Chao-Seader 8.0 7.38 7.80 7.80 PROPYNE 0.01 0.00 0.01 I-BUTENE 0.00 0.00 0.00 TRANS-01 0.00 0.00 0.00 CIS-2-01 10.8 10.92 3.63 3.62 1,3BUTAD-IENE 0.00 0.00 0.00 1,2BUTAD-IENE 0.00 0.00 0.00 C5+HC 0.00 6.88 6.88 WATER 18.8 18.31 18.31 18.31 Total flow 41.4 47.04 39.34 6.83 Temperature (˚C)
7 6.99 6.99 6.99 Pressure(bar) Table 2
Model predictions of top product of column 2 by using different EOS.
Plant data
[1] Equation of State
Components
rates (kg/hr)
Peng-Robinson B-K10 Chao-Seader - 0.42 0.00 0.00 PROPYNE 2.9 2.59 2.59 2.59 I-BUTENE 1.4 0.92 1.06 0.86 TRANS-01 14.3 10.45 12.57 10.39 CIS-2-01 6449.4 6454.30 6452.58 6453.36 1,3 BUTAD-IENE 0.1 0.23 0.12 1.41 1,2 BUTAD-IENE 0.1 0.00 0.00 0.00 C5+HC 0.33 0.00 0.00 0.00 WATER 6468.53 6468.92 6468.93 6468.92 Total flow 41.7 41.26 45.28 42.91 Temperature (˚C)
4.5 4.49
4.50 4.49
Pressure(bar)
components in top and bottom streams of distillation columns are very near to the operational columns data [1].
3. Mathematical modeling equations 3.1. Mathematical model
36 Iranian Journal of Chemical Engineering, Vol. 13, No. 4 (Autumn 2016) given in Fig. 2.
3.2. Mass balance equation
Mass balance equation for each component, j, over each tray, n, is given in Equation 1.
𝑑𝑑𝑑𝑑𝑛𝑛,𝑗𝑗
𝑑𝑑𝑑𝑑 =𝐹𝐹𝑖𝑖𝑛𝑛𝑣𝑣𝑣𝑣𝑣𝑣𝑦𝑦𝑗𝑗,𝑖𝑖𝑛𝑛+ 𝐹𝐹𝑖𝑖𝑛𝑛𝑙𝑙𝑖𝑖𝑙𝑙𝑥𝑥𝑗𝑗,𝑖𝑖𝑛𝑛+ 𝐹𝐹𝑓𝑓𝑓𝑓𝑓𝑓𝑓𝑓𝑧𝑧𝑓𝑓𝑓𝑓𝑓𝑓𝑓𝑓
− 𝐹𝐹𝑜𝑜𝑜𝑜𝑜𝑜𝑣𝑣𝑣𝑣𝑣𝑣𝑦𝑦𝑗𝑗,𝑜𝑜𝑜𝑜𝑜𝑜 − 𝐹𝐹𝑜𝑜𝑜𝑜𝑜𝑜𝑙𝑙𝑖𝑖𝑙𝑙𝑥𝑥𝑗𝑗,𝑜𝑜𝑜𝑜𝑜𝑜
− 𝐹𝐹𝑠𝑠𝑖𝑖𝑓𝑓𝑓𝑓𝑥𝑥𝑗𝑗,𝑜𝑜𝑜𝑜𝑜𝑜 (1)
The left side of equation (1) is equal to zero at steady state.
3.3. Energy balance equation
Dynamic general energy balance of tray n is given by equation (2).
𝑑𝑑(𝑑𝑑𝑛𝑛ℎ𝑛𝑛)
𝑑𝑑𝑑𝑑 = 𝐹𝐹𝑖𝑖𝑛𝑛𝑣𝑣𝑣𝑣𝑣𝑣ℎ𝑖𝑖𝑛𝑛𝑣𝑣𝑣𝑣𝑣𝑣+𝐹𝐹𝑖𝑖𝑛𝑛𝑙𝑙𝑖𝑖𝑙𝑙ℎ𝑖𝑖𝑛𝑛𝑙𝑙𝑖𝑖𝑙𝑙
+ 𝐹𝐹𝑓𝑓𝑓𝑓𝑓𝑓𝑓𝑓ℎ𝑓𝑓𝑓𝑓𝑓𝑓𝑓𝑓− 𝐹𝐹𝑜𝑜𝑜𝑜𝑜𝑜𝑣𝑣𝑣𝑣𝑣𝑣ℎ𝑜𝑜𝑜𝑜𝑜𝑜𝑣𝑣𝑣𝑣𝑣𝑣
− 𝐹𝐹𝑜𝑜𝑜𝑜𝑜𝑜𝑙𝑙𝑖𝑖𝑙𝑙ℎ𝑜𝑜𝑜𝑜𝑜𝑜𝑙𝑙𝑖𝑖𝑙𝑙 − 𝐹𝐹𝑠𝑠𝑖𝑖𝑓𝑓𝑓𝑓ℎ𝑜𝑜𝑜𝑜𝑜𝑜𝑙𝑙𝑖𝑖𝑙𝑙 +𝑄𝑄𝑀𝑀
−𝑄𝑄𝑠𝑠− 𝑄𝑄𝑙𝑙 (2)
The left side of equation (2) is equal to zero at steady state.
3.4. Vapor-liquid equilibria
Vapor-liquid equilibrium of component j for theoretical stage n is given by equation 3[5]:
𝑦𝑦𝑛𝑛,𝑗𝑗 = 𝛾𝛾𝑛𝑛,𝑗𝑗𝑝𝑝𝑛𝑛,𝑗𝑗 𝑠𝑠𝑣𝑣𝑜𝑜
𝛷𝛷𝑛𝑛,𝑗𝑗𝑝𝑝𝑛𝑛 𝑥𝑥𝑛𝑛,𝑗𝑗
(3)
The fugacity, Φn,j, and activity coefficients
γn,j, are equal to unity for the ideal vapor and
liquid phases, respectively. For ideal cases equation 3 becomes Rauolt’s law.
𝑦𝑦𝑛𝑛,𝑗𝑗𝑝𝑝𝑛𝑛 = 𝑝𝑝𝑛𝑛𝑠𝑠𝑣𝑣𝑜𝑜,𝑗𝑗𝑥𝑥𝑛𝑛,𝑗𝑗 (4)
Figure 2. Shows a column tray streams.
However, Peng-Robinson EOS was used for calculation of fugacity and activity coefficients as mentioned in section 2.
4. Simulation
4.1. Steady-state simulation
Amir Kabir petrochemical plant has a unit for purification of 1,3 butadiene product. The unit consists of two distillation columns, two condensers and two re-boilers. Propylene distillation column, column 1 or first column, in series with column 2 or second final distillation column are the main parts of the unit (see Fig. 1). Important parameters for the steady state simulation of each column are number of stages, type of condenser and re-boilers, distillate rate and reflux ratio, feed stage, top stage pressure and column pressure drop. The feed with mass flow rate of 6553.88 kg/hr of liquid butadiene, pressure of 7.1 bara and temperature of 43.5˚C, were entered to the fifteenth stage of the first distillation column with 60 theoretical stages. Stages numbering started from the top of the column. The top product is propene and bottom product was entered to the thirty fifth stage of the second distillation column with 68 theoretical stages. Table 1 shows mass flow rates of the first column’s top products, and Table 2 shows mass flow rates of the second column’s top products that are enriched in 1,3 butadiene. Figures 3 and 4 show temperature and 1,3 butadiene mass percentage changes curve of second column top product with feed flow rate changes in range of 6500 kg/hr to 8000 kg/h.
Iranian Journal of Chemical Engineering, Vol. 13, No. 4 (Autumn 2016) 37
Figure 3. Top product temperature change of
second column with feed flow rate.
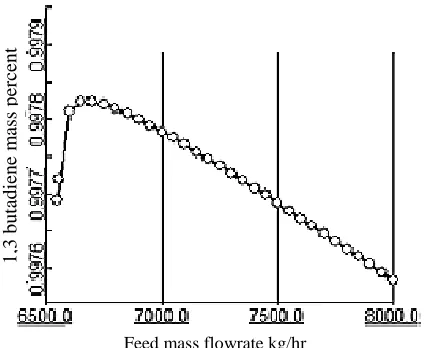
Figure 4. 1,3 butadiene mass percentage changes with respect to feed flow rate for second column top product.
Those figures show that increasing feed flow rate causes decrease of top product temperature and purity, but at low mass flow rate of 6650 kg/h there is a maximum purity of 99.78 %. Figures 5 to 10 show variation of temperature and important component mass percentage in different stages of the columns. These variations follow the normal behavior ie., temperature increases from stage 1, top of the column towards stages at the bottom of the
columns. However, shape of the curves for the two columns does not follow the same trend.
4.2. Dynamic simulation
By using dynamic simulation important information can be obtained, which would not have been obtained using steady state calculations. The steady state method can only determine the initial and final states of the systems.
Figure 5.Temperature curve in different stages of first column.
Figure 6.Temperature curve in different stages of second column.
Te
m
per
at
ur
e
◦C
Te
m
per
at
ur
e
◦C
Te
m
per
at
ur
e
◦C
Feed mass flowrate kg/hr
Feed mass flowrate kg/hr
1
,3
b
u
tad
ien
e
m
as
s p
er
cen
t
Stage
38 Iranian Journal of Chemical Engineering, Vol. 13, No. 4 (Autumn 2016)
Figure 7. methyl acetylene and 1,3 butadiene mass percent curve in first column.
Figure 8. methyl acetylene, 1,3 butadiene and Cis mass percent curve in second column.
To observe the effects of pressure, temperature, feed flow and other changes in the products of the unit and investigation of results in real processes, the steady-state simulation is exported to dynamic simulation. In steady state simulation, quantity of controllers parameters is not necessary, but for dynamic simulation before sending the steady-state files to dynamic domain, the
Figure 9. Changes curve of liquid and gas mass flow rate in first column.
Figure 10. Changes curve of liquid and gas mass flow rate in second column.
quantities of controller’s parameters should
be defined. For example, dynamic
requirements of column are column diameter, tray spacing, tray active area, weir length, weir height, reflux drum length and diameter, and sump length and diameter. Of course, all of the dynamic simulation requirements were provided by Research and Development
(R&D) Department of Amir Kabir
Petrochemical Company (AKPC).
M
as
s f
lo
w
kg/
h
r
M
as
s f
lo
w
kg/
h
Iranian Journal of Chemical Engineering, Vol. 13, No. 4 (Autumn 2016) 39 After entering and exporting data to dynamic
simulation in order to control the flow, pressure, temperature and level of streams, especially all products when feed flow rate changes, controllers were added in the right places in the dynamic space. For all controllers in the dynamic domain the PID model was selected.
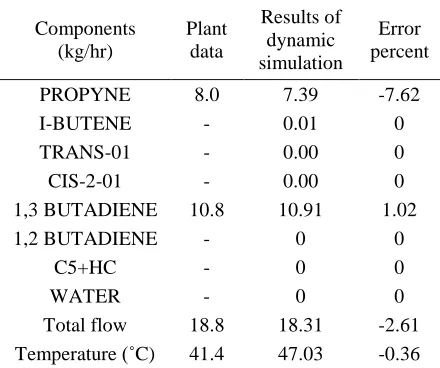
Table 3 shows results of dynamic simulation for first column top flow. Table 4 shows results of dynamic simulation for second column top flow.
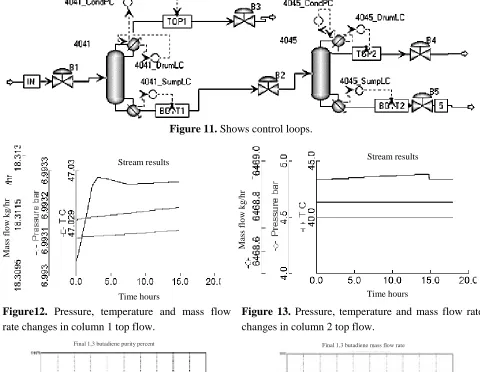
Figure 11 shows dynamic simulation scheme of 1,3 butadiene purification unit. The location of controllers on Fig. 11 is in accordance with the operational unit. For dynamic simulation of the unit, two condenser pressure controllers, two level controllers for the top of each column, and two level controllers for the bottom of each column were installed.
Figure 12 shows variation of mass flow rates, temperature and pressure with time for the first column, whilst Fig. 13 is that for the second column. The effect of controller on the smoothness of the variation of temperature and product purity with feed is noticeable [5].
5. Discussion of the simulation and experimental results
The steady and unsteady state or dynamic results were analyzed by employing the MATLAB®/ Simulink TM software together with Aspen plus [6-8]. The analysis is shown in Figs. 14 to 20. Transient responses to changes of feed temperature, feed flow rates, steam flow rates and the duties of the reboilers of columns in the 1,3 butadiene purification are given.
Table 3
Results of dynamic simulation for first column top flow. Error percent Results of dynamic simulation Plant data Components (kg/hr) -7.62 7.39 8.0 PROPYNE 0 0.01 - I-BUTENE 0 0.00 - TRANS-01 0 0.00 - CIS-2-01 1.02 10.91 10.8 1,3 BUTADIENE 0 0 - 1,2 BUTADIENE 0 0 - C5+HC 0 0 - WATER -2.61 18.31 18.8 Total flow -0.36 47.03 41.4 Temperature (˚C)
Table 4
Results of dynamic simulation for second column top flow. Error percent Results of dynamic simulation Plant data Parameters (kg/hr) -0.41 PROPYNE -10.69 2.59 2.9 I-BUTENE -32.86 0.94 1.4 TRANS-01 -26.01 10.58 14.3 CIS-2-01 0.07 6454.17 6449.4 1,3 BUTADIENE - 0.22 0.1 1,2 BUTADIENE - 0 0.1 C5+HC - 0.00 0.33 WATER 0.01 6468.92 6468.53 Total flow -1.06 41.26 41.7 Temperature (˚C)
0 4.5
4.5 Pressure(bar)
40 Iranian Journal of Chemical Engineering, Vol. 13, No. 4 (Autumn 2016)
Figure 11. Shows control loops.
Figure12. Pressure, temperature and mass flow rate changes in column 1 top flow.
Figure 13. Pressure, temperature and mass flow rate changes in column 2 top flow.
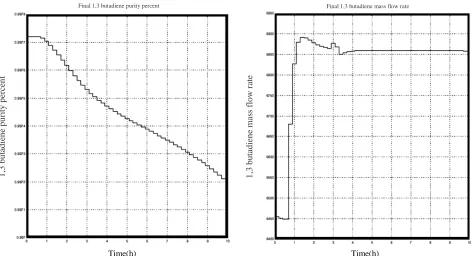
Figure 14. Curves of a) final 1,3 butadiene purity percentage and b) final 1,3 butadiene mass flow rate with
change of feed mass flow rate.
1,
3 b
ut
adi
e
n
e pur
it
y
p
er
ce
n
t
1
,3
b
u
ta
d
ie
n
e m
as
s f
lo
w
r
at
e (
k
g
/h
)
M
as
s f
lo
w
kg/
h
r
M
as
s f
lo
w
kg/
h
r
Stream results Stream results
Time hours Time hours
Iranian Journal of Chemical Engineering, Vol. 13, No. 4 (Autumn 2016) 41
1
,3
bu
ta
di
ene
pur
it
y pe
rc
ent
1
,3
b
u
tad
ien
e m
as
s f
lo
w
r
at
e
Time(h) Time(h)
Figure 15. Curves of final 1,3 butadiene purity percentage and final 1,3 butadiene mass flow rate with
change of feed temperature (+ 4.5°C).
1
,3
bu
ta
di
ene
pur
it
y pe
rc
ent
1
,3
b
u
tad
ien
e m
as
s f
lo
w
r
at
e
Time(h) Time(h)
Figure 16. Curves of final 1,3 butadiene purity percentage and final 1,3 butadiene mass flow rate with
change of feed temperature (- 4.5°C).
Final 1,3 butadiene mass flow rate Final 1,3 butadiene purity percent
42 Iranian Journal of Chemical Engineering, Vol. 13, No. 4 (Autumn 2016)
1
,3
bu
ta
di
ene
pur
it
y pe
rc
ent
1
,3
b
u
tad
ien
e m
as
s f
lo
w
r
at
e
Time(h) Time(h)
Figure 17. Curves of final 1,3 butadiene purity percentage and final 1,3 butadiene mass flow rate with
change of re-boiler duty of first column (+ 2 %).
1
,3
bu
ta
di
ene
pur
it
y pe
rc
ent
1
,3
b
u
tad
ien
e m
as
s f
lo
w
r
at
e
Time(h) Time(h)
Figure 18. Curves of final 1,3 butadiene purity percentage and final 1,3 butadiene mass flow rate with
change of re-boiler duty of first column (– 2 %).
Figures 15 and 16 show that temperature changes of about ±1˚C do not affect
percentage of purity of final 1,3 butadiene but decrease it with more changes in temperature.
Final 1,3 butadiene purity percent
Final 1,3 butadiene mass flow rate
Iranian Journal of Chemical Engineering, Vol. 13, No. 4 (Autumn 2016) 43
1
,3
bu
ta
di
ene
pur
it
y pe
rc
ent
1
,3
b
u
tad
ien
e m
as
s f
lo
w
r
at
e
Time(h) Time(h)
Figure 19. Curves of final 1,3 butadiene purity percentage and final 1,3 butadiene mass flow rate with
change of re-boiler duty of second column (+ 2 %).
1
,3
bu
ta
di
ene
pur
it
y pe
rc
ent
1
,3
b
u
tad
ien
e m
as
s f
lo
w
r
at
e
Time(h) Time(h)
Figure 20. Curves of final 1,3 butadiene purity percentage and final 1,3 butadiene mass flow rate with
change of re-boiler duty of second column (- 2 %).
Figures 17 to 20 show that in both columns with increase in duties of the reboilers,
decrease of the percentage of purity of final 1,3 butadiene would occur. Purity of final 1,3
44 Iranian Journal of Chemical Engineering, Vol. 13, No. 4 (Autumn 2016) butadiene product of second column is
sensitive to the variation of reboilers heat duty.
6. Conclusions
Simulation results from the steady-state and the dynamic simulations are in agreement with plant data. The differences are negligible. It shows that virtual control of variables in dynamic simulation as a flexible simulator can eliminate an expensive real pilot experimentation..
It was found that the system is more sensitive to changes in the feed temperature and the duties of the re-boilers than the variation of feed flow rate. Therefore, it was recommended that attention on feed temperature and re-boiler duty should be increased.
Acknowledgment
The authors would like to thank the Research and Development Department and also Operation and Process Department of 1,3 Butadiene plant of Amir Kabir Petrochemical Company for providing the opportunity to visit the plant and use the plant data. [www.akpc.ir].
Nomenclature
AD,n surface area of the down-comer [m2]. AT,n active surface area of the nth stage [m2].
Finliq molar flow of input liquid on nth stage [mol.s-1].
Finvap molar flow of input vapor on nth stage [mol.s-1].
Foutliq molar flow of output liquid from nth stage [mol.s-1].
Foutvap molar flow of output vapor from nth stage [mol.s-1].
Fside molar side stream from nth stage [mol.s
-1].
Ffeed molar feed flow on nth stage [mol.s-1].
hinliq molar enthalpy of input liquid on nth stage [J.mol-1].
hinvap molar enthalpy of input vapor on nth stage [J.mol-1].
houtliq molar enthalpy of output liquid from nth stage [J.mol-1].
houtvap molar enthalpy of output vapor from nth stage [J.mol-1].
hn molar enthalpy of the liquid on nth stage [J.mol-1].
hf molar enthalpy of feed [J.mol-1]. hT,n liquid height on nth stage [m].
hD,n liquid height on the down-comer [m].
Mn liquid mole accumulated on nth stage
(liquid holdup on nth stage) [mol.s-1]. Mn,j liquid mole accumulated of component j
on nth stage [mol.s-1]. QM heat of mixing [kW]. QS external heat source [kW]. QL heat losses [kW].
xj,in molar fraction of component j in the input
liquid on nth stage.
xj,out molar fraction of component j in output
liquid current from nth stage.
yj,in molar fraction of component j in the input
vapor on nth stage.
yj,out molar fraction of component j in the
output vapor current from nth stage. zfeed molar fraction of component j in the feed
current on nth stage.
ρnliq liquid density at nth stage [mol.m
-3].
Reference
[1] Amirkabir Petrochemical Company,
Design Document.
[2] Yildirim, O., Kiss, A.A. and Kenig, E.Y., “Dividing wall columns in chemical process industry: A review on current activities”, Separation and Purification Technology, 80(3), 403-417(2011).
Iranian Journal of Chemical Engineering, Vol. 13, No. 4 (Autumn 2016) 45 Sadrzadeh Moghdam, F., “Simulation of
butadien plant”, 14th National Chemical Engineering Congress, Sharif University of Technology, Tehran, Iran, (persian language), (1391).
[4] Sodmand, M.H., “Modeling divided wall column”, M.Sc. Thesis, University of Sistan and Baluchestan, Zahedan, Iran, (persian language), (1391).
[5] Mohammadi Doust, A., Shahraki, F. and Sadeghi, J., “Simulation, control and sensitivity analysis of crude oil distillation unit”, Journal of Petroleum and Gas
Engineering, 3(6),99-113 (2012).
[6] Lee, B.I. and Kesler, M.G., “A generalized thermodynamic correlation based on three parameter corresponding states”, AIChE. J., 21(3), 510 (1975).
[7] Luyben, W.L., Distillation design and control using aspen simulation, John Wiley & Sons, New York, p. 10-283 (2006).