*Corresponding author: [email protected] 17 Vol. 14, No. 2 (Spring 2017), IAChE
A Numerical Simulation Model of Solid Acid Fuel Cell Performance
by CsH
2PO
4Electrolyte
I. Omidi, M. Kalbasi*
Chemical Engineering Department, Amir Kabir University of Technology, P. O. Box: 15875-4413, Tehran, Iran
ARTICLE INFO ABSTRACT Article history:
Received: 2016-04-01 Accepted: 2016-09-25
The performanceof the solid acid fuel cell by CsH2PO4 electrolyte was
analyzed using the presentmodel of the electrochemical reaction and transportphenomena, which are fully coupled with the governing equations. Development of such a model requires creating the three-dimensional geometry and its mesh grid, discretization of momentum, mass and electric charge balance equation and solving the equations based on the information of electrical and electrochemical models in different areas of the cell consisting of porous electrodes, gas channels, and the solid parts like the current collector. The model equations were solved employing a finite elements technique solver of cell potential. Different parameters including current density (i), cell potential (V), cell power and concentration distribution of hydrogen, oxygen and water vapor have been investigated in this study. Also, the effect of different voltages on the concentration distribution of all the mentioned species through the cell length are taken into account. The results showed that there is a noticeable difference between H2, O2 and
H2O concentration through the cell length subjected to various
voltages. This difference was more apparent at lower voltages due to higher current density and higher consumption of species. The polarization curve is suitably consistent with the modeland experimental data which verify the present simulation results.
Keywords:
SAFC Fuel Cells
CsH2PO4 Electrolyte
Solid Acids Composite
1.Introduction
Due to their high efficiencies and low pollution levels fuel cells are becoming attractive alternatives to combustion engines for electrical power generation [1-5]. In recent years, new fuel cells based on solid acid electrolytes, such as the compounds
CsH2PO4 and CsHSO4, have resulted in
higher power density and lower cost
membranes [6-8].
18 Iranian Journal of Chemical Engineering, Vol. 14, No. 2 (Spring 2017) conduction through solid acids is several
orders of magnitude higher than that of electron conduction.
CsH2PO4 belongs to a category of solid acid
electrolytes known as MH2XO4 type solid
acids. The M represents an atom in the alkali group, such as cesium, potassium or rubidium, while the X is an atom of the pnictogens group (5a) such as phosphorus or arsenic [11-15]. When a normal acid, such as phosphoric acid, reacts with a normal salt such as cesium phosphate, it ends up with cesium dihydrogen phosphate as shown below:
4 2 4
3 4
3PO 2H PO 3CsH PO
Cs (1)
This particular acid has been chosen because it is relatively well characterized, low cost, high power density, flexibility in fuel choice and its superprotonic phase has a reasonably wide temperature range of stability, from the transition at 228 ˚C to dehydration at temperatures higher than 260
˚C. In these temperatures CsH2PO4
dehydrates to solid CsPO3 with a decrease of
conductivity as shown below [16-19]:
O H CsPO PO
CsH2 4 3 2 (2)
The high operating temperature for
CsH2PO4 based fuel cells opens up
possibilities for the direct utilization of fuel
cells other than hydrogen. Because CsH2PO4
undergoes such a remarkable change in proton conductivity when transitioning from the lower temperature to the superprotonic phase, the mechanics of proton conduction are of interest. In the mechanism of proton
conduction in CsH2PO4 proposed by
Grotthus, a proton transfers along hydrogen
bonding between two adjacent PO4-3 groups
(B in Fig. 1). This group rotates bringing the attached proton into proximity with a different PO4-3 group (C in Fig. 1) and then
proton transfer along the newly formed
hydrogen bond to the next PO4-3 group (D in
Fig. 1) [20-22].
Figure 1. Grotthus mechanism of proton conducting in CsH2PO4.
Yang et al. [23] have reported approaches to
the development of high temperature
membranes for proton exchange membrane
fuel cells. The viability of CsH2PO4 based
fuel cells was first studied by the authors in
[24].The feasibility of CsH2PO4 to be used as
the electrolyte for both hydrogen and methanol fuel cells under intermediate
conditions, and later the polarization
measurements reported by Otomo et al. in [25] were demonstrated. Haile et al. [26]
studied phase transition behavior,
conductivity and configurational entropy of
superprotonic CsH2PO4. Ponomareva et al.
[27] presented a comparative study of transport and thermodynamic properties of
CsH2PO4. Xie et al. [28] reported a composite
electrolyte membrane based on CsH2PO4,
sulfonated poly (ether ether ketone) and phosphosilicate sol. The prepared electrolyte membrane exhibits excellent mechanical performance. Qing et al. [29] prepared
CsH2PO4/epoxy composite electrolytes by
Iranian Journal of Chemical Engineering, Vol. 14, No. 2 (Spring 2017) 19 high thermal stability with no weight loss or
phase transformation up to 290 ˚C.
Despite rapid progress in solid acid fuel cells, optimization of these systems for commercial use is a great challenge for the researchers. For this purpose, mathematical models and simulation are employed as tools to design optimized fuel cells, stacks and the fuel cell power system. For example, modeling of a solid oxide fuel cell based on the transient behavior of the chemical reactions was reported in [30] and a dynamic model of a high temperature proton exchange membrane fuel cell with a fuel processor is developed in [31]. However, to the best knowledge of the authors, there are few published reports on the investigation of solid acid fuel cell by CsH2PO4 electrolyte in the
literature.
The purpose of this study is to develop a model to predict the three-dimensional solid acid fuel cell operating parameters, such as the concentration distribution, current density and the polarization curve. We first generate the geometry and its mesh grid then we discretize and solve momentum, mass and electric balance equations simultaneously. This model investigates the steady-state transport of reactants and water in a cell including both anode and cathode mass and momentum transport phenomena in the flow channels, gas diffusion layers (GDLs) and porous electrodes, as well as electrochemical currents in the GDLs, the porous electrodes and the electrolyte.
2. Theory
The solid acid fuel cell is comprised of two electrodes (anode and cathode) separated by a solid membrane acting as an electrolyte. Fuel flows through a network of channels toward the anode, where it dissociates into protons.
Then, protons flow through the membrane toward the cathode and electrons that are collected as electrical current by an external circuit linking the two electrodes. The oxidant (air in this study) also flows through a similar network of channels to the cathode. Then electrons in the external circuit and the protons flowing through the membrane mingle with oxidant and produce water. Here, the electricity current is generated by a flow of electrons from the anode toward the cathode through the external circuit. We may utilize the number of cells in a series to make up a stack to deliver sufficient electricity. The electrochemical reactions involved in a solid acid fuel cell are as follows:
H e
H2 2 2 (3)
O H e
H
O2 4 4 2 2 (4)
O H O
H2 2 2
2
1
(5)
The primary assumptions used in the development of our model are:
Gas diffusion layers, catalyst layers
and electrolyte are considered
homogeneous and isotropic porous media.
Flow is laminar and incompressible
due to the low velocities and pressure gradients.
Electrochemical reactions take place
at the electrode-electrolyte
boundaries.
All gas mixtures are assumed to
behave as ideal gas and the cell
operates under steady-state
conditions.
20 Iranian Journal of Chemical Engineering, Vol. 14, No. 2 (Spring 2017) GDLs), each using a thinner electro-catalyst
layer on the face to contact with the
interposed electrolyte.
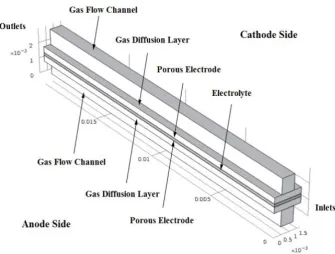
Figure 2. Schematic of solid acid fuel cell.
A three-dimensional solid acid fuel cell with co-current flow direction of air and fuel
is modeled. Figure 3 shows the geometry of modeled fuel cell in detail.
Figure 3. A 3D solid acid fuel cell model computational domain.
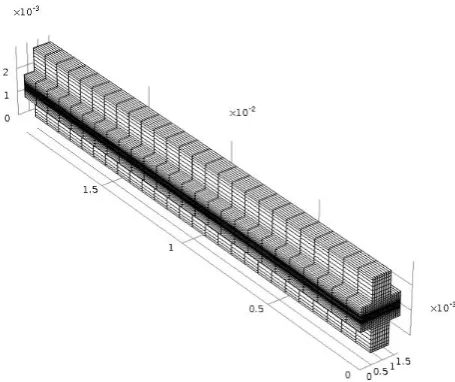
During the mesh generation, we first created a mapped two-dimensional mesh in the plane normal to the channel direction, and then mesh is swept along the channel direction
Iranian Journal of Chemical Engineering, Vol. 14, No. 2 (Spring 2017) 21 Figure 4. Mesh grid of solid acid fuel cell model.
2.1. Electrochemical currents
This modelling calculates parameters such as the cell voltage, the current density, and the gas composition of both anode and cathode of the fuel cell. When the equilibrium in the electrochemical reaction is established, the change in Gibbs free energy (G) pertaining to the electrochemical force is calculated using the following equation:
) ln( 2 2 2 0 K F RT F G F G
E
(6)
The Nernst equation (Eq. 7) gives the open circuit cell potential (∆E) as a function of cell temperature (T) and the reactant partial pressures (Pi).
) ln( 2 ) 15 . 298 ( 10 85 . 0 5 . 0 5 . 0 3 0 2 2 2 P P P P F RT T E E O H O H Nernst (7)
where ∆E0 represents the reference potential
at unity activity, R is the universal gas constant, P and F are the total pressure inside the stack and Faraday constant, respectively. Electrochemical reactions taking place in the solid acid fuel cell generate the electricity current. Three classes of voltage drop, namely
the activation (ηact), ohmic (ηohm), and
concentration (ηconc) over-voltages are
responsible for reduction in output voltage. Thus, a holistic equation for the output voltage calculation can be written as:
conc ohm act Nernst Cell E
V (8)
Slowness of the individual chemical reactions performed at the two electrodes are the primary cause of activation losses (ηact),
which are related to the energy barrier that the reactive species must overcome in order to sustain the reaction. The rate of current density upon the interface pertains to the activation over-potential proposed by the Butler-Volmer equations: )] exp( ) [exp )
( 0.5 , ,
, 0 2 2 a act c a act a ref H H ref a a RT F RT F C C i
i
(9) where ia is the current density in anode, i0
represents the pre-exponential coefficient, αa
and αc are so-called anodic and cathodic
charge transfer coefficients and C is
concentration. Tafel’s equation offers
22 Iranian Journal of Chemical Engineering, Vol. 14, No. 2 (Spring 2017) c c a ct A ref O O ref c c C C i i , 2 2 10 ) ( , 0 (10)
where ic is the current density in cathode
and Ac is the so-called Tafel slope. The
voltage drop related to the resistance to the electron flow in the electrodes and the resistance to the ionic flow in the electrolyte
is denoted by ohmic losses (ηohm). Ohm’s law
is used to calculate the associated potential loss as follows:
) ( eleco ionico
o ohm
ohm i
R i R R (11)
The value of the resistance (Ro) can be
obtained theoretically, but for a rigorous determination it should be related to the operative conditions (e.g. temperature) and structure (thickness, materials, etc.) of each component of the cell, including both ionic and electronic mechanisms of conduction as:
t
Ro (12)
where t is thickness and σ is ionic or electric conductivity. Mass transfer resistance of the reacting species within the pores of the electrodes results in concentration loss. Reacting species have to diffuse through the pores of the electrodes to reach the sites where the electrochemical reaction takes
place. The concentration voltage drop ηconc is
expressed by: ) 1 ln( 2 Max conc i i F RT (13)
The currents in solid acid fuel cells fall into two categories: ionic current and electronic current. Charge balance equations are solved to obtain solid phase and electrolyte phase potentials by using ohm’s law:
e S
eff
e
.( ) (14)
ieff i S
.( ) (15)
where σeeff is effective electronic
conductivity of the solid phase, σieff is
effective protonic conductivity of the
membrane, φe and φi are solid phase and
electrolyte phase potentials, respectively. We
may set source term Sφ to zero in these
domains since no reaction takes place in GDL and in the electrolyte. In anode and cathode
catalyst layers, Sφ depends upon the local rate
of reaction.
The kinetics driving force is the local
surface over-potential, denoted as ηan and ηcat
for the anode and cathode, respectively.
mem sol
an
(16)
oc mem sol
cat
(17)
The subscripts of sol and mem denote the solid and membrane electrolyte. The gain in electrical potential from the anode to the cathode can be obtained by subtracting the
open circuit voltage (φoc) calculated from the
operating temperature [32]:
) 298 ( 10 9 . 0 23 .
1 3
T
oc
(18)
2.2. Mass transfer
Diffusivity of species at varying operating temperature and pressure is given by [33,34]:
75 . 1 0 0 0 0 0 ) )( )( , ( T T P P P T D
Di i
(19)
The mechanism of diffusion in the porous environment of electrodes is different compared to gas channels because the average pore size was considerably smaller than the gas particle's mean free path. The diffusivities
are corrected using the Bruggemann
Iranian Journal of Chemical Engineering, Vol. 14, No. 2 (Spring 2017) 23 j i eff j i D
D, 1.5 , (20)
where ε is the value of porosity. The Maxwell-Stefan equation which describes
diffusion in multicomponent systems is
solved to determine parameters in the flow channels, GDLs and the porous electrode.
k j i i i j j j j j eff j i i i F n iM v P P x M M M M D u 1 , ( ( ) ( ) )) .( (21)where Di,jeff is the effective multicomponent
diffusivity of species i in j, u is flow velocity,
M and Mi/j are gas mixture and species i/j
molecular mass, x and ω show molar and mass fractions, νi and ni are stoichiometric
coefficient and the number of electrons transferred in half reaction and ρ is the gas mixture density described by:
RT p M x i i i
). ( (22)On the cathode side, two independent equations are solved for two species. The third species mass fraction is calculated upon using the mass balance equation provided as follows:
O H O N2 1 2 2
(23)
On the anode side, the hydrogen mass
fraction is obtained by solving the
aforementioned equation and the mass fraction of water is calculated using the mass balance equation:
2
2O 1 H
H
(24)
2.3. Momentum transfer
The well-known continuity and Navier-Stokes equations are employed to model the flow profile in the gas channels:
0 )
.(
u (25)
)] ) ( ( .[
. u PI u u T
u
(26)
where μ denotes dynamic viscosity of the mixture and is calculated as:
i i i x (27)Brinkman equation describes the
flow through a porous media. Parameters are modeled by this equation in the porous gas diffusion layers and electrodes:
)] ) ( )( ( .[ )
( u PI u u T
(28)
Here, κ is permeability which is an intrinsic property of porous media. The continuity equation for the porous media becomes:
0 )
.(
u (29)
2.4. Boundary conditions
The anode GDL boundaries facing the flow pattern ribs are set to zero electronic potential, and the corresponding boundaries at the cathode side are set to the cell operating potential. All other external boundaries are electrically isolating.
At the flow channel inlet boundaries, laminar inlet flow velocity profiles are specified and gas velocity is calculated based on the stoichiometric ratio, fuel cell active area, and the flow channel dimensions are given as follows:
channel channel O c cathode in n PA RT x F U 2 4 1 (30) channel channel H a anode in n PA RT x F U 2 2 1 (31)
where Uin-cathode and Uin-anode are the average
inlet velocity on the cathode and anode sides,
24 Iranian Journal of Chemical Engineering, Vol. 14, No. 2 (Spring 2017)
nchannel is the channel number.
Outlet flow pressure is considered to be atmospheric pressure. The flow is assumed to
be fully developed after a 10-3 meter entrance
length. In order to model a multiple parallel channel configuration, symmetric boundary conditions are applied along the long sides of the GDLs and the porous electrodes. No-slip
conditions are assumed in all other
boundaries.
Mass fractions at the channel inlets are calculated and outflow conditions are used at the convective flux as shown below:
0 )
.(Ci
n (32)
At the GDL-electrolyte interface, the
catalyst layer is assumed as an infinite thin layer, where the fluxes of each species are functions of the local current density described as follows:
2
2 2 H
a
H M
F i
N (33)
2 2
4 O
c
O M
F i
N (34)
O H c O
H M
F i N
2 2
4
(35)
where N is the inward mass flux, ia and ic
are local current densities at the anode side and cathode side. All other external boundaries are set to zero flux conditions. The base case parameters used in the model are listed in Table 1.
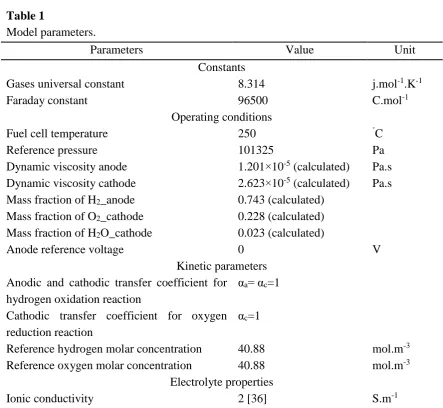
Table 1
Model parameters.
Parameters Value Unit
Constants
Gases universal constant 8.314 j.mol-1.K-1
Faraday constant 96500 C.mol-1
Operating conditions
Fuel cell temperature 250 ˚C
Reference pressure 101325 Pa
Dynamic viscosity anode 1.201×10⁻⁵ (calculated) Pa.s
Dynamic viscosity cathode 2.623×10⁻⁵ (calculated) Pa.s
Mass fraction of H2_anode 0.743 (calculated)
Mass fraction of O2_cathode 0.228 (calculated)
Mass fraction of H2O_cathode 0.023 (calculated)
Anode reference voltage 0 V
Kinetic parameters Anodic and cathodic transfer coefficient for
hydrogen oxidation reaction
αa= αc=1
Cathodic transfer coefficient for oxygen reduction reaction
αc=1
Reference hydrogen molar concentration 40.88 mol.m-3
Reference oxygen molar concentration 40.88 mol.m-3
Electrolyte properties
Iranian Journal of Chemical Engineering, Vol. 14, No. 2 (Spring 2017) 25
Electrolyte thickness 50 µm
Catalyst layer information
Catalyst layer thickness 25 µm
Anode exchange current density 105 [37] A.m-2
Cathode exchange current density 1 [37] A.m-2
GDL properties
GDL thickness 380 µm
Electrical conductivity 222 S.m-1
Porosity 0.4 [38]
Permeability 1.18×10⁻¹¹ [38] m2
Gas channel dimensions
Length 2 cm
Cross section 0.7874×1 mm2
Diffusion coefficient
H2-H2O 1.949×10⁻⁴ (calculated) m2.s-1
N2-H2O 5.452×10⁻⁵ (calculated) m2.s-1
O2-H2O 5.974×10⁻⁵ (calculated) m2.s-1
O2-N2 5.083×10⁻⁵ (calculated) m2.s-1
3. Results and discussion
In the current work we have investigated the performance of the solid acid fuel cell using the presented model of the electrochemical reaction and transport phenomena, which are fully coupled with the governing equations. The equations were solved using the
computational fluid dynamics (CFD)
software, a finite elements technique solver from 0.4-0.95 V of cell potential by 0.05 step size.
The polarization curve, an indicator of the priority of fuel cell was used to compare the cell performance with a conventional cell.
Simulation results were validated by
generating polarization curves and comparing them with those presented by Chisholm et al. [36]. Grid independence tests were conducted to ensure that the simulations results are independent of the mesh size. For the three different mesh sizes, the difference between polarization curves is less than 1.0 % which
ensures mesh size independence. In the first approach, complete mesh consists of 5772 domain elements, 3616 boundary elements, and 764 edge elements and 44552 degrees of freedom are considered. The second approach consists of 19708 domain elements, 7392 boundary elements, and 972 edge elements and 146045 degrees of freedom. Similarly, for the third approach, complete mesh consists of 42228 domain elements, 15528 boundary elements, and 1564 edge elements and 315746 degrees of freedom.
26 Iranian Journal of Chemical Engineering, Vol. 14, No. 2 (Spring 2017) Figure 5. Polarization curve.
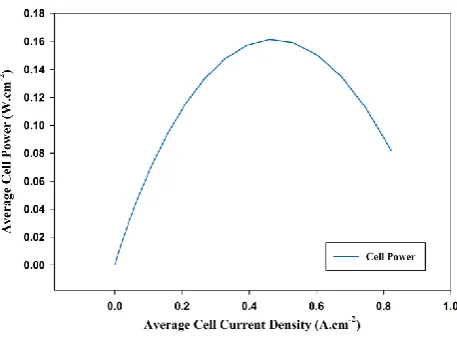
The power density curve generated by the simulation is shown in Fig. 6. The relation between voltage, current density and the power of the fuel cell is P =V.I. It is clear
that maximum cell power (1612.19 W.m-2)
was observed at medium current densities
(namely 0.46 A.cm-2) which suggests the
optimum range of fuel cell operation.
Figure 6. Power density curve.
Concentration of reactants is an important factor in the reaction rate and electric current.
The concentration gradient between
electrodes and the channels leads to diffusion of species into the porous electrodes. Figure 7 shows hydrogen mass fraction at the anode
side. The mass fraction of H2 decreases along
the flow direction. In the cross-sectional view,
the mass fraction of H2 is higher in the
channel and lower in the porous GDL, where
diffusion dominates the species mass
transport in the porous media.
Figure 7. Hydrogen mass fraction distribution in anode side.
Illustration of the oxygen concentration profile within the air channel and the cathode is given in Fig. 8. It demonstrates that by going along the channel, the amount of oxygen decreases due to consumption in reaction. Furthermore, in the cross-sectional view, the decrease in mass fraction of hydrogen in the anode side is less than oxygen in the cathode side due to the lower diffusivity coefficient of oxygen and water formation which blocks the porous area in the cathode side.
Iranian Journal of Chemical Engineering, Vol. 14, No. 2 (Spring 2017) 27 Figure 9 shows the ionic current in the cell
length direction at the center of the
electrolyte. Local current density decreases along the channels due to reduction of the reactants concentration. In the wide direction, the currents density is highest in the region close to the channel, where the reactant concentrations are higher.
Figure 9. Ionic current in the cell lengthdirection at the center of the electrolyte.
Water management plays an important role on performance of the cells. Variation in water causes dehydration or flooding which must be controlled during working of the fuel cell. Figure 10 shows the mass fraction of water on the anode side. On the anode side, because there is no osmotic drag effect on the
CsH2PO4 electrolyte, there is no water
transfer from the anode to the cathode as the proton moves that way. As a result, the anode water mass fraction increases slightly due to the consumption of hydrogen.
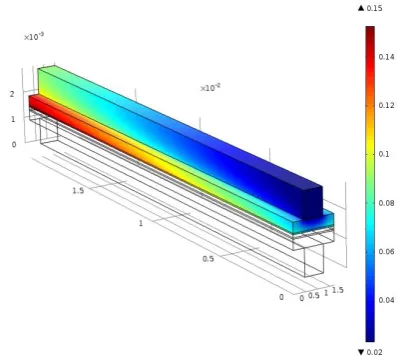
Figure 10. Water mass fraction distribution in anode side.
Due to high temperature inside the cell, water produced by reaction is in vapor phase. Figure 11 shows the water distribution in the cathode side. As shown, water mass fraction increases along the channel due to the water production by oxygen consumption at the catalyst layer. As water is produced on the cathode catalyst layer, it has a high molar fraction at the cathode GDL near the catalyst.
Figure 11. Water mass fraction distribution in cathode side.
28 Iranian Journal of Chemical Engineering, Vol. 14, No. 2 (Spring 2017) because at higher current densities, the rate of
reaction is faster as compared to transport of the reactants, and thus concentration losses in the polarization curve are dominant.
Figure 12. Current density curves for different voltages.
As it is shown in Fig. 13, the amount of hydrogen decreases, especially at lower voltage by moving along the channel. Strong reduction of hydrogen is sensed due to higher current density and consequently higher consumption of species. It must also be mentioned that at a high voltage, oxygen consumption is less than low voltage which is obvious in Fig. 14.
Figure 13. Hydrogen mass fraction curves for different voltages.
Figure 14. Oxygen mass fraction curves for different voltages.
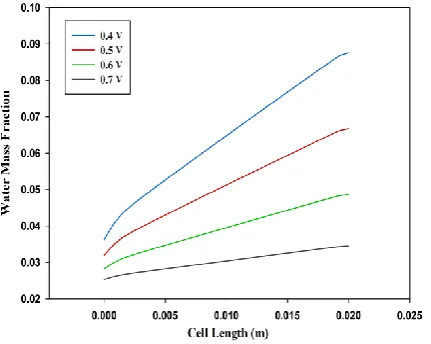
Figure 15 shows that higher consumption of hydrogen leads to an increase in water mass fraction in the anode side at lower voltages. Also, the mass fraction of water at the cathode side is shown in Fig. 16 which also shows higher production of water at lower voltage. This is because the rate of liquid water production is higher due to higher current density. As the current density further increases, electro osmotic drag also increases. However, large amounts of water are produced in the cell.
Cell Length (m)
0.000 0.005 0.010 0.015 0.020 0.025
W
a
te
r
M
a
s
s
F
r
a
ct
io
n
0.25 0.26 0.27 0.28 0.29 0.30 0.31
0.4 V 0.5 V 0.6 V 0.7 V
Iranian Journal of Chemical Engineering, Vol. 14, No. 2 (Spring 2017) 29 Figure 16. Water mass fraction curves for
different voltages in cathode side.
4. Conclusions
In this study, a three-dimensional
computational fluid dynamics model of solid acid fuel cell was developed to predict cell performance and investigate the effect of cell parameters. The simulated model was based on solving the equations for flow channel, GDLs, catalyst layers and electrolyte which is discretized on the base of the finite elements method. This study presents the following conclusions: The need to humidify is not required as proton conductivity in the solid
acids electrolyte such as CsH2PO4 depends on
conduction of protons through the solid
matrix. H2/O2 fuel cells were successfully run
with CsH2PO4 electrolyte. The successful use
of CsH2PO4 in fuel cell applications in this
study represents a confirmation of the
feasibility of CsH2PO4 as a proton conducting
electrolyte in real applications.
Nomenclature
C molar concentration [mol.m-3].
D mass diffusion coefficient [m2.s-1].
E cell potential [V].
F Faraday constant [coulomb/mol]. i local current density [A.m-2].
M molar mass [Kg.mol-1].
P pressure [Pa].
t thickness [m].
T temperature [K]. U velocity vector [m.s-1].
x mole fraction.
Greek symbols
ω mass fraction.
μ viscosity [Pa.s]. Φ potential [V].
ρ density of the mixture [Kg.m-3].
σ conductivity [S.m-1].
α transfer coefficient. η over-potential [V].
ε porosity.
κ permeability [m2].
Subscripts and superscripts a, an anode. act activation. c, cat cathode. conc concentration. eff effective. elec, e electronic.
max maximum.
mem membrane.
ohm ohmic.
ref reference condition.
sol solid.
References
[1] Dupuis, A. C., “Proton exchange
membranes for fuel cells operated at medium temperatures: Materials and
experimental techniques”, Prog. Mater.
Sci., 56 (3), 289 (2011).
[2] Demirbas, A., “Fuel cells as clean energy
converters”, Energy Sources, 29 (2), 185
(2007).
[3] McLellan, B., Costa, D., Dicks, A.,
Rudolph, V., Pagan, R., Sheng, C. and Wall, T., “Hydrogen economy options
for Australia”, Dev. Chem. Eng. Miner.
Process, 12 (5), 447 (2004).
[4] Uda, T., Boysen, D., Chisholm, C. and
Haile, S., “Alcohol fuel cells at optimal
30 Iranian Journal of Chemical Engineering, Vol. 14, No. 2 (Spring 2017) Lett., 9 (6), 261 (2006).
[5] Muis, Z., Hashim, H., Manan, Z. and
Douglas, P., “Effects of fossil fuel price
fluctuations on electricity planning
comprising renewable energy”,
Asia-Pac. J. Chem. Eng., 6 (3), 552 (2011).
[6] Uda, T. and Haile, S., “Thin-membrane
solid acid fuel cell”, Electrochem.
Solid-State Lett., 8 (5), 245 (2005).
[7] Ahn, Y., Mangani, I., Park, C. and Kim,
J., “Study on the morphology of
CsH2PO4 using the mixture of methanol
and polyols”, J. Power Sources, 163 (1),
107 (2006).
[8] Yoshimi, S., Matsui, T., Kikuchi, R. and
Eguchi, K., “Temperature and humidity dependence of the electrode polarization in intermediate-temperature fuel cells
employing CsH2PO4/SiP2O7-based
composite electrolytes”, J. Power
Sources, 179 (2), 497 (2008).
[9] Haile, S., Boysen, D., Chisholm, C. and
Merle, R., “Solid acids as fuel cell
electrolytes”, Nature, 410 (6831), 910
(2001).
[10] Yamane, Y., Yamada, K. and Inoue, K.,
“Superprotonic solid solutions between
CsHSO4 and CsH2PO4”, Solid State
Ionics, 179 (13), 483 (2008).
[11] Ponomareva, V., Kovalenko, K.,
Chupakhin, A., Shutova and E., Fedin,
V., “CsHSO4-Proton conduction in a
crystalline metal-organic
framework”, Solid State Ionics, 225, 420
(2012).
[12] Lavrova, G., Russkih, M., Ponomareva,
V. and Uvarov, N., “Intermediate-temperature fuel cell based on the proton
conducting composite membranes”, Solid
State Ionics, 177 (19), 2129 (2006).
[13] Ortiz, E., Vargas, R. and Mellander, B.,
“Phase behaviour of the solid proton
conductor CsHSO4”, J. Phys.: Condens.
Matter, 18 (42),9561 (2006).
[14] Merinov, B., “Proton transport
mechanism and pathways in the
superprotonic phase of CsHSO4 from
experiment and theory”, Solid State
Ionics, 213, 72 (2012).
[15] Chisholm, C. and Haile, S., “Entropy evaluation of the superprotonic phase of
CsHSO4: Pauling's ice rules adjusted for
systems containing disordered
hydrogen-bonded tetrahedral”, Chem. Mater., 19
(2), 270 (2007).
[16] Boysen, D., Haile, S., Liu, H. and Secco, R., “Conductivity of potassium and rubidium dihydrogen phosphates at high
temperature and pressure”, Chem.
Mater., 16 (4), 693 (2004).
[17] Otomo, J., Minagawa, N., Wen, C., Eguchi, K. and Takahashi, H., “Protonic
conduction of CsH2PO4 and its
composite with silica in dry and humid
atmospheres”, Solid State Ionics, 156 (3),
357 (2003).
[18] Taninouchi, Y., Uda, T. and Awakura,
Y., “Dehydration of CsH2PO4 at
temperatures higher than 260 °C and the
ionic conductivity of liquid
product”, Solid State Ionics, 178 (31),
1648 (2008).
[19] Boysen, D., Uda, T., Chisholm, C. and Haile, S., “High-performance solid acid
fuel cells through humidity
stabilization”, Science, 303 (5654), 68
(2004).
[20] Hayashi, S. and Mizuno, M., “Proton diffusion in the superprotonic phase of
CsHSO4 studied by 1H NMR
relaxation”, Solid State Ionics, 171 (3),
289 (2004).
Iranian Journal of Chemical Engineering, Vol. 14, No. 2 (Spring 2017) 31 temperature (˃140 ˚C) proton exchange
membrane fuel cells”, J. Power
Sources, 142 (1), 223 (2005).
[22] Compton, M., Maynes, K., Pavelites, J.
and Baker, D., “Proton NMR relaxation
study of the CsHSO4 solid acid
system”, Solid State Commun., 136 (3),
138 (2005).
[23] Yang, C., Costamagna, P., Srinivasan, S.,
Benziger, J. and Bocarsly, A.,
“Approaches and technical challenges to high temperature operation of proton
exchange membrane fuel cells”, J. Power
Sources, 103 (1), 1 (2001).
[24] Boysen, D., Uda, T., Chisholm, C.,
Haile, S., “High-performance solid acid
fuel cells through humidity
stabilization”, Science, 303 (5654), 68
(2004).
[25] Otomo, J., Tamaki, T., Nishida, S.,
Wang, S., Ogura, M., Kobayashi, T., Wen, C., Nagamoto, H. and Takahashi, H., “Effect of water vapor on proton
conduction of cesium dihydrogen
phosphate and application to
intermediate temperature fuel cells”, J.
Appl. Electrochem., 35 (9), 865 (2005).
[26] Haile, S., Chisholm, C., Sasaki, K.,
Boysen, D. and Uda, T., “Solid acid proton conductors: From laboratory
curiosities to fuel cell
electrolytes”, Faraday Discuss., 134, 17
(2007).
[27] Ponomareva, V. and Shutova, E.,
“High-temperature behavior of CsH2PO4 and
CsH2PO4–SiO2 composites”, Solid State
Ionics, 178 (7), 729 (2007).
[28] Xie, Q., Li, Y., Hu, J., Chen, X. and Li,
H., “A CsH2PO4-based composite
electrolyte membrane for intermediate
temperature fuel cells”, J. Membr. Sci.,
489, 98 (2015).
[29] Qing, G., Kikuchi, R., Takagaki, A.,
Sugawara, T. and Oyama, S.,
“CsH2PO4/Epoxy Composite Electrolytes
for intermediate temperature fuel cells”,
Electrochim. Acta, 169, 219 (2015).
[30] Bessette, N. and Wepfer, W.,
“Electrochemical and thermal simulation
of a solid oxide fuel cell”, Chem. Eng.
Commun., 147 (1), 1 (1996).
[31] Park, J. and Min, K., “Dynamic modeling of a high temperature proton exchange membrane fuel cell with a fuel
processor”, Int. J. Hydrogen Energy, 39
(20), 10683 (2014).
[32] Meng, H., “Numerical studies of liquid water behaviors in PEM fuel cell cathode considering transport across different
porous layers”, Int. J. Hydrogen
Energy, 35 (11), 5569 (2010).
[33] Guvelioglu, G. and Stenger, H.,
“Computational fluid dynamics modeling of polymer electrolyte membrane fuel
cells”, J. Power Sources, 147 (1), 95
(2005).
[34] Bird, R., Stewart, W. and Lightfoot, E.,
Transport phenomena,Wiley, New York,
(1960).
[35] Bear, J. and Buchlin, J., Modelling and applications of transport phenomena in
porous media, Kluwer Academic
Publishers, Dordrecht The Netherlands, (1991).
[36] Chisholm, C., Boysen, D., Papandrew, A., Zecevic, S., Cha, S., Sasaki, K., Varga, A., Giapis, K. and Haile, S., “From laboratory breakthrough to
technological realization: The
development path for solid acid fuel cells”, Interface, 18 (3), 53 (2009). [37] Cheddie, D. and Munroe, N., “Three
dimensional modeling of high
32 Iranian Journal of Chemical Engineering, Vol. 14, No. 2 (Spring 2017) Sources, 160 (1), 215 (2006).
[38] Broka, K., Characterization of the
![Fig. 1) [20-22].](https://thumb-us.123doks.com/thumbv2/123dok_us/8886784.1822948/2.595.315.535.182.316/fig.webp)