VOLUME 41, ARTICLE 6, PAGES 125
-
160
PUBLISHED 11 JULY 2019
http://www.demographic-research.org/Volumes/Vol41/6/ DOI: 10.4054/DemRes.2019.41.6
Research Article
How reducing differentials in education and
labor force participation could lessen workforce
decline in the EU-28
Guillaume Marois
Patrick Sabourin
Alain Bélanger
This publication is part of the Special Collection on “Drivers and the potential impact of future migration in the European Union,” organized by Guest Editors Alain Bélanger, Wolfgang Lutz, and Nicholas Gailey.
© 2019 Guillaume Marois, Patrick Sabourin & Alain Bélanger.
This open-access work is published under the terms of the Creative Commons Attribution 3.0 Germany (CC BY 3.0 DE), which permits use, reproduction, and distribution in any medium, provided the original author(s) and source are given credit.
1 Introduction 126
2 Methods: The CEPAM-Microsimulation model (CEPAM-Mic) 128
2.1 Base population 128
2.2 Fertility 129
2.3 Mortality 130
2.4 Religion and language 130
2.5 Migration 130
2.6 Education 131
2.7 Labor force participation 132
3 Inequality in labor force participation and education 134
4 Building alternative scenarios 139
5 Results for the European Union 141
6 Results for countries 144
7 Discussion and conclusion 147
How reducing differentials in education and labor force
participation could lessen workforce decline in the EU-28
Guillaume Marois1
Patrick Sabourin2
Alain Bélanger3
Abstract
BACKGROUND
Population ageing is unavoidable in Europe, but perhaps its impact on labor force is not. In the context of a new demographic regime of high immigration and low fertility, differentials in labor force participation and educational attainment can be more consequential for the labor force than either the number of immigrants or structure of the overall population.
OBJECTIVE
The objective of this paper is to investigate how improvements in both educational attainment (especially among children with a low educated mother or an immigration background) and labor force participation (especially of women and immigrants) could impact the future labor force in the European Union.
METHODS
We used a microsimulation model called CEPAM-Mic to project the labor force of EU28 countries. CEPAM-Mic incorporates heterogeneity among different groups and allows the development of alternative scenarios concerning educational attainment and labor force participation of disadvantaged groups.
RESULTS
Removing inequalities between subgroups in educational attainment and labor force participation drastically changes the prospective labor force size and labor force dependency ratio (LFDR) in the EU. Assuming perfect equality, the anticipated decline
1 Asian Demographic Research Institute, Shanghai University, Shanghai, China, and World Population
Program, International Institute for Applied Systems Analysis, Laxenburg, Austria. Email: [email protected].
2 Wittgenstein Centre for Demography and Global Human Capital (IIASA, VID/OeAW, WU), International
Institute for Applied systems Analysis, Laxenburg, Austria.
in the labor force size reduces by 54%, while the expected increase in the LFDR narrows by 70%.
CONCLUSION
Population aging is a destiny in large part driven by past demographic behaviors, but its anticipated consequences in terms of labor force size and labor force dependency ratio may be avoidable.
CONTRIBUTION
This paper features a policy-oriented use of microsimulation population projections. The alternative scenarios developed go beyond traditional demographic scenarios that can only set assumptions on fertility, mortality and migration.
1. Introduction
Following several decades of low fertility levels, in many European countries the working-age population (generally defined as those aged between 15 and 64) is or will soon be shrinking, while the elderly population expands. This process, which is part of the later stages of the demographic transition and is amplified by an expanding life expectancy, will increase the old-age dependency ratio. In other words, Europe will see unavoidable population aging.
Demographic projections of the expected ratio between the working-age population and the elderly are likely to be quite accurate in the medium-term, because immediate changes in fertility only have an effect once the new children reach working age, and because immigration, at plausible levels, only slightly affects the age structure of host societies (Bijak, Kupiszewska, and Kupiszewski 2008; Coleman 1992, 2008; Marois 2008). Indeed, population aging is more a matter of structure than absolute numbers. A higher proportion of elderly generally means more people in a situation of economic dependency and fewer people in the working-age group to support them, which raises policy concerns about the fiscal burden for future generations and the viability of previously constructed social programs.
longer. Consequently, the older workers of the future are more likely to be economically active than current older workers (Barakat and Durham 2014; Hasselhorn and Apt 2015; Loichinger 2015). Second, in many countries, labor force participation rates continue to increase among the population aged 55 and over (Loichinger 2015). Third, women are working more than ever. A big gender gap still exists in many European countries but is gradually narrowing, especially among the population with higher education (OECD 2016a). Thus, a decline of the working-age population does not necessarily translate into an equivalent decline in the labor force, highlighting the importance of including this dimension in population projections.
When taking into account these recent trends, the labor force projections of many nations show that they would not experience a decline in their labor force size over the next half century. The labor force dependency ratio4 (LFDR), by comparison, is expected to sharply increase everywhere (Loichinger and Marois 2018), because these favorable trends in increasing labor force participation are not yet sufficient to offset the effect of broad demographic trends in the age structure of the population. However, changes in labor force participation rates could drastically change the future outlook. For instance, Loichinger and Marois (2018) show that if the labor force participation rates by age, sex, and education were to reach the levels observed in Sweden (where the rates are the highest) in all European countries, the European Union would not only avoid a decline of its labor force size, but its LFDR would also remain quite stable.
In this paper we assess the impact of different policy-oriented scenarios on the future labor force of European Union Member States. Using a microsimulation projection model (CEPAM-Mic) that includes 12 socioeconomic dimensions – country of residence, age, sex, education, region of birth, duration of stay, age at immigration, education of the mother, religion, language – and their interaction, we measure how reducing inequality in labor force participation and education could impact the future economic structure of the population. As we already know that increasing labor force participation could help to manage the consequences of population aging, this paper focuses on scenarios concerning labor force participation and educational attainment of specific population subgroups that show lower education and labor market participation. More precisely, according to the capabilities of the projection models and available data, we build alternative scenarios concerning three important aspects of inequality in labor force participation and educational attainment, namely:
1. The gender gap in labor force participation
2. The lower labor force participation of international immigrants
3. The inequality in the educational attainment of children from low- and medium-educated mothers and children with an immigrant background.
The aim of this paper is not to present plausible projections of the future labor force (LF) with their high and low variants. The aim is rather to develop policy-oriented scenarios of future labor force participation and education to guide policymakers in their decisions. In short, our scenarios go beyond variations around a baseline scenario, the usual approach of statistical agencies with ‘high’ and ‘low’ assumptions of fertility, mortality migration, and labor force participation. In addition, the model used in this study includes many socioeconomic dimensions and their interactions. The constructed scenarios investigate how sociological dynamics among subpopulations could shape the future labor force of the European Union.
2. Methods: The CEPAM-Microsimulation model (CEPAM-Mic)
This research is part of the Centre of Expertise on Population and Migration (CEPAM), a joint research project of the International Institute for Applied Systems Analysis (IIASA) and the Joint Research Centre (JRC) of the European Commission. The microsimulation projection model used for this research, CEPAM-Mic, allows the study of alternative scenarios and their consequences for future population trends in the European Union. Microsimulation is a powerful tool that can replace traditional multistate projections when the number of dimensions is large (Van Imhoff and Post 1998) and complex statistical models are used to project life-course transitions and events. Such a microsimulation model is very flexible and is characterized by the stochastic simulation of individual life courses. Simultaneous simulation of individual life courses allows the model to dynamically update the risks of various events based on the values of an individual’s state, and also allows interactions between actors.
CEPAM-Mic can project the population for EU28 member countries in several socioeconomic and ethnocultural dimensions. It was developed in the Modgen Language, which is a microsimulation programming language developed by Statistics Canada, integrated into the Microsoft Visual Studio C++ environment. The model was built following the framework for microsimulation models developed by the Laboratoire de Simulation Démographique (LSD) of the National Institute of Scientific Research (Canada (Bélanger and Sabourin 2017; Bélanger et al., forthcoming; Bélanger et al. 2018)).
2.1 Base population
education, student status, education of the mother, religion, language, and labor force participation.
The main source for the base population of CEPAM-Mic is the pooled data of the 2014–2015 yearly public file of the European Labour Force Survey (LFS). Each record from these surveys is an individual (an actor) in the microsimulation model (n = 8,148,874). The LFS includes all projected variables except religion and language. Waves 1 to 7 of the European Social Survey were used to impute religion and language in the base population. Imputation was done using polytomous logistic regressions in the MICE package in R (van Buuren and Groothuis-Oudshoorn 2011). The resulting microdata set was then calibrated in three steps. In the first step the base population was reweighted to match the 2011 European census by country, age, sex, education, and place of birth (where available); in the second step the base population was reweighted to match the religion distribution by country and sex (Hackett et al. 2015); while the third and final step occurred during the projection where the population was calibrated on the 2015 Wittgenstein center’s estimates by age, sex, education, and country (WIC 2015). The method is exhaustively described in a technical report available online (Sabourin, Marois, and Bélanger 2017).
2.2 Fertility
2.3 Mortality
Mortality rates by age, sex, and educational attainment were taken from Lutz et al. (2018). Future trends for these rates were determined after consultation with a panel of experts (Caselli et al. 2014).
2.4 Religion and language
At birth, religious denomination and language spoken at home were taken directly from the mother, and were subsequently allowed to change during the life course. Transition rates for religious denomination were taken directly from the PEW projections on religion (Hackett et al. 2015). Life course transition rates for language spoken at home were based on model schedules (Sabourin and Bélanger 2015) calibrated using data from the ESS.
2.5 Migration
To get migration rates by sex and country of residence, the average number of out-migrants from 2013 to 2016 (Eurostat table: migr_emi2) was divided by the average population aged 20–34 during the same period. Age-specific out-migration rates were then derived within the microsimulation model as follows. First, the Eurostat derived out-migration rates were applied to the 20–34 population to get the expected number of out-migrants in a given year. The number of out-migrants was then distributed according to age using a Rogers–Castro schedule. Finally, age-specific out-migration rates were obtained by taking the ratio of out-migrants to the population, by age, sex, and country of residence.
Out-migration rates in the simulation were recalculated every five years. During the simulation, out-migrants could either move within the EU and were assigned a new country of residence, or they could leave the EU, in which case their simulation was terminated. The proportion of out-migrants leaving the EU was derived from Eurostat tables on emigration according to region of destination (Table: migr_emi3nxt). The origin-destination matrix for intra-European mobility was derived using an update for the period 2009–20165 of Raymer et al.’s (2013) Bayesian estimates of European migration. Country-specific calibration factors were then calculated from a preliminary simulation for the period 2013–2016 in order to get the same number of entrances by
5 The authors would like to acknowledge Erofili Grapsa for the update of Bayesian estimates of migration
country as estimated by Eurostat for the same period. These calibration factors were kept constant for the rest of the projection.
In all scenarios built in this paper, the number of international immigrants was assumed to remain constant with the average observed during the period 2013–2016. In order to correct the abnormally high immigration inflows resulting from the refugee crisis we excluded flows of 2015 for Austria and Germany and the flow of 2016 for Greece. The number of international immigrants settling in Europe in a 5-year period was thus assumed to be about 10M. The characteristics of future international immigrants were derived from information on recent immigrants in the base population, itself built, as described above, from the EU-LFS, the EU-ESS, and Eurostat census data.
2.6 Education
The education module of CEPAM-Mic is exhaustively described in other papers (Marois, Sabourin, and Bélanger 2017, 2019). CEPAM-Mic includes three levels of education:
(1) Low: lower secondary or less (ISCED 1 and 2); (2) Medium: upper secondary completed (ISCED 3); (3) High: postsecondary (ISCED 4+).
The highest level of education that an individual reaches during the life course is set probabilistically at birth (or at arrival for immigrants who arrived during childhood) with parameters estimated with an ordered logit regression. The models explicitly take into account the influence of personal characteristics and the education of the mother. Sex- and country-specific cohort parameters are also included and extrapolated to establish assumptions for future cohorts. The model equation is thus formulated as follows:
ln = + + + ( ∗ )+ + (1)
where
· is the probability that an individual reaches level of education , where equals high or medium education
· is a discrete variable for cohorts (1940–44 = 1; 1945–49 = 2, …, 1975–1979 = 8)
· is a set of sociocultural variables · is the education of the mother.
Sociocultural variables comprise language, religion, and place of birth. As such, the education module implements differentials in educational pathways for children with an immigrant background, as well as for different social classes as reflected by the education of the mother. In the reference scenario of this paper, parameters are kept constant throughout the projection.
2.7 Labor force participation
The labor force participation module is described in Marois, Sabourin, and Bélanger (2018). The module is applied to individuals aged between 15 and 74. When a change occurs to the characteristic of an individual (age, education, duration of stay, etc.), the module determines probabilistically whether or not he/she participates in the labor force. The labor force participation status is imputed through a Monte Carlo experiment in which a random number is compared to the probability of being active: a successful trial means that the simulated individual is active. Parameters are estimated from sex-and country-specific logit regressions on a binomial variable representing participation in the labor force, using pooled data from the 2010 to 2015 files of the annual EU Labor Force Survey. Equation 2 below describes the modeling of labor force participation (P):
logit( )= + + + + ( ∗ )+
( ∗ )+ ( ∗ )+ ( ∗ ∗
)+ + ( 15∗ ) (2)
where:
· β0 + β1+ β2+ β4 capture the joint effect of age and education on labor force participation rates.6 Education is divided into 3 categories:
(1) Low (L): lower secondary or less (ISCED 0, 1, and 2) (2) Medium (M): upper secondary completed (ISCED 3)
6 The LFS does not provide information on labor force participation rates in the United Kingdom for the age
(3) High (H): postsecondary (ISCED 97: 4, 5A, 5B and 6; ISCED 2011: 4, 5, 6, 7, 8)
· β3+ β5+ β6+ β7 capture the age- and education-specific trends in labor force participation
· β8 is a set of parameters for the immigration variable (IMMIG) combining place of birth,7 age at arrival, and duration of stay. The variable is divided into five categories:
(1) Born in EU28
(2) Born outside EU28, arrived before the age of 15
(3) Born outside EU28, arrived after the age of 15, duration of stay < 5
(4) Born outside EU28, arrived after the age of 15, 5 ≤ duration of stay < 10
(5) Born outside EU28, arrived after the age of 15, 10 ≤ duration of stay
· β9 is a set of parameters estimating the labor force returns on education for migrants born outside the European Union and who arrived at the age of 15 or above (IM15).
Using the cohort-development method, we used β0 to β7, we calculated entry and exit rates (net of the immigration variable), which are then used to build a labor force participation table for a synthetic cohort. The table was then used to derive net future participation rates, which showed a notable increase in the participation rates of the population aged 50 to 74, in particular for women.
In addition to the sex differential, regression models also account for another important source of inequality in regards to labor force participation, as they explicitly take into account differentials between EU28 natives and the foreign-born as well as the integration process through parameters for the duration of stay (β8). In addition, interaction parameters between the place of birth and education (β9) allow the model to account for the fact that the result for education differs for immigrants and natives. Taking these parameters into account allows the creation of assumptions on future participation rates with immigration differentials.
CEPAM-Mic thus has many advantages compared to traditional labor force projections, as it can incorporate heterogeneity between different groups while also
7 For Germany the question on the country of birth is not asked in the LFS. We use nationality as a proxy to
having a more complex modeling of education, which is a major determinant of labor force participation. This allows the model to capture inequality in labor force participation and education between many sociocultural groups. Consequently, by changing the parameters associated with these groups, the model is very flexible in the construction of alternative scenarios that may prove relevant and useful to European policymakers when analyzing future education levels and the labor force.
3. Inequality in labor force participation and education
Figure 1: Derived probability of being active8 for EU-born individuals with low
(L), medium (M), and High (H) education level, by age and sex, EU28 average, 2015
Source: Marois, Sabourin, and Bélanger (2018).
8 Converted from the average of country-specific parameters. 0%
10% 20% 30% 40% 50% 60% 70% 80% 90% 100%
15‒19 20‒24 25‒29 30‒34 35‒39 40‒44 45‒49 50‒54 55‒59 60‒64 65‒69 70‒74
Men
L M H
0% 10% 20% 30% 40% 50% 60% 70% 80% 90% 100%
15‒19 20‒24 25‒29 30‒34 35‒39 40‒44 45‒49 50‒54 55‒59 60‒64 65‒69 70‒74
Women
Another important inequality in labor force participation affects immigrants, who encounter several difficulties in their economic integration that reduce their potential to contribute to the economy (Bevelander 2005; Büchel and Frick 2005; Kahn 2004; Model and Lin 2002; OECD 2010). In general, the labor market participation of international immigrants at their arrival is much lower than natives with similar characteristics, but the rates tend to improve with increasing number of years in the host country (Alba and Nee 1997; Borjas 2008). Previous analysis has clearly shown these dynamics for labor force participation in the European Union (Marois, Sabourin, and Bélanger 2018). To illustrate this, in Table 1 we present the European averages for country-specific parameters for immigration variables as obtained from Equation 2. In general, at the time of their arrival, immigrants arriving after age 15 tend to have much lower participation rates than natives (the average parameter is –1.642 for female recent immigrants and –0.936 for male recent immigrants), but their situation improves with the passage of years. In many countries, after 10 years of stay the outcome for male immigrants is similar to that of natives (the average parameter reaches –0.223). However, in general, for female immigrants the gap has still not been eliminated after 10 years (–0.755).
Gender inequality in terms of labor force participation appears to be an issue that affects immigrants more than natives. In addition, the effect of education is less for immigrants (Table 2, see Marois, Sabourin, and Bélanger (2018) for detailed results). For women specifically, having a high education level is about 50% less efficient for female immigrants than it is for native females in terms of labor force participation.9 These observations are in accordance with other studies showing that in some immigrant communities, both gender and immigrant status and their interaction are correlated with lower participation, resulting in much wider gender differentials in workforce participation among immigrants than among natives. (Adsera and Chiswick 2007; Boyd 1984; Donato, Piya, and Jacobs 2014; Dustmann et al. 2003). Governments often see immigration as a tool to smooth the expected decline in labor force size (Termote 2011). However, lower participation rates among some groups of immigrants and differentials in educational attainment can limit its potential for contributing to the economy.
9 When averaged over all countries, the interaction parameter ( ) for low-educated female immigrants is
Table 1: Average value* of β8 (IMMIG, see equation 2), EU28, 2010–2015
Women Men
Born in EU28 Ref Ref
Born outside EU28, arrived before the age of 15 –0.220 –0.180
Born outside EU28, arrived after the age of 15, duration of stay <5 –1.642 –0.936
Born outside EU28, arrived after the age of 15, 5 ≤ duration of stay <10 –1.258 –0.520
Born outside EU28, arrived after the age of 15, 10 ≤ duration of stay –0.755 –0.223
Note: *Values represent the average of parameters for the 28 countries. The level of significance varies among them, though most
are highly significant (p<0.0001).
Source: Marois, Sabourin, and Bélanger (2018).
Table 2: Average value* of the parameters for education and its interaction with immigration, EU28, 2010–2015
Women Men
Level EDU (β2) EDU*IM15 (β9) EDU (β2) EDU*IM15 (β9)
Low –1.753 0.817 –2.005 0.590
Medium –0.753 0.467 –0.751 0.153
Note: *Values represent the average of parameters for the 28 countries. The level of significance varies among them, though most
are highly significant (p<0.0001).
Source: Marois, Sabourin, and Bélanger (2018).
This general pattern is not the same everywhere, however. In countries such as Germany, Belgium, and the Netherlands, a notable gap remains among immigrants established for a decade or more, even for males (see Marois, Sabourin, and Bélanger (2018) for detailed results). In Denmark the situation even appears to deteriorate with time. On the other hand, immigrants tend to have higher participation rates in southern European countries. In addition, in most countries, immigrants who arrived before 15 tend to have similar labor force participation as natives, for both males and females, showing evidence of integration. In some countries, however, immigrants who arrived before the age of 15 still encounter difficulties, such as in the Netherlands, the United Kingdom, and Belgium.
attainment. Shavit, Yaish, and Bar-haim (2007) explain this link by mechanisms related to economic and cultural resources, the influence of other family members, track placement, and incentives to make more ambitious educational decisions.
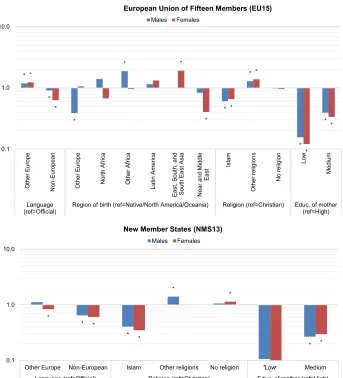
Figure 2: Odds of obtaining a high level of education to odds of obtaining a low or medium level of education (controlled for birth cohort)
Source: Marois, Sabourin, and Bélanger (2019). * * * * * * * * * * * * * * * * 0.1 1.0 10.0
Other Europe Non-European Other Europe North Africa Other Africa Latin America
East, South, and South East Asia Near and Middle
East Islam Other religions No religion Low Medium Language
(ref=Official) Region of birth (ref=Native/North America/Oceania) Religion (ref=Christian) Educ. of mother(ref=High)
European Union of Fifteen Members (EU15)
Males Females * * * * * * * * * * * 0.1 1.0 10.0
Other Europe Non-European Islam Other religions No religion Low Medium
Language (ref=Official) Religion (ref=Christian) Educ. of mother (ref=High)
New Member States (NMS13)
Second, many studies in Europe and the United States have found that foreign-born children and racial minorities have lesser educational outcomes (Heath and Brinbaum 2007; Hirschman 2001; Riphahn 2003). Odds by language and religion in Figure 2 illustrate that many groups with an immigrant background have a much lower likelihood of obtaining a post-secondary level than others. These groups include those speaking a non-European language at home and Muslims in both the old fifteen member states (EU15)10 and the new member states (NMS13),11 and females born in the Near and Middle East and males born in another European country in the EU15 only. Among contextual factors explaining these differences, in many cases children with an immigrant background have specific inequality issues relating to neighborhood and school conditions (Grönqvist 2006; Pong and Hao 2007), as well as unequal access to resources (Zhou 2009). Cultural differences may also influence educational pathways (Heath and Brinbaum 2007).
4. Building alternative scenarios
The analysis of CEPAM-Mic inputs shows three major inequalities in terms of labor force participation. The first is the difference for women in general compared to men, especially for low-educated women. The second is the discrepancy between immigrants and natives, especially for females and recent immigrants compared to natives. The third is differences in post-secondary education attainment for children with a low-educated mother or an immigrant background; both circumstances that reduce the propensity to participate in the labor force. All these inequalities are explicitly taken into account in the projection model using distinct parameters, and we can thus create ‘what-if’ scenarios by changing them.
A reference scenario was first built as a baseline. Using the most plausible assumptions of future trends, this scenario gives the expected composition and size of the projected labor force population if past trends continue and if observed inequalities remain. In other words, we used all the parameters described in the section above. In addition to this reference scenario, four ‘what if’ alternative scenarios were built to assess how reducing the previously mentioned inequalities could affect the future labor force. The first three alternative scenarios assess the effect of a change to each of the specific differentials mentioned above, while the last one combines all three scenarios.
10 Germany, Belgium, France, Italy, Luxembourg, Netherland, Denmark, Ireland, United Kingdom, Greece,
Spain, Portugal, Austria, Finland, Sweden.
11 Bulgaria, Croatia, Cyprus, Czech Republic, Estonia, Hungary, Latvia, Lithuania, Malta, Poland, Romania,
These five scenarios (reference + four alternatives) are listed below. All five scenarios share the same assumptions in regards to fertility rates, mortality rates, and migration.
(1) Reference. The modeling of educational attainment follows cohort trends and takes into account the fact that the odds of getting a post-secondary degree for children with low-educated mothers is much lower than for others. The labor force participation module explicitly takes into account sex, age, and education differentials by country, as well as the lower participation rates observed for immigrants and the increasing labor participation with duration of stay. In order to take into account the cohort effect, the entry and exit rate method is applied to obtain participation rates of the future elderly.
(2) Equality in education. This ‘what if’ scenario assigns the same chance of achieving a given educational level to all children regardless of their background. It does so by removing the negative effect of having a low- or medium-educated mother, and the negative effect of sociocultural variables on the likelihood of attaining post-secondary education. In other words, taking mother’s education as an example, it assumes that children born from a low-educated mother have an equal chance of getting a high education level as children born from a highly educated mother. This is achieved by setting the parameters to 0 for the variable ‘education of the mother’ and the sociocultural variables with negative parameters when assigning an education level to new births and future immigrants admitted during childhood. Since education is a major determinant of labor force participation, this scenario shows the highest possible effect of targeted investments in education aimed at eliminating barriers to educational attainment for the most vulnerable children.
(3) Equality in labor force participation for immigrants. This scenario assumes a convergence of labor force participation by 2050 between immigrants and natives with a similar age-sex-education profile. In other words, all parameters for immigration variables in terms of labor force participation as well as the parameters interacting with education gradually converge to 0. This scenario shows the possible impact of efficient policies focused on a better economic integration of immigrants.
(5) Super equality. This scenario combines assumptions on the reduction of inequalities hypothesized in the three previous scenarios. In other words, it assumes that women and immigrants have no labor force participation rates distinct from other groups, and that the achievement of post-secondary education is the same for everyone.
5. Results for the European Union
According to the reference scenario, the labor force size of the European Union is expected to decline by about 19 million by 2060, as shown in Figure 3, going from about 244.6 million workers in 2015 to 225.6 million in 2060. This reduction is the consequence of fertility having been below replacement level for many decades in most European countries, resulting in more workers retiring than young entering the labor market. The expected improvement in labor force participation for women and older workers, although mitigating this decline, is insufficient to prevent it altogether. As the size of the inactive population grows while boomers retire, the increase in the labor force dependency ratio (LFDR), the ratio of the inactive to active, will increase from about 1.08 in 2015 to 1.33 in 2060 (Figure 4). This projected population dynamic resulting from population aging is observed in most developed nations and is similar to other labor force projections (European Commission and Economic Policy Committee 2017; Loichinger 2015; Loichinger and Marois 2018).
the number of inactive people, and as a consequence improves policy-relevant indicators on the fiscal impact of population aging, such as the LFDR.
Figure 3: Projected labor force size of the European Union according to 5 scenarios, 2015–2060
Source: Authors’ calculations.
Figure 4: Projected labor force dependency ratio of the European Union according to 5 scenarios, 2015–2060
Source: Authors’ calculations. 210
215 220 225 230 235 240 245 250 255
Millions
Reference
Equality in education
Equality in LFP for immigrants
Equality in LFP for women
Super equality
1 1.05 1.1 1.15 1.2 1.25 1.3 1.35
Reference
Equality in education
Equality in LFP for immigrants
Equality in LFP for women
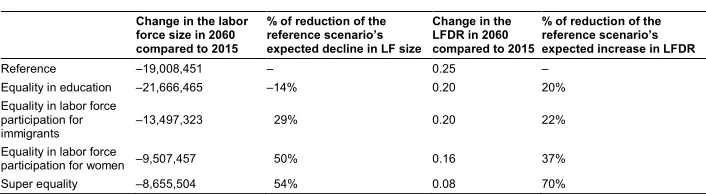
Table 3: Projection results
Change in the labor force size in 2060 compared to 2015
% of reduction of the reference scenario’s expected decline in LF size
Change in the LFDR in 2060 compared to 2015
% of reduction of the reference scenario’s expected increase in LFDR
Reference –19,008,451 – 0.25 –
Equality in education –21,666,465 –14% 0.20 20%
Equality in labor force participation for immigrants
–13,497,323 29% 0.20 22%
Equality in labor force
participation for women –9,507,457 50% 0.16 37%
Super equality –8,655,504 54% 0.08 70%
In terms of labor force size, the scenario that removes inequalities in labor force participation for immigrants yields a more significant impact than removing inequalities in education. Compared to the reference scenario, the expected decline in the labor force size by 2060 drops to about 231 million workers, a reduction of 29%. In addition to increasing the number of workers, inactive immigrants becoming active, as in this scenario, reduces the increase in the LFDR by 22%, to 1.27 in 2060 (vs. 1.33 for the reference scenario). Our low fertility and quite high immigration assumptions produce a strong estimated increase in the proportion of immigrants among the working-age population throughout the projection. Given these assumptions, the positive impact of this ‘perfect integration’ scenario, though small for the first years, becomes increasingly significant over time.
The gender equality scenario yields the more positive impact on both the labor force size and the labor force dependency ratio. If by 2050 the labor force participation rates of women gradually reach those of men, the expected decline in the labor force size will be reduced by about 50% compared to the reference scenario. The impact of this alternative scenario on the LFDR is also major, but an increase would still occur as a consequence of the sharp increase of the number of elderly. In 2060 the ratio would reach 1.24, meaning 37% of the expected increase in the reference scenario could be cancelled out by a strong increase in the labor force participation of females.
of the impact of population aging would thus be cancelled (compared to the reference scenario), in addition to preventing a significant decline in the labor force size.
6. Results for countries
Although all European countries now face population aging, their demographic dynamics differ widely. For instance, in 2016 fertility levels varied between 1.34 in Spain and 1.92 in France (Eurostat 2018a), and while net migration was strongly positive in Germany and the United Kingdom, other countries, especially in Eastern Europe, experienced net emigration (Eurostat 2018b). Moreover, significant differences between European countries in terms of the economic integration of immigrants, gender imbalance in labor force participation, and educational dynamics are also observed. This heterogeneity in demographic and social dynamics is explicitly taken into account in the assumptions of CEPAM-Mic. As a result, alternative scenarios generate different outcomes when looking at country-specific results.
First, in Figure 5 we present the expected labor force size by country in 2060 for the reference scenario (2015 = 1). In the reference scenario, while an overall decline is expected in the European Union, many countries would experience an increase. In Sweden and the United Kingdom, whose relatively high immigration and fertility levels stand out, the labor force size in 2060 would overtake the size in 2015 by more than 10%. At the opposite end of the spectrum, the decline of the labor force would be more drastic in most Eastern Europe countries, as well as in some Southern Europe nations with low fertility such as Portugal, Spain, and Greece, where the labor force size in 2060 would be less than 80% of its size in 2015.
LFDR of all European countries in 2015 but can expect to see this ratio moving toward the European average over time.
Figure 5: Projected labor force size in 2060 by country, reference scenario (2015 = 1)
Source: Authors’ calculations.
Figure 6: Projected labor force dependency ratio in 2015 and 2060 (reference scenario)
Source: Authors’ calculations.
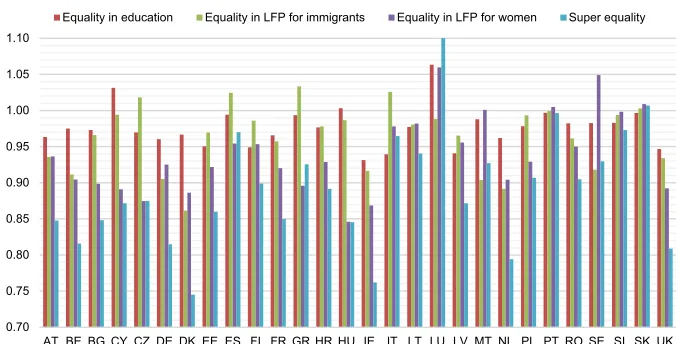
Alternative scenarios are shown to shape the future labor force, with country-specific outcomes varying according to sociodemographic dynamics. The equal education scenario yields a larger labor force size and lower labor force dependency
0 0.2 0.4 0.6 0.8 1 1.2 1.4 1.6 1.8 2
AT BE BG CY CZ DE DK EE ES FI FR GR HR HU IE IT LT LU LV MT NL PL PT RO SE SI SK UK
0 0.5 1 1.5 2 2.5
AT BE BG CY CZ DE DK EE ES FI FR GR HR HU IE IT LT LU LV MT NL PL PT RO SE SI SK UK
ratio in countries where the proportion of low-educated mothers is higher, such as Italy, Cyprus, and Luxemburg (Figure 7). Equalizing the labor force participation for immigrants manages to significantly improve both indicators in high immigration countries such as Germany, Sweden, and the Netherlands and in countries such as Denmark where the labor force integration of immigrants is deficient, while the same scenario produces little difference for countries with low immigration (Eastern European countries) or those where the labor force participation of immigrants is already high compared to natives (Southern European countries).
Figure 7: Projected labor force size of alternative scenarios in 2060 (Reference scenario = 1)
Source: Authors’ calculations.
In most countries, the scenario assuming gender equality in labor force participation by 2050 increases labor force size the most. The labor force size in this scenario is at least 5% larger than the reference scenario in many countries, namely Belgium, Bulgaria, Cyprus, the Czech Republic, Denmark, France, Greece, Hungary, Ireland, the Netherlands, and the United Kingdom. However, this scenario has no additional positive effect in countries where gender equality in labor force participation has already been reached among the younger cohorts, such as Sweden. Since the cohort trend assumes that these women will keep their stronger attachment to the labor market as they age, for Sweden this scenario yields similar labor participation rates for females compared to the reference scenario and the gender equality scenario. In fact, since young, educated women already have better participation rates than men in Sweden, a
0.90 0.95 1.00 1.05 1.10 1.15
AT BE BG CY CZ DE DK EE ES FI FR GR HR HU IE IT LT LU LV MT NL PL PT RO SE SI SK UK
slightly negative effect is even observed in the projections. Finally, the scenario of super equality manages to drastically change the future labor force of many countries in the European Union. In Denmark, France, Hungary, Sweden, and the United Kingdom the projected LFDR in 2060 for this scenario is below that observed in 2015, meaning that in these countries the removal of inequalities in education and labor force participation would more than offset the consequences of population aging. Overall – for 18 out of 28 countries – the expected increase in the LFDR between 2015 and 2060 would be reduced by more than 50%.
Figure 8: Projected LFDR of alternative scenarios in 2060 (Reference scenario = 1)
Source: Authors’ calculations.
7. Discussion and conclusion
Population aging is largely driven by past demographic behaviors and increased life expectancy. It is occurring in many societies around the world as part of the later stages of the demographic transition, but the anticipated consequences in terms of labor force size and labor force dependency ratio may be avoidable. Although demographic variables, as major drivers of individual economic activity, lead to an increase in the share of the elderly, other factors push in the opposite direction, such as an improvement of educational attainment across cohorts, increasing participation rates of older workers, and higher participation of women. In addition, many inequalities
0.70 0.75 0.80 0.85 0.90 0.95 1.00 1.05 1.10
AT BE BG CY CZ DE DK EE ES FI FR GR HR HU IE IT LT LU LV MT NL PL PT RO SE SI SK UK
remain in labor force participation and access to education, as many groups are under-represented among workers. In this paper we used five ‘what-if’ scenarios to show that eliminating these inequalities is likely to have a significant impact on the consequences of population aging. When the three types of inequality analyzed in this paper are eliminated the expected decline in the labor force size is reduced by 54% and the expected increase in the labor force dependency ratio is narrowed by 70%. Such a scenario would radically change the fiscal consequences of population aging.
Of the major inequalities, making gender disparity disappear would have a significant effect on the workforce in most countries. Our scenario in which female participation rates reach those of men by 2050 would allow many countries to avoid a declining workforce and would greatly reduce projected increases in the labor force dependency ratio. Gender parity in labor force participation is not unrealistic. Indeed, parity has already been reached among young cohorts in countries such as Sweden. Research shows that institutional factors and policy instruments such as childcare subsidies, parental leave, and tax incentives for sharing market work between spouses are likely to have a positive impact on female participation (Cipollone, Patacchini, and Vallanti 2014; Esping-Andersen 2009; Jaumotte 2003). In keeping with our projections, public policies facilitating the labor force participation of women could thus be a major tool for dealing with the consequences of population aging.
In most countries, reducing inequality in education, though improving the LFDR in the medium-run, plays a more limited role in future labor force size, because people with high education tend to have less children (Becker and Lewis 1973; Bongaarts 2001; Kohler, Billari, and Ortega 2006). While some empirical studies find a positive relationship between education and desired fertility (Heiland, Prskawetz, and Sanderson 2005, 2008), other socioeconomic and contextual factors can explain the situation, such as fertility postponement due to spending longer in the education system, educated women having higher lifetime celibacy, more career opportunities leading to additional postponement of childbearing, opportunity costs increasing with higher income, and different expectations of the cost of children (Bongaarts 2002; Kohler, Billari, and Ortega 2006; Morgan and Rackin 2010). Regarding this mismatch, a more positive impact on the future labor force would result from policies to improve gender equality in households and work-family balance so that educated women could have their desired number of children (McDonald 2000; Oppenheimer 1994).
and Fullin 2011). On the other hand, some studies have found that a generous welfare state and strong labor market regulations are likely to decrease participation rates of low-skilled immigrants (such as in Denmark), probably because their incentive to work is reduced, while immigrants and natives yield similar outcomes in terms of labor force participation and employment in more liberal countries such as the United States (Blume et al. 2007; Hansen and Lofstrom 2003; OECD 2016b). However, considerable differences remain when looking at poverty rates and earnings. In other words, though labor force participation rate and employment are obviously important facets of the economic integration of immigrants, public policies attempting to address economic integration should also consider indicators related to earnings. In any case, as our scenario of equality for immigrants in labor force participation leads to a significant positive impact on both the labor force size and the LFDR, our results suggest that any immigration policy should put a strong emphasis on economic integration in order to maximize the contribution of immigration to the fiscal balance.
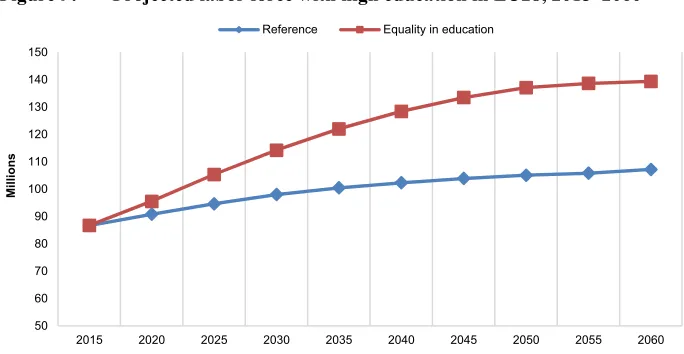
Concerning the scenario of equality in education, other economic indicators also need to be considered for a broad evaluation of its economic consequences. Indeed, some argue that the fiscal impact of a decline in the labor force size could be cancelled out by an increase in overall productivity (Börsch-Supan 2003; Lee and Mason 2010; Ludwig, Schelkle, and Vogel 2012). Because education is highly correlated with productivity, the scenario of equality in education, although having little impact on the labor force size, could nevertheless greatly improve the general economic situation of the EU. In Figure 9 we showed the projected number of workers with a high level of education in this scenario, compared to the reference scenario. The equality in education scenario yields a sharp increase of 61% in the number of high-educated workers, compared to only 24% in the reference scenario, thus significantly changing the educational profile of the future labor force. Consequently, although not dramatically changing the size of the labor force, this scenario could improve the economic outcome of workers, which may be a good asset in counterbalancing the economic effect of population aging. The impact of a more educated population on the dependency ratio could be investigated more accurately in further studies by using a productivity-weighted dependency ratio such as the one used in Striessnig and Lutz (2014).
public spending on social policies seeking to reduce inequality should be seen as a long-term investment rather than an expense.
Figure 9: Projected labor force with high education in EU28, 2015–2060
Source: Authors’ calculations.
Although population aging is a demographic certainty, its broad consequences, including increasing the labor force dependency ratio, are not set in stone. This paper showed a policy-oriented use of microsimulation population projections. The model used, CEPAM-Mic, allows for the simultaneous projection of several socioeconomic and ethno-cultural dimensions and their interaction. Nowadays, many inequalities between sub-populations remain when looking at labor force participation, especially for women, immigrants, those with low-educated mothers, and those with an immigrant background. The alternative scenarios developed for this paper went beyond traditional demographic scenarios using variants of assumptions on fertility, mortality, and migration. The five ‘what-if’ scenarios presented in this paper have the same demographic assumptions, but different assumptions regarding labor force participation and educational attainment for the sub-groups mentioned above. We show that reducing inequality in labor force participation and education could lessen the decline of the labor force size and significantly narrow the increase in the labor force dependency ratio, which are driven by unavoidable population aging.
This paper points to some of the subgroups with comparatively lower labor force participation and educational outcomes, and shows how increasing their standing would impact the future labor force of the European Union, but it does not investigate how to reach these objectives. Thus, we argue in favor of further studies to investigate the
50 60 70 80 90 100 110 120 130 140 150
2015 2020 2025 2030 2035 2040 2045 2050 2055 2060
Millions
References
Adsera, A. and Chiswick, B.R. (2007). Are there gender and country of origin differences in immigrant labor market outcomes across European destinations?
Journal of Population Economics 20: 495–526. doi:10.1007/s00148-006-0082-y.
Alba, R. and Nee, V. (1997). Rethinking assimilation theory for a new era of immigration.The International Migration Review 31(4): 826–874.doi:10.2307/ 2547416.
Altonji, J.G. and Blank, R.M. (1999). Chapter 48: Race and gender in the labor market.
Handbook of Labor Economics 3: 3143–3259. doi:10.1016/S1573-4463(99) 30039-0.
Barakat, B.F. and Durham, R.E. (2014). Future education trends. In: Lutz, W., Butz, W.P., and KC, S. (eds.).World population and human capital in the 21st century.
Oxford: Oxford University Press: 397–433.
Becker, G.D. and Lewis, H.G. (1973). On the interaction between the quantity and quality of children. The Journal of Political Economy 81(2): 279–288. doi:10.1086/260166.
Bélanger, A. and Sabourin, P. (2017).Microsimulation and population dynamics: An introduction to Modgen 12. Cham: Springer.doi:10.1007/978-3-319-44663-9. Bélanger, A., Sabourin, P., Marois, G., Vézina, S., and Van Hook, J. (forthcoming). A
framework for the prospective analysis of ethno-cultural super-diversity.
Demographic Research.
Bélanger, A., Sabourin, P., Vézina, S., Marois, G., D’Ovidio, K., Pelletier, D., and Lafontaine, O. (2018). The Canadian microsimulation model (LSD-C): Content, modules, and some preliminary results. Montréal: Institut national de la recherche scientifique (Working paper 2018-01). http://espace.inrs.ca/6830/1/ NoteRechercheINRS-UCS_2018-01.pdf.
Bevelander, P. (2005). The employment status of immigrant women: The case of Sweden. International Migration Review 39(1): 173–202. doi:10.1111/j.1747-7379.2005.tb00259.x.
Blume, K., Gustafsson, B., Pedersen, P.J., and Verner, M. (2007). At the lower end of the table: Determinants of poverty among immigrants to Denmark and Sweden.
Journal of Ethnic and Migration Studies 33(3): 373–396. doi:10.1080/13691 830701234517.
Bongaarts, J. (2001). Fertility and reproductive preferences in post-transitional societies.Population and Development Review 27(Supplement: Global Fertility Transition): 260–281.
Bongaarts, J. (2002). The end of the fertility transition in the developed world.
Population and Development Review 28(3): 419–443.doi:10.1111/j.1728-4457. 2002.00419.x.
Borjas, G.J. (2008). Issues in the economics of immigration. Chicago: University of Chicago Press.
Börsch-Supan, A. (2003). Labor market effects of population aging.Labour 17(S1): 5– 44.doi:10.1111/1467-9914.17.specialissue.2.
Boyd, M. (1984). At a disadvantage: The occupational attainments of foreign born women in Canada. The International Migration Review 18(4): 1091–1119. doi:10.1177/019791838401800410.
Büchel, F. and Frick, J.R. (2005). Immigrants’ economic performance across Europe: Does immigration policy matter?Population Research and Policy Review 24(2): 175–212.doi:10.1007/s11113-004-1370-4.
Caselli, G., Drefahl, S., Wegner-Siegmundt, C., and Luy, M. (2014). Future mortality in low mortality countries. In: Lutz, W., Butz, W.P., and KC, S. (eds.). World population and human capital in the 21st century. Oxford: Oxford University
Press: 226–272.
Cipollone, A., Patacchini, E., and Vallanti, G. (2014). Female labour market participation in Europe: Novel evidence on trends and shaping factors. IZA Journal of European Labor Studies 3(18): 1–40.doi:10.1186/2193-9012-3-18. Coleman, D.A. (1992). Does Europe need immigrants? Population and work force
projections. International Migration Review 26(2): 413–461. doi:10.2307/25 47066.
Coleman, D.A. (2008). The demographic effects of international migration in Europe.
Donato, K.M., Piya, B., and Jacobs, A. (2014). The double disadvantage reconsidered: Gender, immigration, marital status, and global labor force participation in the 21st century. International Migration Review 48(S1): 335–376. doi:10.1111/ imre.12142.
Dustmann, C., Fabbri, F., Preston, I., and Wadsworth, J. (2003). Labour market performance of immigrants in the UK labour market. London: Home Office (Home Office Online Report 05/03). http://citeseerx.ist.psu.edu/viewdoc/ download?doi=10.1.1.484.5062&rep=rep1&type=pdf.
Esping-Andersen, G. (2009). The incomplete revolution: Adapting welfare states to women’s new roles. Cambridge: Polity Press.
European Commission and Economic Policy Committee (2017). The 2018 Ageing Report: Underlying assumptions and projection methodologies. Brussels: European Commission (Institutional Paper 065). https://ec.europa.eu/info/sites/ info/files/economy-finance/ip065_en.pdf.
Eurostat (2018a). Fertility indicators [dataset]. Luxembourg: Eurostat.https://ec.europa. eu/eurostat/en/web/products-datasets/-/DEMO_FIND.
Eurostat (2018b). Population change: Demographic balance and crude rates at national level [electronic resource]. Luxembourg: Eurostat. http://appsso.eurostat.ec. europa.eu/nui/show.do?dataset=demo_gind.
Fullin, G. and Reyneri, E. (2010). Low unemployment and bad jobs for new immigrants in Italy. International Migration 49(1): 118–147. doi:10.1111/j.1468-2435. 2009.00594.x.
Grönqvist, H. (2006). Ethnic enclaves and the attainments of immigrant children.
European Sociological Review 22(4): 369–382.doi:10.1093/esr/jcl002.
Hackett, C., Connor, P., Stonawski, M., and Skirbekk, V. (2015). The future of world religions: Population growth projections, 2010–2050: Why Muslims are rising fastest and the unaffiliated are shrinking as a share of the world’s population. Washington, D.C.: Pew Research Center. https://assets.pewresearch.org/wp-content/uploads/sites/11/2015/03/PF_15.04.02_ProjectionsFullReport.pdf. Hansen, J. and Lofstrom, M. (2003). Immigrant assimilation and welfare participation:
Hasselhorn, H.M. and Apt, W. (2015). Understanding employment participation of older workers: Creating a knowledge base for future labour market challenges. Berlin: Federal Ministry of Labour and Social Affairs. https://ec.europa.eu/ eip/ageing/library/understanding-employment-participation-older-workers-creating-knowledge-base-future-labour_en.
Heath, A. and Brinbaum, Y. (2007). Guest editorial: Explaining ethnic inequalities in educational attainment. Ethnicities 7(3): 291–304. doi:10.1177/14687968070 80230.
Heiland, F., Prskawetz, A., and Sanderson, W.C. (2005). Do the more-educated prefer smaller families? Vienna: Vienna Institute of Demography (Working paper 03/2005).https://www.econstor.eu/bitstream/10419/97003/1/511745508.pdf. Heiland, F., Prskawetz, A., and Sanderson, W.C. (2008). Are individuals’ desired
family sizes stable? Evidence from West German panel data.European Journal of Population 24: 129–156.doi:10.1007/s10680-008-9162-x.
Hirschman, C. (2001). The educational enrollment of immigrant youth: A test of the segmented-assimilation hypothesis. Demography 38(3): 317–336.doi:10.1353/ dem.2001.0028.
Jaumotte, F. (2003). Female labour force participation: Past trends and main determinants in OECD countries. Paris: OECD (Working paper 376). doi:10.2139/ssrn.2344556.
Kahn, L.M. (2004). Immigration, skills and the labor market: International evidence.
Journal of Population Economics 17(3): 501–534. doi:10.1007/s00148-003-0151-4.
Karamessini, M. and Rubery, J. (2014).Women and austerity: The economic crisis and the future for gender equality. Abingdon: Routledge.
Kohler, H.-P., Billari, F.C., and Ortega, J.A. (2006). Low fertility in Europe: Causes, implications and policy options. In: Harris, F.R. (ed.).The baby bust: Who will do the work? Who will pay the taxes? Lanham: Rowman and Littlefield: 48–109. Lee, R. and Mason, A. (2010). Some macroeconomic aspects of global population
aging.Demography 47(S1): 151–172.doi:10.1353/dem.2010.0002.
Loichinger, E. and Marois, G. (2018). Education-specific labour force projections for EU-28 countries. In: Lutz, W., Goujon, A., KC, S., Stonawski, M., and Stilianakis, N. (eds.). Demographic and human capital scenarios for the 21st century: 2018 assessment for 201 countries. Luxembourg: European Commission: 43–52.
Ludwig, A., Schelkle, T., and Vogel, E. (2012). Demographic change, human capital and welfare. Review of Economic Dynamics 15(1): 94–107. doi:10.1016/ j.red.2011.07.001.
Lutz, W., Goujon, A.V., KC, S., Stonawski, M., and Stilianakis, N. (2018). Demographic and human capital scenarios for the 21st century: 2018 assessment for 201 countries. Luxembourg: European Commission.doi:10.2760/41776. Marois, G. (2008). La ‘migration de remplacement’: Un exercice méthodologique en
rapport aux enjeux démographiques du Québec. Cahiers québécois de démographie 37(2): 237–261.doi:10.7202/038132ar.
Marois, G., Sabourin, P., and Bélanger, A. (2017). A microsimulation approach for modelling the future human capital of EU28 member countries. Vienna: International Institute for Applied Systems Analysis (Working paper WP-17-017).http://pure.iiasa.ac.at/id/eprint/14789/1/WP-17-017.pdf.
Marois, G., Sabourin, P., and Bélanger, A. (2018). Implementing dynamics of immigration integration in labor force participation projection in EU28. Vienna: International Institute for Applied Systems Analysis (Working paper WP-18-004).http://pure.iiasa.ac.at/id/eprint/15387/1/WP-18-004.pdf.
Marois, G., Sabourin, P., and Bélanger, A. (2019). Forecasting human capital of EU member countries accounting for sociocultural determinants. Journal of Demographic Economics85(3).
McDonald, P. (2000). Gender equity in theories of fertility transition. Population and Development Review 26(3): 427–439.doi:10.1111/j.1728-4457.2000.00427.x. McHugh, M. and Challinor, A.E. (2011). Improving immigrants’ employment
prospects through work-focused language instruction. Washington, D.C.: Migration Policy Institute.
Morgan, S.P. and Rackin, H. (2010). The correspondence between fertility intentions and behavior in the United States. Population and Development Review 36(1): 91–118.doi:10.1111/j.1728-4457.2010.00319.x.
OECD (2010). Migration and employment. In: OECD factbook 2010: Economic, environmental and social statistics. Paris: OECD. doi:10.1787/factbook-2010-7-en.
OECD (2016a). OECD employment outlook 2016. Paris: OECD. doi:10.1787/ empl_outlook-2016-en.
OECD (2016b). OECD factbook 2015–2016. Paris: OECD. doi:10.1787/factbook-2015-en.
Oppenheimer, V.K. (1994). Women’s rising employment and the future of the family in industrial societies.Population and Development Review 20(2): 293–342. Pong, S.-l. and Hao, L. (2007). Neighborhood and school factors in the school
performance of immigrants’ children. International Migration Review 41(1): 206–241.doi:10.1111/j.1747-7379.2007.00062.x.
Potančoková, M. and Marois, G. (2018).Projecting future births in EU28 with fertility differentials reflecting women’s educational and migrant characteristics. Paper presented at the Wittgenstein Centre Conference 2018, 3rd Human Fertility Database Symposium, Vienna, Austria, December 5–7, 2018.
Raymer, J., Wiśniowski, A., Forster, J.J., Smith, P.W.F., and Bijak, J. (2013). Integrated modeling of European migration.Journal of the American Statistical Association 108(503): 801–819.doi:10.1080/01621459.2013.789435.
Reyneri, E. and Fullin, G. (2011). Labour market penalties of new immigrants in new and old receiving West European countries.International Migration 49(1): 31– 57.doi:10.1111/j.1468-2435.2009.00593.x.
Riphahn, R.T. (2003). Cohort effects in the educational attainment of second generation immigrants in Germany: An analysis of census data. Journal of Population Economics 16(4): 711–737.doi:10.1007/s00148-003-0146-1.
Sabourin, P. and Bélanger, A. (2015). The dynamics of language shift in Canada.
Population 70(4): 727–757.doi:10.3917/popu.1504.0771.
Shavit, Y., Yaish, M., and Bar-haim, E. (2007). The persistence of persistent inequality. In: Scherer, S., Pollak, R., Otte, G., and Gangl, M. (eds.). From origin to destination: Trends and mechanisms in social stratification research. Chicago: University of Chicago Press: 42–51.
Striessnig, E. and Lutz, W. (2014). How does education change the relationship between fertility and age-dependency under environmental constraints? A long-term simulation exercise.Demographic Research 30(16): 465–492.doi:10.4054/ DemRes.2014.30.16.
Termote, M. (2011). The efficiency of immigration and integration policies.Population Review 50(2): 90–108.doi:10.1353/prv.2011.0016.
van Buuren, S. and Groothuis-Oudshoorn, K. (2011). mice: Multivariate imputation by chained equations in R. Journal of Statistical Software 45(3). doi:10.18637/ jss.v045.i03.
Van Imhoff, E. and Post, W. (1998). Microsimulation methods for population projection.Population 10(1): 97–138.
Wittgenstein Centre (WIC) (2015). Wittgenstein Centre data explorer: Version 1.2 [electronic resource]. Vienna: Wittgenstein Centre. http://dataexplorer. wittgensteincentre.org/wcde-v2/ (retrieved March 18, 2015).