Copyright © 2018-2019, User Experience Professionals Association and the authors. Permission to make digital or hard copies of all or part of this work for personal or classroom use is granted without fee provided that copies are not made or distributed for profit or commercial advantage and that copies bear this notice and the full citation on the first page. To copy otherwise, or republish, to post on servers or to redistribute to lists, requires prior specific permission and/or a fee. URL: http://www.upassoc.org.
Construct of Usability an
Exaggeration?
James R. (Jim) Lewis Senior HF Engineer IBM Corp.
7329 Serrano Terrace Delray Beach, FL 33446
Mark Twain was undecided whether to be more amused or annoyed when a Journal representative informed him today of the report in New York that he was dying in poverty in London... The great humorist, while not perhaps very robust, is in the best of health. He said:
“I can understand perfectly how the report of my illness got about, I have even heard on good authority that I was dead. James Ross Clemens, a cousin of mine, was seriously ill two or three weeks ago in London, but is well now. The report of my illness grew out of his illness.
The report of my death was an exaggeration.”
New York Journal, 6/2/1897
The Usability Construct: A Dead End?
In 2018, Noam Tractinsky published a provocative paper entitled, “The usability construct: A dead end?” He argued the following:
• Usability is an umbrella concept.
• There is a mismatch between the construct of usability and its empirical measurements.
• Scientific progress requires unbundling the usability construct and replacing it with well-defined
constructs.
Journal of Usability Studies Vol. 14, Issue 1, November 2018 Central to the argument against a scientifically useful construct of usability is the distinction between formative and reflective modeling. In formative modeling, multidimensional constructs are formed from potentially independent elements. A reflective construct is composed of elements strongly expected to correlate, that is, to reflect an underlying unidimensional construct.
Are the Dimensions of Classical Usability Correlated or Independent?
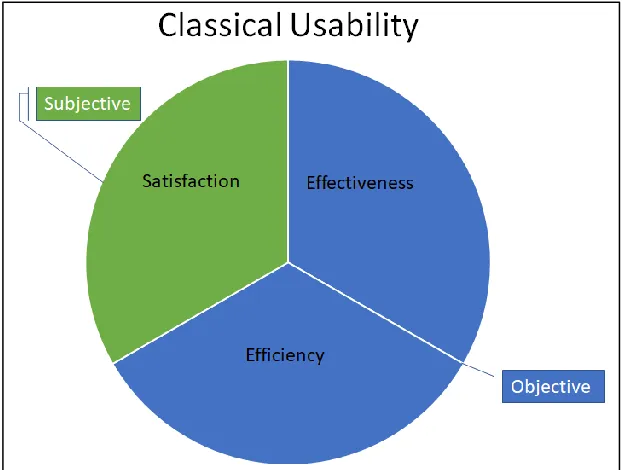
The classical conception of usability, as standardized in ISO 9241 (ISO, 1998), is that of a construct with three dimensions: effectiveness, efficiency, and satisfaction (see Figure 1). Effectiveness and efficiency are objective dimensions, typically measured with successful task completion rates (effectiveness) and task completion times (efficiency). Satisfaction is a subjective dimension, typically measured with a standardized measure of perceived usability such as the Single Ease Question (SEQ) at the task level and the System Usability Scale (SUS) at the level of a completed usability test session (Sauro & Lewis, 2016).Figure 1. The classical conception of usability.
It is common to hear anecdotes about observed discrepancies between performance (objective usability) and attitude (perceived usability), typically about participants who did not do well objectively but still provided positive ratings of perceived usability. A problem with relying on these types of anecdotes is that they are subject to the availability heuristic (M. Lewis, 2017), in which memories of unusual events are easier to retrieve than common events, leading people to believe that the unusual events are more common than they are in reality. Tractinsky (2018) provided a comprehensive review of the literature on the magnitudes of correlation between objective and subjective measures of usability. Two important explorations of this relationship were published by Hornbæk and Law (2007) and Sauro and Lewis (2009).
Journal of Usability Studies Vol. 14, Issue 1, November 2018 surveying a broad range of HCI studies but Sauro and Lewis focusing on a set of 90 unpublished industrial usability studies.
From the full set of 90 unpublished industrial usability studies, Sauro and Lewis (2009) found 325 cases (from 13 studies) in which measures were provided for task completions, task times, error counts, and perceived usability at the task and test levels. The correlations among these metrics were highly significant (p < 0.0001) and in the expected directions. Furthermore, unrotated loadings for the first component of a principal components analysis (PCA) were high, ranging from absolute values of 0.63 to 0.82, a finding consistent with the hypothesis of an underlying construct of usability.
The mathematical mechanics of PCA maximize the assignment of variance to the first unrotated component, leading to some controversy regarding its interpretability. Despite this, some psychometricians do hold that this first unrotated principal component is interpretable “as a general index of a construct represented by shared variance among related variables. For example, if one had administered five tests of specific cognitive abilities, the first unrotated principal component … could be viewed as a measure of general ability" (Leong & Austin, 2005, p. 251). This is not evidence for a latent factor structure with only one dimension, rather, it is evidence for an overall usability construct that might or might not have an additional latent factor structure.
To explore the possibility of additional structure in these data, Sauro and Lewis (2009) conducted a common factor analysis on the 325 cases. A parallel analysis (Coovert & McNelis, 1988) indicated a two-factor solution accounting for about 63% of the total variance. The varimax-rotated loadings for the two-factor solution showed objective measures loading strongly on the first factor and subjective measures loading strongly on the second. The results of these analyses were consistent with an underlying construct of usability containing two key dimensions—one objective and one subjective. Not only did the prototypical metrics of usability correlate significantly with one another, the pattern of their correlations was also consistent with an easily interpreted factor structure that was, in turn, consistent with the concept of usability documented in ISO 9241.
What about Subjective (Perceived) Usability?
Consistent with his criticism of the construct of overall usability (objective and subjective), Tractinsky (2018) argued that unless measures of subjective or perceived usability are unidimensional, then they too are flawed, or at least, of diminished utility.
We are left, then, with the possibility that at least the subjective measures of usability are unidimensional. Conceptually, this cannot be the case if we accept the notion of usability as a multidimensional construct and accept that subjective evaluations need to reflect this complexity. … Indeed, various attempts to develop a usability assessment scale endorse this claim by listing separate usability dimensions. Still, some subjective questionnaires such as SUS (Brooke, 1996) are purported to be unidimensional … As with the case of objective usability, however, these claims do not bear up to empirical scrutiny. For example, the supposedly unidimensional SUS questionnaire is demonstrably multidimensional. (p. 155)
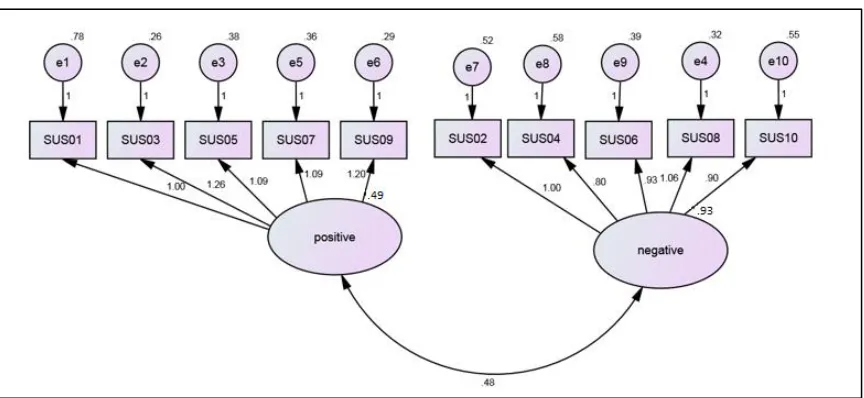
Even though some standardized usability questionnaires assess practical and theoretical components of perceived usability, those components are rarely if ever truly statistically independent. For example, Lewis (2002) reported significant correlations among the three subscales of the Post-Study System Usability Questionnaire (PSSUQ) and the Computer System Usability Questionnaire (CSUQ; replicated in Lewis, 2018a, 2018c), even though those
subscales had been developed using factor analysis and classical test theory.
Journal of Usability Studies Vol. 14, Issue 1, November 2018 same factor pattern has been reported for the Usability Metric for User Experience (UMUX; Lewis, Utesch, & Maher, 2013), a standardized questionnaire designed to correspond with the SUS (Finstad, 2010).
Figure 2. The factor structure of the SUS (reprinted from Lewis & Sauro, 2017, with permission of the publisher).
Correlation and Correspondence among Different Standardized Measures of
Perceived Usability
Since 2013, I have been investigating the correlation and correspondence among three different standardized measures of perceived usability: PSSUQ/CSUQ (Lewis, 1995), SUS (Brooke, 1996), and UMUX (Finstad, 2010). The SUS and the CSUQ are two widely used standardized questionnaires for the assessment of perceived usability (Lewis, 2018a, 2018c; Sauro & Lewis, 2009). The UMUX (Finstad, 2010) and its variants (UMUX-LITE and UMUXLITEr; Lewis et al., 2013, 2015) are relative newcomers, but have sparked a considerable amount of research. All three were developed with a common goal, but in different times and places by different groups of researchers. The PSSUQ/CSUQ was developed in the late 1980s by a group of usability practitioners and researchers at IBM. John Brooke (1996, 2013) developed the SUS in the mid-1980s for a usability engineering program at DEC’s Integrated Office Systems Group in Reading, UK. Finstad (2010) designed the UMUX at Intel to get a measure of perceived usability that would be consistent with the SUS but would only require responses to four items.
On their faces, they are quite different. The CSUQ (Version 3) has 16 items, the SUS has 10, the UMUX has 4, and the UMUX-LITE has 2. Only the CSUQ has well-defined subscales in addition to its overall measurement. The CSUQ items all have a positive tone with 7-point end-anchored scales that include NA outside the scale; the standard SUS and UMUX are mixed-tone questionnaires with, respectively, 5- and 7-point end-anchored scales and no NA response option. The rules for computing CSUQ scores do not require any special treatment of missing values, but the SUS and UMUX developers recommend replacing missing values with the center point of their scales (3 for the SUS, 4 for the UMUX) because the standard method of computing SUS and UMUX scores requires a complete questionnaire. (Lewis, 2018c, p. 1151)
Journal of Usability Studies Vol. 14, Issue 1, November 2018 to be measuring essentially the same thing. Given the goals of their developers and the content of their items, that “thing” is presumably the construct of perceived usability.
What about the Technology Acceptance Model?
At roughly the same time that usability researchers were producing the first standardized usability questionnaires, researchers in the management of information systems were tackling similar issues. One of the most influential of these has been the Technology Acceptance Model, or TAM (Davis, 1989). According to the TAM, the primary factors that affect a user’s intention to use a technology are its perceived usefulness (PU) and perceived ease of use (PEOU). Actual use of technologies is affected by the intention to use, which is itself affected by the perceived usefulness and usability of the technology. In the TAM, perceived usefulness is the extent to which a person believes a technology will enhance job performance, and perceived ease of use is the extent to which a person believes that using the technology will be effortless. A number of studies support the validity of the TAM and its satisfactory explanation of end-user system usage (Wu, Chen, & Lin, 2007). Tractinsky (2018) cited the TAM as a laudable example of the use of constructs in scientific and practical model building.
Constructs contribute to a theory if they add to our understanding of the phenomenon under study. For example, the general domain that serves as the background for the emergence of the usability construct, namely, the use (often termed adoption or acceptance) of information technology, is a point of contact with various other theories. A notable such theory is the technology acceptance model (TAM; Davis, Bagozzi, & Warshaw, 1989). In TAM, the constructs PEOU (a close relative of the intuitive meaning of “usability”) and “perceived usefulness” are instrumental in explaining variations in the construct “behavioral intention” (people’s intention to use a certain information system or product). Unfortunately, as previously mentioned, it is hard to name any influential theory in which the construct of “usability” plays a similarly useful role. (p. 141)
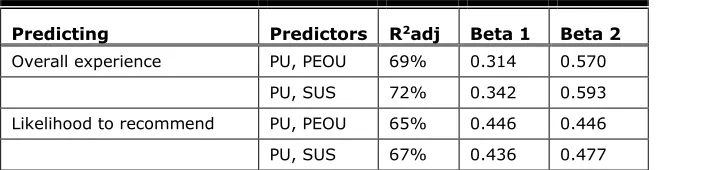
In Lewis (2018b), participants rated their experience using PowerPoint with the SUS and a version of the TAM slightly modified for the assessment of user experience as opposed to the intention to use (e.g., the first TAM item was changed from “Using this product in my job would enable me to accomplish tasks more quickly” to “Using this product in my job enables me to accomplish tasks more quickly than other products in its class”—these modifications did not affect the factor structure of the TAM). Respondents also rated their overall experience with the product and their likelihood to recommend it. Table 1 shows the results (adjusted R2 and beta weights) for regression models predicting overall experience and likelihood to recommend with (1) the PU and PEOU components of the TAM and (2) replacing PEOU with the SUS.
Table 1. Predicting Overall Experience and Likelihood to Recommend with PU, PEOU, and SUS
Predicting Predictors R2adj Beta 1 Beta 2
Overall experience PU, PEOU 69% 0.314 0.570
PU, SUS 72% 0.342 0.593
Likelihood to recommend PU, PEOU 65% 0.446 0.446
PU, SUS 67% 0.436 0.477
Note: Beta weights 1 and 2 are those for the predictors in their order of presentation in the table (e.g., for the first row the beta weight for PU was 0.314 and for PEOU was 0.570)
Journal of Usability Studies Vol. 14, Issue 1, November 2018 extended from the behavioral intention of use (before use) to the behavioral intention to
recommend (after use) and to the prediction of levels of overall user experience.
The Construct of Usability: Apparently Alive and Well
Tractinsky’s (2018) paper is undoubtedly a valuable contribution to the literature of usability science. Although I do not agree with its premises or conclusions, I admire its construction and I learned a lot from reading it. I hope that it will lead to additional research that will improve the understanding of the construct of usability, as it has inspired the writing of this essay. Following are the reasons why I disagree with his arguments.
First, I question whether usability is truly an umbrella construct—a “broad concept or idea used loosely to encompass and account for a set of diverse phenomena” (Hirsch & Levin, 1999, p. 200), at least in the context of industrial usability testing. Structural analysis of objective and subjective data from industrial usability studies (Sauro & Lewis, 2009) has provided evidence consistent with an underlying construct of usability that can manifest itself through objective and subjective measurement. It seems plausible that when a system intended for human use has been properly designed, then the users of that system will complete tasks successfully and quickly, and will be sufficiently aware of this to experience, at a minimum, satisfaction as a consequence of perceived usability.
With regard to perceived usability, it now appears that reports of meaningful factor structure in the SUS may have been premature (Lewis & Sauro, 2009), with more recent analysis indicating a nuisance structure due to the mixed positive and negative tone of its items (Lewis & Sauro, 2017). Furthermore, the development of subscales developed using factor analysis does not preclude the calculation of an overall measure of perceived usability. Investigation of correlation and correspondence of three independently developed usability questionnaires (CSUQ, SUS, and UMUX) has provided compelling evidence that they are measuring the same underlying
construct (Lewis 2018a, 2018c, 2018d). There is also evidence that this is the same underlying construct assessed by the PEOU component of the TAM (Lewis, 2018b).
So, rather than being a dead end, I believe the construct of usability has a bright future both in usability science (theory) and usability engineering (practice), either alone or as a fundamental part of the larger assessment of user experience. Any report of its death is an exaggeration.
References
Brooke, J. (1996). SUS: A “quick and dirty” usability scale. In P. W. Jordan, B. Thomas, B. A. Weerdmeester, & I. L. McClelland (Eds.), Usability evaluation in industry (pp. 189–194). London, UK: Taylor & Francis.
Brooke, J. (2013). SUS: A retrospective. Journal of Usability Studies, 8(2), 29–40.
Coovert, M. D., & McNelis, K. (1988). Determining the number of common factors in factor analysis: A review and program. Educational and Psychological Measurement, 48, 687–693. Davis, F. D. (1989). Perceived usefulness, perceived ease of use, and user acceptance of
information technology. MIS Quarterly, 13(3), 319-339.
Davis, F. D., Bagozzi, R. P., & Warshaw, P. R. (1989). User acceptance of computer technology: A comparison of two theoretical models. Management Science, 35(8), 982–1003.
Finstad, K. (2010). The usability metric for user experience. Interacting with Computers, 22, 323–327.
Hirsch, P. M., & Levin, D. Z. (1999). Umbrella advocates versus validity police: A life-cycle model. Organization Science, 10(2), 199–212.
Hornbæk, K., & Law, E. (2007). Meta-analysis of correlations among usability measures. In Proceedings of CHI 2007 (pp. 617–626). San Jose, CA: ACM.
Journal of Usability Studies Vol. 14, Issue 1, November 2018 Leong, F. T. L., & Austin, J. T. (2005). The psychology research handbook: A guide for graduate
students and research assistants. Thousand Oaks, CA: Sage Publications.
Lewis, J. R. (1995). IBM computer usability satisfaction questionnaires: Psychometric evaluation and instructions for use. International Journal of Human-Computer Interaction, 7, 57–78. Lewis, J. R. (2002). Psychometric evaluation of the PSSUQ using data from five years of
usability studies. International Journal of Human-Computer Interaction, 14(3-4), 463–488. Lewis, J. R. (2018a). Measuring perceived usability: SUS, UMUX, and CSUQ ratings for four
everyday products. International Journal of Human-Computer Interaction (DOI:
https://doi.org/10.1080/10447318.2018.1533152).
Lewis, J. R. (2018b). Measuring perceived usability: SUS, UMUX, and the Technology Acceptance Model (IBM TR BCR-UX-2018-0004). Boca Raton, FL: IBM Corp.
Lewis, J. R. (2018c). Measuring perceived usability: The CSUQ, SUS, and UMUX. International Journal of Human-Computer Interaction, 34(12), 1148–1156.
Lewis, J. R. (2018d). The System Usability Scale: Past, present, and future. International Journal of Human-Computer Interaction, 34(7), 577–590.
Lewis, J. R., & Sauro, J. (2009). The factor structure of the system usability scale. In
International Conference on Human Centered Design (pp. 94–103). Heidelberg, Germany: Springer-Verlag.
Lewis, J. R., & Sauro, J. (2017). Revisiting the factor structure of the System Usability Scale. Journal of Usability Studies, 12(4), 183–192.
Lewis, J. R., Utesch, B. S., & Maher, D. E. (2013). UMUX-LITE – When there’s no time for the SUS. In Proceedings of CHI 2013 (pp. 2099–2102). Paris, France: Association for
Computing Machinery.
Lewis, J. R., Utesch, B. S., & Maher, D. E. (2015). Measuring perceived usability: The SUS, UMUX-LITE, and AltUsability. International Journal of Human-Computer Interaction, 31(8), 496–505.
Lewis, M. (2017). The undoing project. New York, NY: W. W. Norton.
Sauro, J., & Lewis, J. R. (2009). Correlations among prototypical usability metrics: Evidence for the construct of usability. In Proceedings of CHI 2009 (pp. 1609–1618). Boston, MA: Association for Computing Machinery.
Sauro, J., & Lewis, J. R. (2016). Quantifying the user experience: Practical statistics for user research (2nd ed.). Cambridge, MA: Morgan Kaufmann.
Tractinsky, N. (2018). The usability construct: A dead end? Human-Computer Interaction, 33(2), 131–177.
Wu, J., Chen, Y., & Lin, L. (2007). Empirical evaluation of the revised end user computing acceptance model. Computers in Human Behavior, 23, 162–174.
About the Author
James R. (Jim) Lewis