Volume 3, 2018, Pages 2250–2258
HIC 2018. 13th International Conference on Hydroinformatics
Visualising the Operation of Evolutionary Algorithms
Optimising Water Distribution Network Design Problems
David J. Walker
1and Matthew J. Craven
21
Centre for Water Systems, University of Exeter, Exeter, EX4 4QF, UK.
2
Centre for Mathematical Sciences, Plymouth University, Drake Circus, Plymouth, PL4 8AA, UK.
Abstract
Multi-objective evolutionary algorithms (MOEAs) are well known for their ability to optimise the water distribution network design problem. However, their complex nature often restricts their use to algorithm experts. A method is proposed for visualising algorithm performance that will enable an engineer to compare different optimisers and select the best optimisation approach. Results show that the convergence and preservation of diversity can be shown in a simple visualisation that does not rely on in-depth MOEA experience.
Keywords: evolutionary computation, optimisation, visualisation, water distribution network design.
1
Introduction
Optimisation problems abound in hydroinformatics, with water distribution network (WDN) design being a prominent example. An approach that has been widely used to optimise such problems is evolutionary computation. Evolutionary algorithms (EAs) are search algorithms that optimise complex problems based on the principles of natural selection observed in the real world. While methods for generating solutions using an EA are plentiful (seeWang et al.(2014) for a recent review), visualisation methods associated with EAs have lagged behind. Some work exists on population visualisation (e.g.,Fu et al.(2012)), enabling the algorithm user to present a decision maker with a set of solutions from which they can select the final design for implementation, but there has been little work on visualising the optimisation processes used to generate solutions. Such visualisation is an important consideration, enabling the user to understand how effective their evolutionary search is; this paper demonstrates the use of such a visualisation method to visualise the performance of a suite of EAs used to optimise benchmark WDNs.
seeks to narrow that gap by proposing a visualisation method that can reveal how successful the parametrisation of an EA is at solving the problem at hand. EAs comprise a set ofoperators, which mimic an aspect of natural evolution. The application of all of these operators is governed by parameters, controlling (for example) how much of a solution is mutated; a strong mutation changing most of a solution will encourage more exhaustive search of the solution space, but at the expense of the ability to exploit known good solutions. Parametrisations are problem specific, and thus it is important to have a principled approach for parametrising an algorithm for a new problem. This paper presents the advancement of a recent method (Walker and Craven,2018) for visualising algorithm performance to the analysis of EAs optimising the WDN problem. The method has been applied to continuous test problems and to a basic instance of the WDN problem. Following more extensive analyses of that experiment, this paper presents a more thorough analysis of its use on a more complex WDN design problem - comprising a larger number of pipes and, thus, presenting the EA with a larger search space - which it optimises with EAs of populations of different sizes to compare the performance of the visualisations under different conditions. The paper is structured as follows. Following background material in Section 2, Section 3 outlines the visualisation method. Section 4 describes the experimental setup and Section 5 describes the visualisations resulting from the simulations. Concluding remarks are made in Section 6.
2
Background
Designing an effective WDN is a highly combinatoric problem. Hence, an exhaustive search of the search space of possible designs is infeasible. EAs are search algorithms commonly applied to such problems. The algorithms are based on the concepts of reproduction and survival of the fittest found in the natural world. The work presented herein is concerned with one of the best known varieties of EA, thegenetic algorithm(GA). A GA optimises a problem by maintaining a pool of candidate solutions to the problem; initialised at random, over some number of iterations (calledgenerations) the population aims to converge on a good approximation of the optimal solution, or set of solutions. One operator is the crossover operator, which generates a new solution from two (or more) parents, while another - themutationoperator - introduces variety into the population by making random changes to a child. Having analysed the quality of the child solutions generated usingobjectivefunctions - mathematically defined notions of how suitable a candidate solution is - theselectionoperator is used to identify the strongest solutions and ensure that they persist as parents in the next generation.
multiple EA runs, aiming to identify good (and bad) parametrisations of an algorithm.
3
Visualising Algorithm Performance
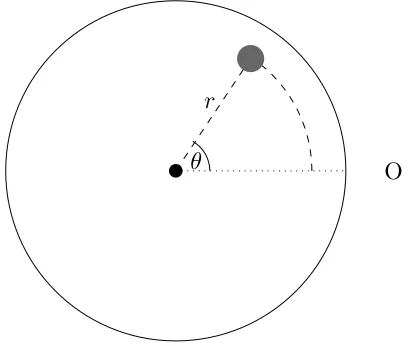
The visualisation consists of a circle, in which a small circle represents a solution during the execution of an EA. Figure 1 presents a schematic of the visualisation. The grey circle rep-resents a single solution within one of the populations of solutions at a specific point during EA execution. Information about the population is conveyed by the distance of the circle from the centre of the visualisation, its angle from the origin (‘O’ in the figure) and its colour. Two important aspects of algorithm operation are the convergence of the population to the true Pareto front, and the diversity within the population (which ensures that the search properly explores the space of candidate solutions). Convergence is shown using hypervolume (Fleischer,
2003), which computes the volume of objective space between the population and a predefined reference point. Specifically, the visualisation shows the difference between the hypervolume of one generation and the next; when the search begins, this will be large as the population searches through the space. As the algorithm converges, and exploits known strong solutions, they hypervolume will change less. The colour of a solution shows the mean crowding distance of solutions within the population. A low value on this measure conveys that solutions are close together, implying the search is not properly exploring the space. The radius of the circle from the centre of the visualisation shows an aspect of the optimiser; in this case, the type of mutation has been conveyed (each type of mutation, as discussed later, has its own ring).
θ
r
O
Figure 1: Illustrating the placement of a single solution in the visualisation. A candidate solution is shown by the filled grey circle. The distance r determines the distance of the solution from the centre of the visualisation, and the angleθgoverns its angle from the origin (Walker and Craven, 2018).
4
Experiments
demon-strate the efficacy of the proposed methods, the New York Tunnels and Hanoi networks are optimised with EAs using both 10- and 100-solution populations. A similar initial experiment demonstrated the potential of this process wherein the execution of an EA with a 10-solution population was demonstrated (Walker and Craven,2018). Hydraulic information is provided by Epanet (Rossman, 2000), and solutions are evaluated under two objective functions: network cost (1) and head deficit (2), both to be minimised.
f1=
K
X
k=1
1.1dkb×lk
(1)
f2=
P
X
n=1
ˆ
hn−hn
>0 (2)
We have thatb is a network-specific constant (b= 1.24 for New York Tunnels and b= 1.5 for Hanoi). The length and diameter of pipek(out of a total of K pipes in the WDN) are given bylk and dk, respectively. The target head for a node is given by ˆhn, while the actual head is
denoted byhn. The problem is optimised using a GA, which uses a population ofN solutions
(where either N = 10 or N = 100). At each generation of the algorithm, members of the current parent population are combined using crossover to produce a population of candidate child solutions. The child solutions are then mutated with the application of a simple heuristic. To show different algorithm behaviours in the visualisation, the algorithm is run with five different heuristics:
• Shuffle: a block of pipe diameters are selected at random and their order is randomly permuted.
• Swap: a pair of pipes are selected and their diameters exchanged.
• Ruin and recreate: the solution is replaced with a completely new chromosome, gen-erated at random from the available pipe diameters.
• Change pipe: the diameter of a randomly selected pipe is changed to another available size at random.
• Change by one size: the diameter of a randomly selected pipe is increased or decreased to the next available size.
5
Results
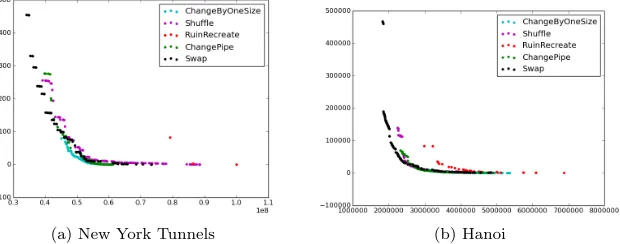
Each parametrisation of the algorithm was executed for 5,000 generations. After that time, the estimated Pareto fronts for the New York Tunnel problem were as shown in Figure2. Figure3
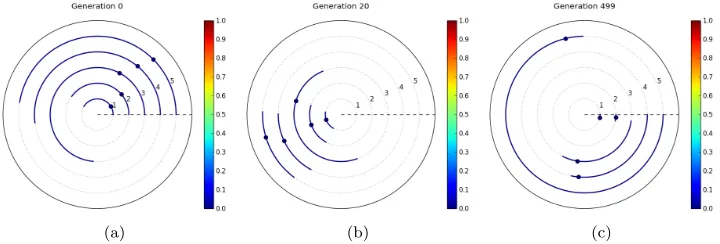
the knee of the approximated Pareto front, the region of the front representing the best known trade-off between the two objectives. Colour between these three plots shows the reducing crowding distance (moving from red/green to blue), indicating diversity is reducing as the optimiser converges toward the Pareto front. Using such schematics allows the user to verify the optimiser is converging and that diversity is not reducing too quickly.
(a) New York Tunnels (b) Hanoi
Figure 2: Estimated Pareto fronts for New York Tunnels produced by the optimisation algo-rithms. The left-hand version shows the final Pareto front approximation obtained over the 5,000 generations the algorithm executed for, while the right-hand panel shows the final search populations. Colour indicates the type of mutation used (cyan change by one size; green -change pipe; red - ruin and recreate; magenta - shuffle; and black - swap).
(a) (b) (c)
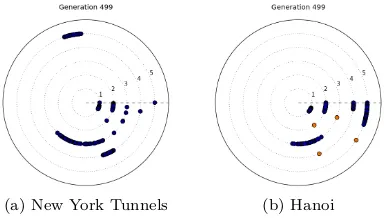
Figure 3: Visualisations of algorithm performance during the execution of the five EAs (using a population of 10 solutions) on the New York Tunnels problem. Colour indicates crowding distance - blue solutions have a low crowding distance, and red solutions a high distance.
Figure 4 shows similar results for the Hanoi problem. As above, this problem features a larger number of pipes for which sizes must be chosen from six available diameters. Here, similar behaviour is shown to that of Figure 3, in that the ‘change by one size’ and ‘change pipe’ heuristics have converged. In this example, the ‘shuffle’ heuristic has also resulted in convergence, while ‘ruin and recreate’ and ‘swap’ have still not converged.
(a) (b) (c)
Figure 4: Visualisations of algorithm performance during the execution of the five EAs on the Hanoi problem. Colour indicates crowding distance - blue solutions have low crowding distance, and red solutions high distance.
called for. Figure5 shows estimated Pareto fronts for the same five heuristics on New York Tunnels (left) and Hanoi (right). Figure6 shows corresponding performance visualisations for those EAs. As can be seen, the behaviour of the heuristics is generally consistent with that seen in the 10-solution population, with the ‘change by one size’ and ‘change pipe’ heuristics generally showing more consistently good performance than the other three heuristics. That said, due to the number of solutions in the population, it is now difficult to observe distinct solutions. To this end, the visualisation method was modified to improve this cluttered view of the populations. Rather than presenting the individual solutions, summary statistics on the convergence and diversity properties of the population are shown instead. A line shows the region between the maximum and minimum hypervolume shown by any individual within the population, and the solution with the median hypervolume is marked by a circle. Colour still indicates diversity, this time showing the mean diversity score (in these experiments, mean crowding distance is shown).
(a) New York Tunnels (b) Hanoi
Figure 5: Final Pareto fronts for New York Tunnels (left) and Hanoi (right), produced using EAs with a population of 100 solutions. As can be seen, the coverage of the Pareto front is better in both cases.
(a) New York Tunnels (b) Hanoi
Figure 6: A visualisation of algorithm performance for the final generation of (a) the New York Tunnels and (b) Hanoi optimisations. Individual solution clarity is reduced due to the increased number of solutions. (Note: the EA executed for fewer generations to take account of the increased number of solutions in the population.)
plot would be. Though offering a simpler view, in this small-population example there is not much extra information to be gleaned in terms of convergence over that available in Figure3. Interestingly, those solutions with a high crowding distance in Figure 3appear to be outliers, as the mean crowding distance is uniformly low. This indicates that the EA in use is perhaps not searching the space fully, and is unsurprising since the EA in use does not make use of diversity-preserving mechanisms.
The summary statistics plots shown in Figure8illustrate algorithm performance for an EA optimising New York Tunnels with a 100-solution population. Unlike a comparison between Figures 3 and 6, comparing these plots with those in Figure 7 shows that there is no extra complexity introduced into the visualisation by increasing the population size. As has been seen before, ‘change by one size’ and ‘change pipe’ are the winning heuristics, on this occasion by a considerable margin. The ‘swap’ heuristic in particular has converged very poorly on this run. It is important to note that the algorithm allows “backward moves”, that is, solutions can be perturbed to a position poorer than their starting point; such a solution would not be placed into the archive, but might persist in the population, as is the case here. The worst solution in the ‘swap’ heuristic ring is worse by the end of the optimisation than it is at the beginning. Figure9shows algorithm performance for the 100-solution population EA optimising the Hanoi network. Again, convergence is clearly visible for ‘change by one pipe’ and ‘change pipe’, with the usual heuristics lagging behind. As with the previous two examples, diversity in the population is low. As can be seen from Figure 5, this has not prevented the solutions from spreading out along the Pareto front.
6
Conclusion
in-(a) (b) (c)
Figure 7: Visualisations of algorithm performance for New York Tunnels, for the 10-solution population EA (corresponding to the results shown in Figure3), showing summary population statistics.
(a) (b) (c)
Figure 8: Visualisations of algorithm performance for New York Tunnels, for the 100-solution population EA showing summary population statistics rather than individual solutions.
formation in a less cluttered fashion. Further ongoing experiments will demonstrate a wider range of algorithm performance measures that will cause the algorithms to behave in different ways. Specific attention is being given to highlighting multi-objective aspects of the EAs, such as highlighting non-dominated population members. Current work is also examining methods for incorporating decision space into the visualisation, rather than just considering objective space as is the case herein. A promising avenue of investigation in this direction is examining the evaluation of decision space diversity.
7
Acknowledgements
David Walker was supported by EPSRC grant EP/P009441/.
References
(a) (b) (c)
Figure 9: Visualisations of algorithm performance for Hanoi, for the 100-solution population EA, showing population statistics.
pages 519–533. Springer, 2003.
G. Fu, Z. Kapelan, J. R. Kaspryzyk, and P. Reed. Optimal Design of Water Distribution Sys-tems Using Many-objective Visual Analytics.J. Water Resources Planning and Management, 139(6):624–633, 2012.
E. Hart and P. Ross. GAVEL - a new tool for genetic algorithm visualization.IEEE Transactions on Evolutionary Computation, 5(4):335–348, Aug 2001.
E. Keedwell, M. Johns, and D. Savi´c. Spatial and temporal visualisation of evolutionary algo-rithm decisions in water distribution network optimisation. In Proceedings of Visualisation in Genetic and Evolutionary Computation (VizGEC 2015) held at GECCO 2015, GECCO Companion ’15, pages 941–948, 2015.
L. A. Rossman. EPANET 2 Users Manual, 2000.
D. J. Walker, R. M. Everson, and J. E. Fieldsend. Visualising mutually non-dominating solution sets in many-objective optimization. IEEE Transactions on Evolutionary Computation, 17 (2), April 2013.
David J Walker and Matthew J Craven. Toward the online visualisation of algorithm perfor-mance for parameter selection. InInternational Conference on the Applications of Evolution-ary Computation, pages 547–560. Springer, 2018.