58
International Journal of Management, Economics and Social Sciences
Special Issue-International Conference on Medical and Health Informatics (ICMHI 2017) 2018, Vol. 7(S1), pp.58 – 72.
ISSN 2304 – 1366 http://www.ijmess.com
Efficiency Evaluation of China’s Investment in
Africa under the Background of Constructing
‘Silk Road Economic Belt’: Application of DEA
Model and Malmquist Index Method
*Tian Ze1
Fan Yumei2
Liu Chao3
1
School of Business Administration, Hohai University, Changzhou, China
2
School of Foreign Languages, Huazhong University of Science and Technology, Wuhan, China
3
School of Business Administration, Hohai University, Nanjing, China
In recent years, with implementation and propulsion of the strategic planning “One Belt and One Road” of China, quality and
efficiency of China’s foreign direct investment have
increasingly become a focused issue. This paper utilizes the DEA model and Malmquist index method to select the data of China’s investment in 20 countries of Africa and conducts the empirical research on dynamic evaluation of efficiency of China’s direct investment in Africa. The result shows that the general efficiency of China’s direct investment in Africa is in a declined fluctuation trend, while the technical efficiency of the investment is in a constant rising trend, and direct investment in most host countries has reached or is reaching the optimal scale. From the perspective of country difference, the efficiency of direct investment in a small number of host countries has been improved while that in most host countries has declined. With improvement of African countries in absorbing and utilizing foreign technologies and management level and effective innovation of China’s direct investment in host countries, the efficiency of direct investment in host countries will be constantly improved. The suggestions such as optimizing investment location selection, emphasizing on the linkage between support facilities and industrial chain of the investment project, improving technology spillover efficiency and enhancing infrastructure investment are proposed.
Keywords: Africa, foreign direct investment, efficiency evaluation, DEA, Malmquist index, Silk Road Economic Belt
Africa is the strategic intersection in the planning and construction of “ one Belt and One Road” . As a
continent with the largest number of developing countries, Africa possesses abundant natural resources,
labor resources and giant market potential. China is the largest development country and the second largest
economic entity in the world, thus the complementarity between Chinese economy and African economy is
good. Both sides possess many common integrating points in economic strategic interests. Economic and
Manuscript received May 20, 2017; revised September 17, 2017; accepted October 28, 2017. © The Author(s); CC-BY-NC; Licensee IJMESS
59
trade cooperation between China and Africa can not only promote industrialization and modernization of
Africa, but also has significant impact on economic development of China and the world. Since 2000 when
“ China-Africa Cooperation Forum” was successfully started, Sino-African trade and investment have
entered into a constantly rapid development period. On December 5, 2015, China-Africa Cooperation Forum
- Johannesburg Summit was successfully held. This summit upgraded the Sino-African relationship into the
comprehensive strategic partnership and approved Summit Declaration and Action Plan (2016-2018). Taking
the opportunity of Johannesburg Summit, both parties will comprehensively promote Sino-African
cooperation, industrialization and agricultural modernization of Africa and accelerate effective connection
between African dream and the Chinese dream. Africa is the strategic highland of “ 21st Century Maritime
Silk Road” , thus African countries will positively participate in the planning and construction of “ One Belt
and One Road” so as to improve the connectivity level of Africa. Sino-African cooperation and development
will usher a great historical opportunity.
In recent years, China’ s direct investment in Africa is increasing rapidly, which has greatly promoted
Sino-African trade development and accelerated excessive capacity transfer and industrial upgrading of
China. From 2008 to 2014, the annual average growth rate of stock of China’ s direct investment in Africa
was about 27% and the investment had reached USD 32.35 billion (by the end of 2014). China’ s direct
investment in Africa has covered 52 countries, and the investment coverage rate exceeds 90%. The
investment range is no longer limited to the field of resources and minerals such as petroleum, but has been
expanded to the fields such as construction industry, financial industry, manufacturing industry and
agriculture. At the time when large-scale increase of China’ s direct investment in Africa is achieved, the
problems such as frequent investment risks, extensive operation and industrial disperse also appeared.
Quality and efficiency of the investment in Africa also aroused people’ s attention. For this reason, it is quite
necessary to carry out the research on efficiency evaluation of China’ s direct investment in Africa.
LITERATUREREVIEW
International Journal of Management, Economics and Social Sciences
60
utilizing foreign investment. Haskel and Slaughter [1] studied the economic growth effect caused by foreign
companies on the host countries respectively by taking Venezuela and England as examples. The result
considers that technology spillover effect of foreign investment shows positive correlation. Dupasquier and
Osakwe [2] studied the effect of utilizing foreign investment in African countries. The result indicates that the
promotion effect of foreign investment is quite obvious. Chunying and Bo [3] utilizes VAR model to study the
influence of foreign direct investment absorbed by China on the economic growth of China and the balanced
and dynamic relations of influencing factors. The result shows that foreign investment has positive effect on
economic growth. Shujie and Genfu [4] verified that foreign investment could promote improvement of
production technology efficiency of host countries and pointed out that attracting foreign investment was an
important manner for emerging industrial countries in pursuing the developed countries. Research of Hong
and Shumie [5] indicates that foreign investment has positive effect on China’s economic growth and has obviously promoted employment and economic growth of China which is in a fluctuation trend. Meibo and
Dongyan [6] considers that China’s investment in African infrastructure construction is beneficial for propelling capacity building of Africa and improving its self-development capacity. Based on the research on
evaluation of China’s investment in African agriculture, Shaosa [7] considers that China’s investment in African agriculture can help solve the food crisis which bothers Africa for a long term.
Researches of domestic and foreign scholars on efficiency evaluation of direct investment in host
countries. Most researches are about investment efficiency evaluation carried out mainly by DEA and
relevant models. Kravisova [8] utilizes DEA model to evaluate the efficiency of foreign direct investment in
host countries. The result shows that the influence of foreign investment on economy of host countries is
positive. Badunenko, Henderson and Houssa [9] utilizes DEA method to conduct empirical analysis on the
data from 35 countries in Africa. The research considers that human resources and material resources are
principal factors in economic growth of Africa. Favorable government management and infrastructure are
also beneficial for economic development of Africa. Based on DEA model, Yuechun and Yingzi [10]
evaluated the foreign investment efficiency and influencing factors of China’s environmental protection industry by taking the panel data of more than 30 provinces and cities nationwide from 2003 to 2009 as
61
DEA method to construct an environmental technology model and utilizes SBM directional distance function
and common boundary ML productivity index to measure the inter-provincial environmental efficiency of
China between 1992 and 2012, dynamic evolution and trend of environmental TFP. Bo [12] utilizes DEA
method to evaluate the promotion effect of China’s direct investment in Africa on economic growth of host countries and suggests that the general development trend of China’s investment in Africa shall expand the scale and control the investment in part of the host countries.
In conclusion, existing literatures about evaluation methods, models and empirical researches of foreign
direct investment efficiency and research on economic growth effect of host countries by absorbing and
utilizing foreign investment have certain reference meaning. However, the researches on efficiency
evaluation of China’s direct investment in Africa are relatively less. Based on this, this paper utilizes the DEA model and Malmquist index method to select the data from 2008 to 2014, conducts the research on
efficiency evaluation of China’s direct investment in African host countries from the perspective of the host countries and proposes specific policies and suggestions.
Model Description
-DEA Model
Data envelopment analysis (DEA) is used for evaluating the investment efficiency. It is an efficiency
evaluation method developed based on the concept of relative efficiency by determining the production
leading surface from the perspective of total factor input. It is for evaluating and sorting the relative efficiency
of each decision-making unit of the same type. DEA method does not need to pre-estimate the parameters
or assume the weight or make the data being dimensionless, thus it has certain superiority in avoiding
subjective factors, simplifying algorithm and reducing errors than other evaluation methods [13].
-Malmquist Index of Productivity and its Decomposition
Malmquist index of productivity was proposed by Malmquist, a Sweden economist, in 1953. Based on DEA,
International Journal of Management, Economics and Social Sciences
62
and constructed the Malmquist index of productivity from t th period to t+1th period as shown
in formula (1). In the formula, respectively refer to the distance function of the evaluation
object in the t-th period and t+1th period based on technical reference of the t-th period.
Fare further decomposes the Malmquist variability index of productivity ( ), into technical efficiency
change ( ) and technical change ( ). Wherein the technical efficiency change ( ) is further
decomposed into pure technical efficiency change ( ) and scale efficiency change ( ).
Therefore, formula (1) can be decomposed into formula (2) [14]:
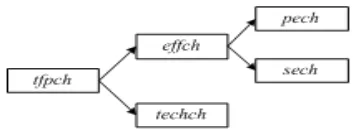
The relations between , , , and can be obtained according to the
decomposition of formula (2), as shown in Figure 1. From t-th period to t+1th period, refers to change
of production efficiency, refers to improvement of productivity level and on the contrary otherwise;
refers to displacement degree of production leading edge which can reflect the change conditions and is also
referred to as “leading surface movement effect”; refers to technical frontier progress and on the contrary otherwise; can reflect technical efficiency changes of the evaluation object, thus it is also
referred to as “catching-up effect”. refers to relative improvement of the evaluation object in technical efficiency and on the contrary otherwise; and decomposed from respectively reflect
the change conditions of pure technical efficiency and scale efficiency of the evaluation object, refers
to efficiency promotion of the evaluation object by improving technology and management and on the
contrary otherwise; refers that the evaluation object is approaching the optimal scale and on the
contrary otherwise. This paper will calculate the Malmquist index of productivity of China’s investment in each host country in Africa and each decomposed index analyzes the dynamic efficiency change of
1 1
( t , t , , )t t
M x y x y
1 1
( , ) ( , )
t t t t t t
D x y 、D x y
1 2
1 1 1 1 1
1 1
1
( , ) ( , )
M ( , , , )
( , ) ( , )
t t t t t t
t t t t
t t t t t t
D x y D x y
x y x y
D x y D x y
1 1 1 2
1 1 1 1 1 1 1 1 1 1 1
1
1 1 1
( , , , )
( , ) ( , ) ( , ) ( , ) ( , )
( , ) ( , )
( , ) ( , ) ( , )
t t t t
t t t t t t t t t t t t t t t
t t t t t t
t t t t t t t t t
M x y x y
D x y VRS D x y CRS D x y VRS D x y D x y
D x y D x y
D x y VRS D x y VRS D x y VRS
effch techch pech sech techch
tfpch
tfp c h
effch techch
pech
effch
sech
tfp c h effch techch pech sech
tfp c h
63
China’s direct investment in each host country and proposes suggestions for strategy adjustment and efficiency improvement of China’s investment in the host countries in Africa.
Evaluation Index and Evaluation Object
-Evaluation Index and Data Source
It is normally considered that effects of foreign direct investment are mainly shown in promoting economic
growth, trade development, tax revenue, financial income growth and infrastructure construction of the host
countries. This paper takes the stock of China’s direct investment in Africa, population in economic activities and labor market efficiency index of the host country as the input factors and takes GDP of the host country,
per capita GDP of the host country, export volume of the host country, fiscal revenue of the host country and
infrastructure development index of the host country as the output factors. The input factors are expressed
by and , and the output factors are expressed by as shown in Table 1.
-Evaluation Object
To ensure accuracy of the result in utilizing DEA to conduct efficiency evaluation, the evaluation objects in
the evaluation process need to be provided with similar characteristics. To ensure that the evaluation result
has a reasonable distinction degree, the number of evaluation objects shall not be less than twice of the
product multiplying the number of input indexes by the number of output indexes [15]. This paper selects top
20 host countries in the ranking of stock of China’s direct investment in Africa by the end of 2014 as the evaluation objects. They are respectively: South Africa, Algeria, Nigeria, Zambia, Congo (Kinshasa), Sudan,
Zimbabwe, Angola, Ghana, Congo (Brazzaville), Namibia, Ethiopia, Tanzania, Kenya, Egypt, Mozambique,
Mauritius, Uganda, Guinea and Chad. Stock of China’s direct investment in the 20 host countries accounts for 88.67% of the total stock of China’s direct investment in the entire Africa (as shown in Figure 2). The
Figure 1. Decomposition of tfpch
1
International Journal of Management, Economics and Social Sciences
64
number of evaluation objects is twice of the product multiplying the number of input indexes by the number of
the output indexes so as to satisfy the requirements for evaluation objects.
Source: Data of China’s direct investment in African countries come from Statistical Bulletin of China’s Outward Foreign Direct Investment, population in economic activities, GDP, per capita GDP and export volume of each host country in Africa come from African Statistical Yearbook, world bank database and database of UNCTAD, labor market efficiency index and infrastructure development index of the host country comes from Global Competitiveness Report and fiscal revenue of the host country is calculated according to the data in African Statistical Yearbook (please refer to Table 1).
Table 1. Input Index and Output Index
65
Evaluation Result and Analysis of China’s Direct Investment in African Countries
-Analysis on Overall Efficiency
The overall efficiency of China’s direct investment in 20 countries of Africa from 2008 to 2014 is calculated by the Malmquist model and DEA P 2.1, and the evaluation result is as shown in (Table 2). The efficiency
tendency chart (as shown in Figure 3) for China’s direct investment in host countries of Africa is drawn. Analysis on the evaluation result is as follows:
From the perspective of overall efficiency change ( ): the overall efficiency of China’ s direct
investment in host countries of Africa from 2008 to 2014 is in a downtrend, and the average value of is
only 0.803. However, the investment efficiency from 2013 to 2014 is in a rapid rising trend. It indicates that
the overall efficiency of China’ s direct investment in Africa is in a declined fluctuation trend, but it is turned
to a rising trend in recent years.
From the perspective of technical efficiency change ( ): technical efficiency of China’s direct
investment in host countries of Africa from 2008 to 2014 is in a stable trend, and the average value of is
1.047. Wherein the technical efficiency from 2010 to 2011 slightly declines, but on the whole, the technical
efficiency of China’s direct investment in Africa is generally maintained stable.
From the perspective of pure technical efficiency index ( ): pure technical efficiency of China’s direct
investment in Africa from 2008 to 2014 is in a stably rising trend and the average value of is 1.047,
wherein the efficiency was greatly improved from 2010 to 2013, which was increased by 20.4%. However,
the technical and management level of 20 countries of Africa in absorbing China’s investment from 2008 to 2014 was generally maintained stable.
From the perspective of scale efficiency ( ): scale efficiency of China’s direct investment in host countries of Africa from 2008 to 2014 is stable and the average value of is 1.000. The scale of China’
s direct investment in 20 countries of Africa has generally reached or is close to the optimal scale.
Technical change ( ) reflects the advance and retreat change of technical leading surface. Advance
of technical leading surface indicates that China’s direct investment has obtained effective innovation activities and on the contrary otherwise. The result shows that the technical leading surface of China’s direct
tfpch
tfpch
effch
effch
pech
pech
sech
sech
International Journal of Management, Economics and Social Sciences
66
investment in 20 countries of Africa from 2008 to 2014 is in a fluctuation trend and the average value is only
0.767. It reflects that whether an enterprise conducts effective innovation activities or not is an important
constraint which influences efficiency improvement of China’ s direct investment in Africa.
Table 2. Malmquist Efficiency Index of China’s Direct Investment in Africa from 2008 to 2014
Figure 3. Malmquist Efficiency Tendency Chart of China’s Direct Investment in Africa
Country Efficiency Analysis
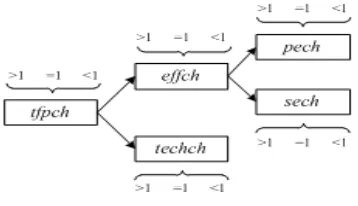
The country efficiency of China’s direct investment in 20 host countries of Africa from 2008 to 2014 is calculated by the Malmquist model and DEA P 2.1, and the result shown in Table 3 can be obtained. The 20
host countries are divided into the following types according to , , , and larger than,
equal to or less than “1”, of each host country in Table 3 and based on the classification rules of Figure 4. Comprehensive Improving Host Countries (Such as Mauritius)
From 2008 to 2014, , , , and of China’s direct investment in Mauritius were larger
pech effch
tfpch techch sech
67
than “1”, wherein the efficiency of China’s direct investment in Mauritius was improved by 9.0%. It indicates that China’s direct investment in Mauritius is conducting effective innovation activities which
Figure 4. Classification of Dynamic Evaluation on Efficiency of China’s Direct Investment in Each Host Country
advances the technical leading surface. Meanwhile, the scale of China’s direct investment in Mauritius is
reaching to the optimal scale. The level of Mauritius in utilizing the technology and management has also
been promoted, which makes the technical efficiency of direct investment promoted. It is thus seen that
advance of technical leading surface and improvement of technical efficiency make the overall efficiency of
China’s direct investment in Mauritius rapidly improved. Technical efficiency promoting host countries, such as Chad
From 2008 to 2014, and of China’s direct investment in Chad was larger than1, while was less than 1. It indicates that the technical leading surface of China’s direct investment in the host countries was not propelled. However, the scale of China’s investment in this kind of host countries is maintained in the optimal scale, the management level of Chad in absorbing and utilizing investment is constantly
improved and the technical efficiency of China’s direct investment in the country is improved, thus the overall
efficiency of China’s direct investment in this kind of countries is improved.
Technical leading surface retreating host countries, such as Zambia, Sudan, Congo (Kinshasa), Angola,
Ghana, Tanzania, Kenya, Mozambique and Sudan
and of China’s direct investment in these host countries are less than “1”. It can be seen that retreating of technical leading surface is the main reason for reduction of overall efficiency of China’ s direct
investment in these host countries. It indicates that China’ s direct investment in these host countries is lack
tfpch effch techch
International Journal of Management, Economics and Social Sciences
68
of effective innovation activities.
Technical leading surface retreating and technical efficiency reducing host countries, such as South Africa,
Algeria, and Congo (Brazzaville)
, and of China’s direct investment in these host countries are less than “1”. It indicates that innovation of China’s direct investment in these host countries is not enough and the technical efficiency of the direct investment is also declining. The decline comprises reduction of investment scale efficiency and
reduction of the level in utilizing technology and management. The reasons from the two aspects have
resulted in the reduction of the general investment efficiency.
In addition to these, it is found by further observing investment scale efficiency of these countries that:
C of China’s direct investment in South Africa, Angola, Algeria, Mauritius, Egypt and Namibia is equal to
“1”, thus the investment scale and the technology utilization level is maintained in the optimal scale; while the
of of China’s direct investment in Zambia, Nigeria, Ethiopia, Ghana, Tanzania, Zimbabwe, Mozambique, Guinea and Chad is larger than “1”, thus the technical efficiency and investment scale are reaching to the optimal scale.
CONCLUSION
This paper selects top 20 host countries in the ranking of stock of China’s direct investment in Africa by the
end of 2014 as the evaluation objects from the perspective of the host countries, utilizes DEA model and
Malmquist index method to calculate the overall efficiency and country efficiency of China’s direct investment
in Africa from 2008 to 2014 and analyzes the dynamic efficiency changes of China’s direct investment in each host country of Africa. The following conclusions are obtained:
On the whole, the overall efficiency of China’s direct investment in Africa is in the declined fluctuation trend, while from 2013 to 2014 it shows a rapidly rising trend. With improvement of technology absorbing and
utilization level of the host countries, technical efficiency of China’s direct investment has been constantly improved. Direct investment in most African host countries has reached or is reaching the optimal scale.
However, lack of effective innovations in the process of China’s direct investment has caused retreating of tfpch effch techch
effch
69
the technical leading surface. Considering all the above factors, the overall efficiency of China’s direct investment in the 20 countries from 2008 to 2014 shows a declined variation trend.
From the level of country difference, the efficiency of China’s direct investment in a small number of host countries has been improved, but the efficiency of the direct investment in most host countries is in the
declining trend. The reason for efficiency improvement comprises: improvement of the level of the host
country in absorbing and utilizing technology and management of China’s direct investment, innovation in the process of China’s direct investment in the host country and the direct investment scale of the host country has reached or is close to the optimal scale. However, decline of overall efficiency of some host
countries is because that China’s direct investment is lack of effective innovation activities, the investment scale is improper and the level of absorbing and utilizing foreign investment technology is low.
SUGGESTIONS
According to the above conclusions, the following suggestions are proposed specific to the actual conditions
of China’s direct investment in each host country of Africa:
It is of necessity to adjust the scale of investment in the host countries and optimize the area selection in
direct investment in Africa. Excessive investment scale and improper investment can be avoided by
adjusting the investment scale. The direct investment efficiency can be optimized by enhancing
agglomeration degree of the invested industries so that the optimal investment scale can be reached. For
some of the host countries in Africa, South Africa, Zambia, Sudan, Ethiopia, Congo (Brazzaville), Egypt,
Uganda and Guinea shall keep existing investment scale; while Algeria, Nigeria, Congo (Kinshasa),
Zimbabwe, Angola, Namibia, Ghana, Tanzania, Kenya and Mozambique shall properly adjust existing
investment scale to improve investment agglomeration degree and scale to realize optimal scale of direct
investment in the host countries.
We should emphasize on supporting facilities of the invested project and connection with the industrial chain,
improve the level of foreign investment utilization and technology spillover efficiency of the host countries.
International Journal of Management, Economics and Social Sciences
70
directly results in reduction of the efficiency of China’s direct investment in them. So in the process of investment in Africa, Chinese enterprises shall pay attention to supporting facilities of the invested projects
and organic connection between upstream and downstream of the industrial chain. The enterprises are
encouraged to enter into Africa “in group” and carry out cluster-type investment so as to enhance the industrial clustering ability and technology spillover effect of the investment in Africa and further promote
efficiency level of China’s direct investment in Africa. In consideration of the trend that Nigeria, Mauritius,
Ghana and Ethiopia have constantly improved their levels of absorbing and utilizing the investment in recent
years, China and Africa plan and jointly build the overseas industrial park and economic and trade
cooperation areas to strengthen the industrial clustering ability and international competitiveness of
enterprise investment.
Innovation of direct investment shall be implemented in Africa. Advance of technical leading surface can be
promoted and the direct investment efficiency can be further promoted by innovations in entrance mode,
investment industrial pattern and management manner of the direct investment in Africa. Besides, China
shall also pay attention to adaption and innovation of technical localization of Chinese enterprises,
encourage the Sino-African cooperation enterprises, establish and jointly build Sino-African economic and
trade cooperation areas, industrial parks and special economic zones, enhance industry-university-research
cooperation and promote industrial clustering ability of the direct investment.
We also need to strengthen infrastructure construction of the host countries and improve investment
environment in Africa. Laggard infrastructure becomes the “bottleneck” which restricts economic development of Africa and foreign investment attraction. African countries have taken infrastructure
construction as the acting point and important breakthrough point in developing economy and improving
investment environment. With implementation of China’s “One Belt and One Road” strategy, China and Africa have carried out major cooperation in infrastructure construction and capacity cooperation, which will
greatly improve the investment environment of each host country in Africa and promote the overall efficiency
71
REFERENCES
[1] Haskel, J.E. & Slaughter, M.J. (2007). Does Inward Foreign Investment Boost the Productivity of Domestic Firm? Review of Economics & Statistics, 89(3):482-496.
[2] Dupasquier, C. & Osakwe, N.P. (2006). Foreign direct investment in Africa: Performance, challenges, and responsibilities. Journal of Asian Economics, 17(2):241-260.
[3] Chunying, Z. & Bo, W. (2006). Analysis on Long-term Equilibrium and Dynamic Relations between Foreign Direct Investment and China’s Economic Growth. Forum of World Economics & Politics, 3, 8-16.
[4] Shujie, Y. & Genfu, F. (2006). Research on the Relationship between Foreign Direct Investment and Economic Growth. Economic Research Journal, 12, 35-45.
[5] Hong, L. & Shusheng, L. (2013).Research on Influence of FDI on Economic Growth and Employment of China – Based on VAR Model. Journal of International Trade, 4, 105-114.
[6] Meibo, H. & Dongyan, L. (2012). China’s Investment in Infrastructure of Africa and assessment on the Investment. International Economic Cooperation, 12, 17-22.
[7] Shaosa, L. (2013). China’s Investment in agriculture of Africa and assessment on the Investment. International Economic Cooperation, 2, 66-70.
[8] Kravtsova, V. (2008). Foreign presence and efficiency in transition economics. Journal of Productivity Analysis, (29):91-102. [9] Badunenko,O., Henderson, D.J. & and Houssa, R. (2010). Explaining African growth performance: A production-frontier approach.
University of Namur: Centre of Research in the Economics of Development (CRED) :2-5.
[10] Yuechun, W. & Yingzi, W. (2012). Empirical analysis on comprehensive efficiency of investment in environmental protection based on DEA Model. Journal of Tongji University, 5, 111-115.
[11] Ming’e, W., Guoping, Z. & Yuequn, C. (2015). Research on total factor productivity growth based on capital service under constraints of environment and resources. China Population, Resources and Environment, 25(5): 83-91.
[12] Bo, J. (2011). Assessment on efficiency of promotion effect of China’s investment in Africa on economic growth of African Host Countries – Based on DEA. Technology Economics, 30(10): 58-65.
[13] Xiang, H., Zhanxin, M. & Chunying, Z. (2010). Review and classification of data envelopment analysis model. Journal of Inner Mongolia University, 41(5): 583-593.
[14] Xiangsun, Z. & Binwei, G. (2008). Analysis on China’s total factor productivity: A review and application of Malmquist Index approach. Journal of Quantitative and Technical Economics, 6, 111-122.
[15] Junrong, Z. & Yaohuang, G. (2004). Relationship between evaluation indicators and DEA efficiency. Systems Engineering -Theory Methodology Applications, 13(6): 520-523.
ACKNOWLEDGMENT
This paper is a phased research result of the National Social Science Fund project “Research on Strategic Adjustment, Attraction Focus and Treatment of Overseas Investment of Chinese Enterprises in Africa under
International Journal of Management, Economics and Social Sciences
72 Table 3. Malmquist Efficiency Index of China’s Direct Investment in Africa from 2008 to 2014
Host
Countries Countries Host
South Africa 0.987 0.920 0.987 1.000 0.908 Ethiopia 1.239 0.766 0.990 1.252 0.949
Zambia 1.068 0.907 0.986 1.083 0.969 Tanzania 1.235 0.766 1.051 1.176 0.946
Nigeria 0.877 1.062 0.871 1.007 0.932 (Brazzaville) Congo 0.998 0.838 1.119 0.892 0.836
Angola 1.166 0.855 1.166 1.000 0.996 Kenya 1.045 0.764 1.057 0.989 0.799
Zimbabwe 1.129 0.713 1.075 1.050 0.805 Egypt 0.861 1.079 0.861 1.000 0.929
Sudan 1.009 0.749 1.066 0.946 0.756 Mozambique 1.196 0.611 1.092 1.095 0.731
Algeria 0.971 0.792 0.971 1.000 0.768 Uganda 1.242 0.515 1.449 0.857 0.639
Congo
(Kinshasa) 1.121 0.715 1.143 0.981 0.801 Namibia 1.014 0.837 1.014 1.000 0.849
Mauritius 1.011 1.093 1.011 1.000 1.105 Guinea 1.649 0.603 1.171 1.408 0.994
Ghana 1.077 0.740 1.025 1.050 0.796 Chad 1.556 0.707 1.048 1.485 1.100