Segmentation of Microarray image using Neural Network
Miss. G.Benet Mary
Designation :PG student , Organization : Loyola Institute of Technology and Science, Email ID : [email protected]
Mr. S. Robinson Sobitharaj
Designation : Asst. Professor , Organization :Loyola Institute of Technology and Science, Email ID : [email protected]
Abstract — Human Bone Cancer - osteosarcoma (osteogenicsarcoma) is the malignant primitive bone tumor occurs most commonly for the children and adolescents .It often affects the long bones of the arms and legs at areas of rapid growth around the knees and shoulders of children. Once cancer is detected, we should know how much area is affected. This will help to take the post diagnosis decisions. Dermoscopic images have great potential in the early diagnosis of malignant Osteosarcoma. The diagnosis can also be done manually but computer aided diagnosis such as Digital Image Segmentation leads to the development of many new segmentation methods in this field. In this paper, I propose and evaluate C-mean based Fuzzy Hopfield Neural Network, Adaline Neural Network and Regression Neural Network for the segmentation of skin lesions in dermoscopic images. The segmentation is done using the three methods and the segmented results are evaluated using different performance metrics.
Keywords — Segmentation, Fuzzy, Neural Network, Hopfield neural network, Regression neural network, Adaline neural network
1.
I
NTRODUCTIONDermoscopy, also known as epiluminescence microscopy, is a non-invasive skin imaging technique that uses optical magnification and either liquid immersion or cross-polarized lighting, making subsurface structures more easily visible when compared to conventional clinical images. Dermoscopy allows the identification of dozens of morphological features such as pigment networks, dots/globules, streaks, blue-white areas, and blotches. This reduces screening errors and provides greater differentiation between difficult lesions such as pigmented Spitz nevi and small clinically equivocal lesions. To diagnose the osteosarcoma in dermoscopy images Image segmentation is used which subdivides an image into its constituent regions or objects. The segmentation should stop when the objects or regions of interest in an application have been detected. It is used in image analysis and recognition. For instance, for the automated detection of cancerous cells from mammographic images, segmentation followed by recognition or classification is required. Another example is that of automatic nondestructive testing techniques,
such as automatic inspection of welding, castings, detection of foreign bodies within food products, etc. Such techniques involve the segmentation of the image, and detection of possible anomalies or foreign bodies within. Therefore the output of such a system is, in most of the cases, directly dependant of the segmented output of the original image. Most of the segmentation algorithms are based on one of two basic properties of intensity values: discontinuity and similarity. In the first category, the approach is to partition an image based on abrupt changes in intensity, such as edges. The principal approaches in the second category are based on partitioning an image into regions that are similar according to a set of predefined criteria. A large numbers of algorithms have been proposed in previous years. One of the Conventional image segmentation algorithms is clustering by which homogeneous properties around a given pixel are enlarged.
The crisp segmentation methods such as region growing, k-means, and split and merge methods are generally used for image segmentation. Besides this, soft segmentation methods were also seen effective for segmentation. Segmentation methods are applied from the artificial intelligence field, especially using neural networks approaches. The present survey is intended to be a more comprehensive study of the existing Neural-network-based segmentation techniques. Adaline Neural Network which is a linear network introduced in this paper to segment the microarray image of human osteosarcoma. In 1982, Hopfield proposed the so-called Hopfield network, which possesses auto-associative properties. It is a recurrent network in which all neurons are connected to each other, with the exception that no neuron has any connection to itself [4].The Hopfield neural network, well-known technique used for solving optimization problems based on Lyapunov energy function. Combination of Fuzzy and Hopfield is a good technique for some problems. Lin, Cheng and Mao proposed the segmentation of single and multi-spectral medical images using a fuzzy Hopfield neural network [2],[5]. Generalized Regression neural network is also used for the segmentation of the skin lesions.
2.
S
EGMENTATIONA
LGORITHMS2.1 Adaline Neural Network
It consists of a weight, a bias and a summation function. It was first developed to recognize binary patterns so that if it was reading streaming bits from a phone line, it could predict the next bit. The difference between Adaline and the standard perceptron is that in the learning phase the weights are adjusted according to the weighted sum of the inputs (the net). In the standard perceptron, the net is passed to the activation (transfer) function and the function's output is used for adjusting the weights. Adaline is a neural network with multiple nodes where each node accepts multiple inputs and generates one output. Given the following variables:
x is the input vector w is the weight vector n is the number of inputs θ some constant
y is the output then we find that the output is
n
j j j
w
x
y
1 (1)
If we further assume that xn + 1 = 1 and wn + 1 = θ then the
output reduces to the dot product of x and w,
y
x
j.
w
j. Adaline Network is a simple Neural Network with two Neuron Layers - one input Neuron Layer and one output Neuron Layer. The output layer has only one Neuron node. Adaline Network is also the first Neural Network we built that "learns". The learning rule is simple: We give it some input values, fire the Network, and compare the output value with the desired value. If there is any discrepancy, the Links in the Link Layer will adjust their weights until the rate of error is smaller than our tolerance. The weight vector w can be obtained by minimizing the least-squares-error criterion. The delta learning rule adopted in ADALINE is a data-adaptive technique for deriving a least-squares-error solution. Let us assume: η is the learning rate (some constant)
d is the desired output
o is the actual output
then the weights are updated as follows
w
w
(
d
o
)
x
. The ADALINE converges to the least squares error which is E = (d − o) 2 .2.2 Clustering Algorithm
Clustering analysis is based on partitioning a collection of data points into a number of subgroups, where the objects inside a cluster (a subgroup) show a certain degree of closeness or similarity. Clustering methods can be considered as either hard (crisp) or fuzzy depending on whether a pattern data belongs exclusively to a single cluster or to several clusters with different degrees. In hard clustering, a membership value of zero or one is assigned to each pattern data (feature vector), whereas in fuzzy clustering, a value between zero and one is
assigned to each pattern by a membership function. The Fuzzy C-means clustering algorithm is based on the minimization of an objective function called C-means functional .It is defined as:
Jm (U, V) =
(
,
)
N
1 j
2 1
i j i
C m
ij
d
X
V
u
(2)Where V= [V1, V2…..VC], is a vector of cluster
prototypes
2.2.1 Fuzzy Hopfield Neural Network method (FHNN method): In this part, the new image segmentation method based on Fuzzy Hopfield neural network is introduced. This method use the fuzzy c-means algorithm to eliminate the need for finding weighting factors in the Lyapunov energy function. The number of neurons used to construct the Network depends on the image size; the larger the image size, the more neurons that are required. These neurons are fully interconnected. The total input of neuron (i, k) denoted as Neti,k can be formulated as
Neti,k= jq ik
N
q c
j
q j k
i
V
I
W
, ,1 1
, ;
, (3)
where N is the number of data points, c is number of clusters, Vj,q denotes the binary state of neuron (j,q),
Wi,j,k,q is interconnection weight between neuron (i,k) and
neuron (j,q), Ii,k is external bias vector for neuron (i,k).
The Hopfield neural network consists of N x c neurons that can be conceived as a 2-D array for the image-segmentation problem and the Lyapunov energy function is given [2] as
E= jq
N
k N
q c
i
q j k i c
j k
i
W
V
V
,1 1 1
, ; , 1
,
2
1
k i,
1 1
k
i,
V
I
N
k c
i (4)
When the Lyapunov energy function is minimized, the neural network reaches a stable state. The optimization problem can be mapped into a 2D fully interconnected Hopfield neural network with the fuzzy c-means algorithm. The total input for neuron (i, k) can be modified [2] as
Neti,k =
2
, 1
, ; ,
m q i N
q
q i k i
k
W
x
+ Ii,k (5)
and Lyapunov energy can be changed [2] as
E=
2
, 1
, ; ,
1 1
,
2
1
mq i N
q
q i k i k
N
k c
i m
k
i
x
W
m k i N
k c
i
I
,1 1
k i,
(6)
m is the fuzzification parameter , imq N
q
q i k i
W
,1 , ;
, is
the total weighed input received from the neuron ( i,q), xk
is x pixel value of image , and membership value µi,k is
the output state at neuron ( i,k). A neuron (i,k) in a maximum membership state indicates that xk pixel
represents cluster centroids in columns, and image pixel in rows. In order to generate an adequate classification with the constraints, we define Lyapunov energy function as follows [2]:
E= 2 , 1 1 , 1 1 ,
1
2
1
m q i N q q N h m h i k N k c i m ki
x
x
N
B
N k c i m k i 1 1 ,2
(7) E is the total intra-class scatter energy that accounts for the scattered energies distributed by all pixels in same class. More specifically, the first term within-class scatter energy, minimizes the intra-class Euclidean distance from a sample to the cluster center in any given cluster and the second term which guarantees those number of data point N in image can only be distributed among these c classes, imposes constraints on the objective function [2]. The quality of classification result is very sensitive to the weighting factors and to search optimal values for these weighting factors is expected to be time-consuming and laborious. To alleviate this problem, a Hopfield neural network with a fuzzy c-means clustering method, called FHNN, is proposed. Because each image pixel can only be occupied by one class, the summation of states in the same row equals 1. This also ensures that only N data points will be classified into these c clusters [7]. That is, the network must match the following constraintsc
i 1 k
i,
=
1
(8)N k c i 1 1 k
i,
=
N
Therefore, the energy function can be further simplified as E= 2 , 1 1 , 1 1 ,
1
2
1
m q i N q q N h m h i k N k c i m ki
x
x
(9)
The normalization operation guarantees that each image pixel will be absorbed on several classes with certain probability degrees so there will be N data points assigned among c clusters. The minimization of energy E is greatly simplified because it contains only one term and hence the requirement of having to determine the weighting factors A and B vanishes. Comparing Eq. (9) with the modified energy function Eq. (6), the synaptic interconnection weights and the bias input can be
obtained as N 1 h , q q j, k ; i,
x
=
W
m h i (10)Ii,k=0
By introducing equations (10) into (5), the input to neuron (i,k) can be expressed as
Neti,k=
2 , 1 1 ,
1
m q i N q q N h m h i kx
x
=[xk-vi]2
=
D
2i,k(11) The membership function for k-th pixel is given as
1 1 1 2 , , , c j m k j k i k i
Net
Net
(12)This membership function is effective to minimize new objective function in iteration. New objective function consists of average distance between image pixels and cluster centroids for separate and compact clustering. New objective function is given as
i,2k
1 1
,
D
1
N k c i m k iN
J
(13)The FHNN Algorithm steps are given below:
1) Given the data set X, choose the nu mber of clusters 1 < c < N, the weighting exponent m > 1 (Membership functions for large value m are fuzzier than those for small value m, but the interconnection weights are updated slowly) , the termination tolerance ε > 0 (is used as a criterion to determine the performance of the objective function. The larger the threshold value ε, the less the numbers of iterations will, however, be the optimal membership function can not be found) and the norm-inducing matrix A.
2) Normalization, (gray levels of image) 3) Calculate of primary centroids v0. 4) Compute the distances
2 ikA
D
=(xk-vi)TA(xk-vi), 1≤ i≤ c, 1≤k≤N.5) Compute the initial membership value
U(0)= i(,0k) =
1 1 1 2 c j m jkA ikA
D
D
6) Compute new cluster centroid
vi=
m q i N q q N h m h i
x
, 1 1 ,1
Neti,k=
2
, 1
1 ,
1
mq i N
q
q N
h m
h i
k
x
x
8) Compute new membership value (Fuzzy c-means) 1
1
1 2
, , ,
c
j
m
k j
k i k
i
Net
Net
9) Compute Jt
2 k i,
1 1
,
D
1
Nk c
i m
k i t
N
J
10) If | J t+1- J t |> go to step 6, otherwise stop. 2.3 Regression Neural Network
Generalized regression neural networks are a kind of radial basis network that is often used for function approximation. Radial basis transfer function calculates a layer's output from its net input. This takes one input, N -- S x Q matrix of net input (column) vectors and returns each element of N passed through a radial basis function. The probability density function used in GRNN is the Normal Distribution.
)
.(
)
(
2
exp
2
exp
2
1
2 2 1
2 2
i T
i i
n
i
i n
i
i i
X
X
X
X
D
D
D
Y
X
Y
(14)
Each training sample, Xj, is used as the mean of a Normal Distribution. The distance, Dj, between the training sample and the point of prediction, is used as a measure of how well the each training sample can represent the position of prediction, X. If the Distance, Dj, between the training sample and the point of prediction is small, exp(-Dj 2/2 2), becomes big. For Dj =0, exp(-Dj 2/2 2), becomes one and the point of evaluation is represented best by this training sample. The distance to all the other training samples is bigger. A bigger distance, Dj , causes the term exp(-Dj2/2 2) to become smaller and therefore the contribution of the other training samples to the prediction is relatively small. The term Yj* exp(-Dj 2/2 2) for the jthtraining sample is the biggest one and contributes very much to the prediction. The standard deviation or the smoothness parameter is subject to a search. For a bigger smoothness parameter, the possible representation of the point of evaluation by the training sample is possible for a wider range of X. For a small value of the smoothness parameter the representation is limited to a narrow range of X, respectively.With (14) it is possible to
predict behavior of systems based on few training samples
predict smooth multi-dimensional curves interpolate between training samples.
3.
P
ERFORMANCEM
EASURESWhen three or more treatments are studied in parallel, a comparison is necessary for each treatment to assess whether one of the treatments is superior to the other. Here three treatments are studied and four different metrics were used to quantify the segmentation. The segmented output image is compared with the ground truth image by using performance metrics. To define these metrics let SR denote the result of an automatic segmentation method and GT denote the Ground truth segmentation obtained by the medical expert. Both SR and GT are Binary images such that all the pixels inside the curve have label 1 and all others have label 0. The metrics are calculated as follows:
3.1 False Positive Error (FPE)
When performing multiple comparisons in a statistical analysis, false positive rate is the probability of falsely rejecting the null hypothesis for a particular test among all the tests performed. If the false positive rate is a constant α for all tests performed, it can also be interpreted as the expected proportion among all tests performed that are false. These metric measures the rate of pixels classified as lesions by the automatic segmentation that were not classified as lesion by the
medical expert.
)
(
#
)
(
#
)
,
(
GT
GT
SR
GT
SR
FPE
(15)
3.2 False Negative Error (FNE)
The FNR measures the rate of pixels classified as lesions by the medical expert that were not classified as lesion by the automatic segmentation.
)
(
#
)
(
#
1
)
,
(
GT
GT
SR
GT
SR
FNE
(16)Clinically, this is worse of two types of error. 3.3 Coefficient of Similarity
The mean and the standard deviation of the coefficient of similarity between the automatic and the manual segmentation is given by
m anual autom atic m anual
v
v
v
|
|
1
(17)3.4 Spatial Overlap
The measure of spatial overlap between the automatic (algorithmic) and the manual segmentation is given as
orithm a m anual
tion er
v
v
v
lg sec int s
*
2
4.
E
XPERIMENTALR
ESULTSThe Malignant melanoma is diagnosed using the three image segmentation methods. The original microarray image of malignant osteosarcoma is shown in figure 1. The size of the image is 256 x 1200.
Fig. 1: Original microarray image of osteosarcoma
The adaline neural network plays an efficient role in dermoscopic image segmentation. The network is constructed and is trained with about 200 training samples and the corresponding training targets. The training samples are the pixels taken from the Melanoma digital image. The neural network trained by the taken training samples segments the affected region from the unaffected region and the segmented result obtained is shown in the fig. 2.
Fig. 2: Segmented Image Using Adaline Neural Network
The second method proposed is FHNN which uses fuzzy C-means for clustering of affected region from unaffected region that involves initially fixing of certain parameters and then the process of clustering. The segmented image using this method is shown in the fig. 3.
Fig. 3: Segmented Image Using FHNN
The third method Regression linear network, a standard network that uses radial basis function is created. The GRNN is trained by the input samples and the corresponding target vectors that are taken from the
malignant melanoma image. The segmented result is shown in the fig. 4.
Fig. 4: Segmented Image Using GRNN
5.
C
OMPARISONO
FS
EGMENTATIONM
ETHODSThe Ground truth image whose parameters are taken as a reference to measure the performance metrics is shown in Fig. 5.
Fig. 5: Ground Truth Image
The four measures are calculated for the segmented images obtained by the three segmentation methods. For more efficient analysis of the segmented results the performance measures are compared. The comparison of the three methods based on FNE,FPE,Coefficient of similarity and Spatial Overlap are shown in the figures 6-9 below.
Fig.6: FPE for different segmentation methods
Fig. 7: FNE for different segmentation methods
Fig. 8: Coefficient of similarity for different segmentation methods
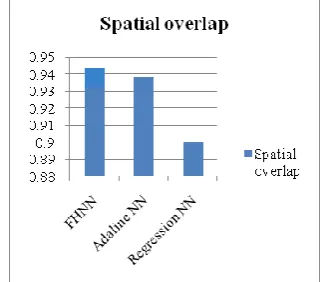
The Coefficient of similarity clearly shows the closeness or similarity of the segmented result with the Ground truth image. While comparing the coefficient of similarity of the results obtained from the 3 segmentation methods the Fuzzy Hpoefield Neural Network stood best with a value of 0.9118 which is close to 1. The Coefficient of Similarity of FHNN is 0.897 and for GRNN is 0.8498. The Spatial Overlap of GRNN is 0.945 and for FHNN and Adaline are 0.932 and 0.9381 respectively.
Fig. 9: Spatial Overlap for different segmentation methods
6.
C
ONCLUSIONIn this paper, various segmentation methods (Adaline NN, GRNN, FHNN) for the diagnosis of bone lesions in Microarray images are proposed and the performance is
evaluated. These methods are simulated on real medical image to evaluate their performance. The image was segmented by an expert dermatologist and the ground truth image is taken for evaluation. The Fuzzy Hopefield Neural Network has shown best result when Coefficient of similarity, Spatial Overlap and FPE are considered. Based on the results it is found that the methods provide better segmentation and thus it is capable of diagnosing the disease more efficiently.
R
EFERENCES[1] Margarida Silvertip, Jacinto C Nascimento, Member IEEE “Comparison of Segmentation Methods for Melanoma Diagnosis in Dermoscopy Images”, IEEE Journal of Selected Topic in Signal Processing, Vol.3, No.1, Feb 2009
[2] J. S. Lin, K. S. Cheng and C. W. Mao, “A fuzzy Hopfield neural network for medical image segmentation,” IEEE Transactions on Nucl. Science 43, pp. 2389-2398, 1996.
[3] Wenle ZHANG “System Identification Based on
Generalized ADALINE Neural Network,” International Journal of Intelligent Control and Systems, Vol. 11, no. 1, pp.17-25, March 2006. [4] J. J. Hopfield, “Neural networks and physical
systems with emergent collective computational abilities,” in Proc. Nat. Acad. Sci., vol. 79, 1982, pp. 2554-2558.
[5] J. E. Steck and S. N. Balakrishnan, “Use of Hopfield neural networks in optimal guidance,” IEEE Trans. Aerosp. Electron. Syst, vol. 30, no.1, pp. 287-293, Jan. 1994 .
[6] A.M. Bensaid, L.O. Hall, J.C. Bezdek, L.P. Clarke, M.L. Silbiger, J.A. Arrington, and R.F. Murtagh. Validity-guided (Re) Clustering with applications to imige segmentation . IEEE Transactions on Fuzzy Systems, 4:112-123, 1996.
[7] Jzau-Seng Li, “Image vector quantization using an annealed Hopfield neural network,” Optical Engineering, 38 (4), pp. 599- 605, 1999.
[8] S. C. Amatur, D. Piriano and Y. Takefuji, “Optimization neural network for the segmentation of magnetic resonance images,” IEEE Transactions on Medical Imaging ,11, pp. 215-220, 1992.