R E S E A R C H A R T I C L E
Open Access
Validation of a newly automated
web-based 24-hour dietary recall using fully
controlled feeding studies
Jacynthe Lafrenière
1,2, Benoît Lamarche
1,2, Catherine Laramée
2, Julie Robitaille
1,2and Simone Lemieux
1,2*Abstract
Background:Assessment of food intake is a cornerstone of nutritional research. However, the use of minimally validated dietary assessment methods is common and can generate misleading results. Thus, there is a need for valid, precise and cost-effective dietary assessment tools to be used in large cohort studies.
The objective is to validate a newly developed automated self-administered web-based 24-h dietary recall (R24W), within a population of adults taking part in fully controlled feeding studies.
Methods:Sixty two adults completed the R24W twice while being fed by our research team. Actual intakes were precisely known, thereby allowing the analysis of the proportion of adequately self-reported items. Association between offered and reported portion sizes was assessed with correlation coefficients and agreement with the kappa score while systematics biases were illustrated with Bland-Altman Plot.
Results:Participants received an average of 16 food items per testing day. They reported 89.3% of the items they received. The more frequently omitted food categories were vegetables included in recipes (40.0%) as well as side vegetables (20.0%) and represented less than 5% of the actual daily energy intake. Offered and self-reported portion sizes were significantly correlated (r= 0.80P< 0.001) and demonstrated a strong agreement as assessed by the kappa score of 0.62. Reported portion sizes for individual food items were on average 3.2 g over the offered portion sizes. Portions of 100 g and above were on average underestimated by 2.4% (r= 0.68P< 0.01; kappa score = 0.50) while small portions (less than 100 g) were overestimated by 17.1% (r= 0.46P< 0.01; kappa score = 0.43). A nonsignificant underestimation (−13.9 kcal ± 646.3 kcal;P= 0.83) of energy intake was noted.
Conclusion:R24W performed well as participants were able to report the great majority of items they ate and selected portion size strongly related to the one they received. This suggests that food items are easily to find within the R24W and images of portion sizes used in this dietary assessment tool are adequate and can provide valid food intake evaluation.
Keywords:Food assessment, Dietary recall, Portion size estimation, Validation, Feeding studies
Background
High quality nutritional research hinges on valid assess-ment of food intake. However, it remains a real challenge to adequately measure food intake. Because of wide within subject variation, self-reported tools have some degree of random errors [1] often associated with incoherent research results [2]. Recent researches demonstrated that
those errors may be significantly reduced by improving data collection techniques and by selecting tools adapted to the studied population. Furthermore, it is essential to valid-ate a new dietary assessment tool before its first use [3].
Self-reported food assessment tools are often associ-ated with high rates of misreporting leading to under-estimation of energy and nutrient intakes compared to objective measurements [4]. Misreporting can be explained in part by undereating and in part by under-recording. Indeed, subjects tend to reduce or change their food intake when they have to report it. * Correspondence:[email protected]
1School of Nutrition, Laval University, Québec, Qc, Canada
2Institute of Nutrition and Functional Foods, Laval University, Québec, Qc,
Canada
This has been referred to as the reactivity bias [5]. In addition, studies have shown that subjects frequently fail to remember all the items they ate and they have trouble estimating the exact portion sizes consumed [6–8]. These errors could be attributed to memory or social desirability bias [4, 9].
Automated self-administered 24-h recalls received atten-tion lately and are increasingly used because there are convenient and cost-effective [10]. For cohort studies, auto-mated 24-h dietary recall is becoming the tool of choice instead of food frequency questionnaire because of its su-perior precision and accuracy [11, 12]. Furthermore, it pre-sents characteristics that can help reducing the above-mentioned biases. First, as participants generally filled their recalls on unannounced days, this limits the reactivity bias. Second, those recalls are completed by the respondent, out-side of a laboratory setting, thus in a neutral environment [13]. This reduces the social desirability bias as compared with a face to face administration of recalls [14, 15]. Third, the inclusion of memory cues in the recall can attenuate memory bias which can therefore contribute to reduce underreporting. For example, with an approach like the USDA automated multiple pass method, items are reviewed to make sure that nothing has been forgotten, context of the meal is accentuated because it helps to remember details about the food consumed and many questions are asked about frequently forgotten food items [16]. In addition, images of portion sizes can improve estimation accuracy by up to 60% [17, 18]. Finally, presen-tation of simultaneous different portion size options can reduce error rates compared to presentation of only one option [7].
Some studies have shown that, compared with the trad-itional interview, web-based 24-h recall generates equiva-lent results with a reduced precision for some nutrients [6, 19, 20]. However, the preference for the web-based version was highlighted by many researchers. Indeed, Thompson et al. [19], showed that using a web-based 24-h recall reduced attrition rate compared to interview admin-istered 24-h recall. Furthermore, with the web-based approach, the completion time is reduced and the coding step is automated thereby saving a significant amount of time [21]. The main concern remaining is the accessibil-ity as internet connexion is not yet equivalently spread causing an underrepresentation of older adults with lower incomes (in 2012, 28% of them had internet access compared with 95% of younger adults with higher incomes [22]).
It has to be emphasized that when a new dietary as-sessment tool is developed, a rigorous validation process needs to be performed before it can be used in cohort studies. One strategy that can be used when validating dietary assessment tools is to compare self-reported food intake to the actual food intake consumed in the context
of fully controlled feeding studies. In these projects intended to evaluate the effects of specific nutritional manipulation, participants receive all their meals for the duration of the study. The specific composition and weight of each food item consumed is therefore known and can be compared to the recall filled by the partici-pants afterwards.
The R24W is a newly developed web-based, self-administered and fully automated 24-h recall [23]. It is the first French-language web-based automated 24-h recall developed to assess dietary intake in the French-Canadian population. The aim of this study was to val-idate the R24W in a context of fully controlled feeding studies. More precisely, we wanted to evaluate ad-equate reporting of food items and portion size evalu-ation. We hypothesize that the majority of offered food items are adequately reported using the R24W. We also hypothesize that there is a portion size estimation error of less than 10%. Furthermore, as other authors reported that adults tend to underestimate large por-tion sizes compared with smaller ones [24, 25] we de-cided to test specifically error rate in small and larger portions and we hypothesize that, because of the large distribution of portion sizes illustrated in the R24W, the difference between them is not significant.
Methods
Participants
This analysis was conducted on 33 men and 29 women already enrolled in three fully controlled feeding studies currently conducted in our research institute. To be in-cluded in these studies, they had to be non-smoking men or women aged between 18 and 75 years old with stable weight. Women should not be pregnant or lactat-ing. Each participant had to be free from cardiovascular or endocrine diseases and should not have a food allergy or aversion to any food item offered in the feeding protocol. These studies received the approval of the La-val University Ethics Committee and participants pro-vided written informed consent prior to taking part in the study. The analysis performed in this article was dir-ectly presented in one of the three consent forms (the latest study) and was proposed to the participants already included in the two other studies in an adden-dum to their initial consent form. Therefore, all partici-pants gave their informed consent before completing their first 24-h recall knowing that it was part of a valid-ation process.
The automated web-based automated 24-h recall (R24W)
Details on how the R24W was developed have been pub-lished elsewhere [23]. Briefly, R24W was developed in French language and was inspired by the AMPM of the USDA [16]. However, as opposed to AMPM, R24W is using a meal-based approach in the first step. An unlim-ited number of meals or snacks per 24-h period can be added by the respondent. R24W allows automatic calcu-lation of different diet quality scores in addition to energy and nutrient intakes. The application was pro-grammed in such a way that the days for which the re-call has to be completed are randomly generated with the possibility of using specific criteria (e.g., proportion between weekdays and weekend days). For this valid-ation study, the same two days in each study were used for recalls. The application also allows the automatic sending of email messages to participants prompting them to complete their 24-h food recall. The database includes 2865 items linked to the Canadian Nutrient File (2010 version) or the USDA Nutrients Database for the few items that were not available the Canadian Nutrient File. Questions about the context of the meals are asked to help respondents to recall all the items consumed. There is also systematic questions about frequently forgot-ten food items. Portion sizes are represented by up to eight food pictures representing predetermined portion sizes in a fixed neutral set-up. Portion sizes are expressed in units and/or volume under each picture. Respondents also have the option to select a multiplicative or a fraction of each portion shown. The format has been designed to be intuitive. In a pre-test in a cohort of 29 adults with dif-ferent levels of computer skills, the R24W was found to be easy to understand and to complete [23].
Research context
Studies in which participants were initially involved had different feeding protocols. Most of these studies aimed at assessing the metabolic effects of some diets for which nutrient composition was manipulated. Menus were for-mulated using typical French Canadian food items. Meals were prepared and provided by the research team according to a 7-day cyclic menu for 4 to 8 weeks followed by 4 to 8 weeks of wash-out where subjects returned to their normal diet. The portion sizes of the different food items offered were individualized to ensure that all participants maintained a stable body weight while the exact diet composition was kept the same for each experimental condition in each study. Par-ticipants were not aware of the precise amount of food they received. They were instructed to eat all the food items provided every day and nothing else. Participants’ body weight was measured throughout each project to achieve isoenergetic conditions and energy intake was increased or decreased by 250 kcal/day if a subject lost
or gained greater than 1 kg and maintained that body weight for at least 3 days. In order to standardize the testing between studies, the R24W was completed in the first two weeks of one of the feeding phases for each project. Menus were composed of three meals and a snack per day. Except for a few exceptions, lunch (40% of daily calories) was consumed in the lab facility while din-ner, breakfast and snack were packed in a cooler and consumed outside the clinical facility. Items were all la-belled and participants received a checklist to remind them to eat the entire menu in order to enhance compli-ance (see Additional file 1). On this checklist, the general name of the meals and side dishes were given but the list of ingredients for mixed dishes was not included. This gave us the opportunity to assess how well participants managed to find the food items they consumed among the list of food available in the R24W with a reduced memory bias. Since no cues were provided on the check list about portion size of food items consumed, a memory bias could however influence how subjects were choosing the portion sizes when filling the R24W.
Validation strategy
In each study included in this protocol, the nutrient com-position of the meals were manipulated without the know-ledge of the participants. Therefore, it would not be the most appropriate study design to evaluate the accuracy of reported nutrient intakes. Instead, we decided to use a validation strategy in which we compared food items re-ported to food items actually offered. This was done by classifying reported food items as “matches”, “omissions” and “inclusions” as previously suggested [6]. A “perfect match”corresponded to a situation where subjects selected the exact appellation of the item they received in the R24W (e.g., boiled potatoes for boiled potatoes). A“close match” described the selection of an item with related characteris-tics (e.g., mashed potatoes instead of boiled potatoes). A
“far match”was used to classify an item in the same food categories but with different characteristics and nutritional composition (e.g., fried potatoes instead of boiled potatoes). An“omission”was used to define a food item that was pro-vided but not reported. Finally, an“intrusion”corresponded to a food item that was reported but not provided. For all items classified as matches (either perfect, close or far), offered and reported portion sizes were compared. Finally, only for indicative purposes, energy and macronutrient intakes as reported by participants who filled the R24W were compared with actual energy and macronutrient intakes as provided by the menu offered.
Statistical analyses
which categories of food items were more frequently omitted by participants. The impact of these omis-sions on energy intake assessment was then evaluated. To do so, we first classified the omitted items by cat-egories and then calculated the mean contribution to the daily energy intake of all the mentioned items in this category. More precisely, the energy content of each item was determined and then a weighted aver-age was calculated to represent the contribution of the category to the daily energy intake. As all menus were standardized, food items from a given food cat-egory had the same relative contribution to the total energy intake for all participants.
The difference between each reported and offered portion size was assessed (absolute number) and, in the present study, we refer to this difference as the bias which provides an indication of the systematic under-estimation (in case of a negative bias) or overunder-estimation (in case of a positive bias) in portion sizes. The differ-ence between reported and offered portion size was also characterized as the estimation error that is the ratio between the bias and the offered portion size (in percentage). A Student T-Test was used to compare mean portion size reported to mean portion size offered. Analysis were conducted on all data and also separately on the smaller portions (characterized as less than 100 g) and on the larger portions (charac-terized as 100 g and above). A Student T-test was performed to determine if a larger estimation error occurs in larger portion sizes compared to smaller portion sizes. To assess accuracy in portion size esti-mation, we used correlation coefficients, weighted kappa scores for classification in quartiles and the Bland-Altman plots. The Kappa score describes the agreement between two measures as poor (<0.00), slight (0.00–0.20), fair (0.21–0.40), moderate (0.41–0.60), substantial (0.61–0.80) and almost perfect (0.81–1.00) [26]. In order to investigate if individual characteristics could influence portion size es-timation, a stepwise linear regression model was tested with age, sex and BMI as predictive factors for estimation error.
In the controlled feeding trials, lunch was served on a plate and consumed at the research institute while dinner was provided in individual plastic con-tainers to be taken home. The extent to which meal presentation affected the accuracy of portion size es-timation with the R24W was also assessed using T-tests comparing estimation bias between meals. Finally, energy and macronutrient intakes reported were compared to values corresponding to the offered food items using a Stu-dent T-test. Correlation analyses were also performed be-tween reported and offered energy and nutrient intakes. Statistical analyses were conducted with the software SAS version 9.4 (SAS Institute).
Results
Characteristics of the participants are shown in Table 1. Data from 62 adults aged 21 to 71 years with body mass index from 21 to 52 kg/m2are included in the analyses.
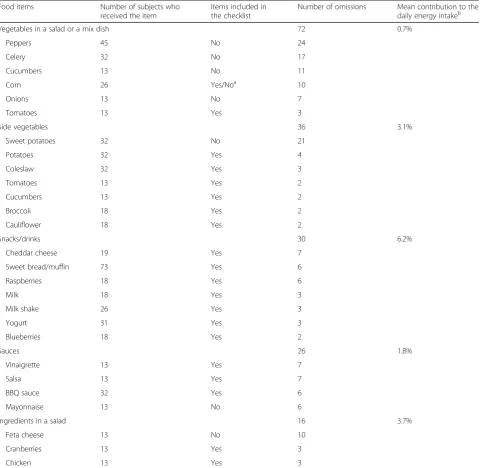
Participants received on average 16 different food items per day. The proportion of matches and omissions as well as the number of intrusions in participants’ responses to the R24W are presented in Table 2. A total of 89.3% of the offered food items were reported with the R24W and 76.8% were reported using the exact descriptor in the database. Descriptions of the main omissions are presented in Table 3. Omissions were clas-sified according to different food categories and the weighted average contribution of the category to the offered daily energy intake was calculated. Finally, Table 3 indicates whether the omitted food items were specifically named in the checklist that was provided to participants.
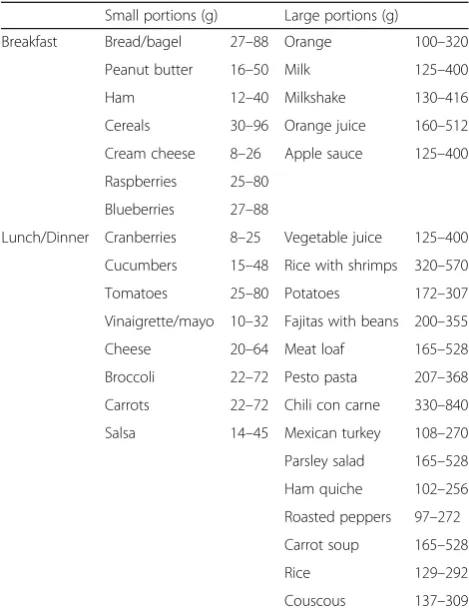
Table 4 presents examples of small and large portions offered at breakfast and at lunch/dinner meals. Most of the main dishes were offered in portions larger than
Table 1Characteristics of the participants (n= 62)
N(%) Sex
Men 33 (53.2%)
Women 29 (46.8%)
Mean BMI
Normal weight (18.5–24.9 kg/m2) 7 (11.3%)
Overweight (25.0–29.9 kg/m2) 25 (40.3%)
Obese (30 kg/m2and above) 30 (48.4%)
Mean age (y)
< 25 5 (8.1%)
25–50 30 (48.4%)
> 50 27 (43.5%)
Table 2Proportion of matches (exact, close and far) and omissions related to the amount of food items offered and number of intrusions for all subjectsa(
n= 62)
Proportion or number of items
Number of items offered/day (n) 16.1 ± 3.1
Exact matches (%) 76.8 ± 15.3
Close matches (%) 8.2 ± 8.7
Far matches (%) 4.3 ± 5.2
All matches combined (%) 89.3 ± 11.1
Omissions (%) 10.7 ± 11.1
Intrusions (n) 0.2 ± 0.7
a
100 g while side vegetables, fruits, sauces and spreads were mostly in portions smaller than 100 g.
Table 5 describes the agreement between reported and offered portion sizes (kappa score, correlation coefficient and estimation bias). Analyses were first conducted with all portions irrespective of their size and then with small and large portion sizes separately. When analysing all por-tions irrespective of their size, we found a small
nonsignificant (P= 0.12) systematic bias of 3.2 g (9.3% ±66.0%) meaning that R24W tends to slightly overesti-mate portion sizes. The correlation coefficient of 0.80 and the weighted kappa score of 0.62 suggest a substantial agreement between reported and offered portion sizes. Of-fered portions of less than 100 g (kappa score of 0.43) as well as portions larger than 100 g (kappa score of 0.50) showed a moderate agreement with their corresponding
Table 3Counts of the items most frequently omitted by participants in relation to offered items
Food items Number of subjects who
received the item
Items included in the checklist
Number of omissions Mean contribution to the daily energy intakeb
Vegetables in a salad or a mix dish 72 0.7%
Peppers 45 No 24
Celery 32 No 17
Cucumbers 13 No 11
Corn 26 Yes/Noa 10
Onions 13 No 7
Tomatoes 13 Yes 3
Side vegetables 36 3.1%
Sweet potatoes 32 No 21
Potatoes 32 Yes 4
Coleslaw 32 Yes 3
Tomatoes 13 Yes 2
Cucumbers 13 Yes 2
Broccoli 18 Yes 2
Cauliflower 18 Yes 2
Snacks/drinks 30 6.2%
Cheddar cheese 19 Yes 7
Sweet bread/muffin 73 Yes 6
Raspberries 18 Yes 6
Milk 18 Yes 3
Milk shake 26 Yes 3
Yogurt 31 Yes 3
Blueberries 18 Yes 2
Sauces 26 1.8%
Vinaigrette 13 Yes 7
Salsa 13 Yes 7
BBQ sauce 32 Yes 6
Mayonnaise 13 No 6
Ingredients in a salad 16 3.7%
Feta cheese 13 No 10
Cranberries 13 Yes 3
Chicken 13 Yes 3
a
Corn was offered in two different menus, one where it was written as an ingredient on the checklist (3 omissions/13 presentations) and one where it was not included on the checklist (7 omissions/13 presentations)
b
reported portion sizes. The estimation error was signifi-cantly larger for small (17.1% ±78.5%) than for large portions (−2.4% ±55.8%; P< 0.01).
Figures 1, 2 and 3 illustrate the Bland-Alman plots for differences between reported and offered portion sizes for all food items, and also for small portions and large portions separately. Because the exact
offered portions were known, these were used as the independent variables. The plots demonstrated accept-able agreement. The linear regression model showed that neither age, sex nor BMI were significantly pre-dicting the estimation error in this sample. Results showed that there was no significant difference in the estimation error between meals offered for lunch
(2.9 g ± 134.8 g) and meals offered for dinner
(−11.0 g ± 93.7 g), P= 0.29 (not shown).
Finally, comparisons between reported and offered energy and macronutrients are presented in Table 6. Signifi-cant correlations were observed (r= 0.38–0.64 P< 0.01) and reported energy and protein intakes were not statisti-cally different from the offered amounts. However, reported carbohydrate intakes were significantly lower while reported fat intakes were significantly higher than offered values.
Discussion
The objective of this study was to validate in terms of food items reporting and portion size evaluation a new web-based 24-h recall, the R24W, using the context of fully controlled feeding studies. We observed that the majority of the offered food items– close to 90%, were reported by the participants and that the mean differ-ence between offered and reported portion sizes was less than 10% (i.e., 9.3%), as we hypothesized. This slight dif-ference resulted in a non-significant 13.9 kcal underesti-mation of energy intake. However, contrary to our initial assumptions, we observed that portions smaller than 100 g were estimated at a greater error rate than those of 100 g and above.
Nutritional assessment errors can be attributed to par-ticipants’recall bias (reactivity, memory or social desirabil-ity bias) or to inherent characteristics of the tool (e.g., inadequate strategy for data collection or visual support). While it is difficult to distinguish them in a validation study conducted in the context of real life, fully controlled studies allow to minimize some participants’related bias. However, few studies have used controlled feeding studies to validate automated self-administered 24-h dietary recalls. Indeed, tools are generally compared to another self-reported tool or with biomarkers that provide precise information about only one nutrient at a time [13]. Kirkpatrick et al. conducted a similar study intended to validate the ASA24 [6], another web-based dietary recall, in a context where subjects were invited to eat in a re-search cafeteria setting and asked to report their intakes during a follow-up visit, the day after. They observed that the proportion of matches between food consumed in the lab facility and food reported was 80%, a value that is slightly lower than what we observed in our study (i.e., 89%). However, memory was more of a confounding
Table 4Examples of small and large portions of food items offereda
Small portions (g) Large portions (g)
Breakfast Bread/bagel 27–88 Orange 100–320
Peanut butter 16–50 Milk 125–400
Ham 12–40 Milkshake 130–416
Cereals 30–96 Orange juice 160–512
Cream cheese 8–26 Apple sauce 125–400
Raspberries 25–80
Blueberries 27–88
Lunch/Dinner Cranberries 8–25 Vegetable juice 125–400
Cucumbers 15–48 Rice with shrimps 320–570
Tomatoes 25–80 Potatoes 172–307
Vinaigrette/mayo 10–32 Fajitas with beans 200–355
Cheese 20–64 Meat loaf 165–528
Broccoli 22–72 Pesto pasta 207–368
Carrots 22–72 Chili con carne 330–840
Salsa 14–45 Mexican turkey 108–270
Parsley salad 165–528
Ham quiche 102–256
Roasted peppers 97–272
Carrot soup 165–528
Rice 129–292
Couscous 137–309
a
A range is presented as portions were individualized according to participants’energy needs varying from 1750 to 4500 kcal per day
Table 5Agreement between reported and offered portion sizes as determined by the Kappa scores for portion size classification in quartiles, correlation coefficients and estimation bias for all, small and large portions
Kappa score
Correlation coefficient (P)
Estimation bias (estimation error)a
All portions N= 1373
0.62 0.80* 3.2 g (9.2%)
Small portions (<100 g) N= 640
0.43 0.46* 7.6 g* (17.1%)
Large portions (≥100 g) N= 733
0.50 0.68* −0.6 g (−2.4%)
a
Estimation bias: the average of the difference between reported and offered portion size. Estimation error: the mean ratio between the bias and the offered portion size
factor in that study because subjects were exposed to the experimental meals for the first time and did not have any cues to help them remember their past intakes. This was not the case in our study since subjects might have received the same meals in the previous phase of their studies and because they had access to a checklist to help them remember to consume all food items.
Omitted items identified in the present study were differ-ent from those reported in previous studies. Underreport-ing of fat and carbohydrates with food records and 24-h recalls have been repeatedly demonstrated [5, 27]. This is supported by studies showing high-fat foods such as cakes, pastries, cookies and savoury snacks are more often under-reported than other food groups [28, 29]. However, it is im-portant to note that in the present study, the variety of snacks and desserts was limited as participants were im-posed a specific menu. Nevertheless, they received cakes and potato chips and those items were not among the most frequently omitted food items. Hebert et al. [9] suggested that underreporting is associated with social desirability, which may explain that typical unhealthy foods tend to be
underreported or omitted. In our study, this bias was limited because participants did not have to take responsi-bility for their food choices, which were predetermined as part of the experimental procedures. As suggested by others, the web interface may also contribute to redu-cing the social desirability bias compared with a human interviewer [14, 15] but our study was not designed to specifically address this issue.
The most frequently omitted items by our participants were vegetables included in recipes (72 omissions) as well as side vegetables (36 omissions). This is in accord-ance with the observations of Kirkpatrick et al. [6]. Some of these items were not extensively described in the checklist that was provided to the participant (87 items not described in the checklist/108 omissions in vegeta-bles included in meals and side vegetavegeta-bles), so a memory bias could in part explain these omissions. We can also suggest that for these omitted food items the checklist was misleading in a way, suggesting to the participant that some items were more important than others. For example the “Mexican tortillas” included peppers and
-400 -200 0 200 400 600 800
0 100 200 300 400 500 600 700 800 900
Differe
n
ce between
offere
d
and re
ported
po
rtio
n siz
es
(g
)
Offered portion sizes (g)
Fig. 1Bland Altman Plot of the comparison between offered and reported portion sizes for all portions. Bias = 3.2 g Limits of agreements (dotted line):−148.3 to 154.7 g R:−0.15P: <0.001
-100 0 100 200 300 400 500
0 20 40 60 80 100 120
Differe
n
ce between
offere
d
and re
ported
po
rtio
n siz
es
(g
)
Offered portion sizes (g)
onions even if it was not mentioned on the checklist (see Additional file 1). We calculated that the energy contribution of vegetables included in recipes and side vegetables was however minimal (i.e., less than 5% of the daily energy intake).
When analysing all food items, irrespective of the por-tion size, we noted a mean estimapor-tion bias of 3.2 g, which is close to the −3.7 g differences observed by Kirkpatrick et al. [6]. Williamson et al. [30] suggested that digital photos helped to accurately estimate portion sizes of food items. In the present study, participants tended to overestimate small portion sizes and to under-estimate larger portions. This observation has also been highlighted in a previous study by Nelson et al. [31]. However, our estimation error in large portion size was only −2.4% suggesting that we selected enough pictures of larger portion sizes [24].
Our results suggest that images used to illustrate the portion sizes in the R24W contribute to influencing ad-equately estimation of real intakes. It is of importance to remember that participants did not receive information about the size of the portion they ate. Moreover, they received their lunch meal in a plate similar to the one that appears on R24W portion size images while break-fast and dinner were served in plastic containers where items were often mixed, which can increase the difficulty
in assessing the portion sizes of each ingredient. How-ever, our results showed that there was no difference in portion size estimation that was noted between presen-tation formats. As meals are not always consumed in a plate in real life settings, it is of interest to assess portion sizes estimation in different contexts.
The observed overestimation of small portions de-serves attention. In fact, the estimation error was close to 20% and the correlation coefficient between offered and reported portion sizes was below 0.50 [32]. Al-though it was not a specific objective of the study due to the blind manipulation of some food items, the analysis comparing reported and offered energy seems to bring confidence that estimation errors are counterbalanced by omissions, or are of low importance in the estimation of energy intakes. Indeed, the items most frequently overestimated are the same as those most frequently omitted (vegetables, sauces and spread) and the overall energy intake as obtained from the R24W filled by par-ticipants is not significantly different from the energy content of the diet offered. However, some differences were found between reported and offered amounts of carbohydrate and fat. These differences can be ex-plained, at least partially by the fact that participants were unaware of the dietary manipulation of the meals they received. For example, in two out of three studies, -400
-200 0 200 400 600 800
100 200 300 400 500 600 700 800
Differe
n
ce between
offere
d
and re
ported
po
rtio
n siz
es
(g
)
Offered portion sizes (g)
Fig. 3Bland Altman Plot of the comparison between offered and reported portion sizes of 100 g and larger. Bias =−0.6 Limits of agreements (dotted line):−192.1 to 190.8 g R:−0.18P< 0.001
Table 6Comparison between reported and offered intakes for energy and macronutrients (n= 62) Reported intake Offered intake Difference between reported
and offered intakes
Correlation coefficient between reported and offered intakes
Energy (kcal) 2762.4 ± 781.1 2776.4 ± 603.8 −13.9 ± 646.3 0.59*
Proteins (g) 110.9 ± 39.2 110.0 ± 25.2 2.1 ± 26.3 0.60*
Carbohydrates (g) 340.9 ± 101.6 366.9 ± 75.9 −26.1 ± 79.0* 0.64*
Fat (g) 111.0 ± 32.0 102.8 ± 26.6 9.1 ± 38.0* 0.38*
they received a milkshake supplemented in fat to assess the metabolic effect of different types of oils. Mean-while, the proportion of fat in other recipes, like muf-fins was reduced for balancing the diet. These manipulations could explain some of the differences observed between reported and offered amounts of carbohydrate and fat.
Another limitation to consider is the burden associated with self-reporting food intake for many days. In the con-text of this study, participants were asked to fill the R24W twice on top of the initial research requirements. They were highly motivated and did not seem to significantly underreport. However, it will be a concern with wider and more diversified cohorts. Indeed, considering that at least 3 non-consecutive days of 24-h recall are needed to repre-sent typical intakes [33], the time commitment for partici-pants could impact their motivation. Nevertheless, the web-based format of the R24W seems to be an important asset. Based on a pre-test conducted during its develop-ment, 59% of responders completed the recall in less than 30 min [23]. In comparison, the food frequency question-naire used recently in our large cohort studies takes on average 45 min to complete [34]. Moreover, as the coding is automated, the web-based approaches lead to a consid-erable time saving for researchers.
Conclusions
To conclude, when controlling in part for some of the personal bias (memory, reactivity and social desirability), participants reported most of the items they ate with a good level of accuracy in portion sizes reported. This data also provides preliminary evidence supporting the validity of R24W to assess food intakes. Analyses in lar-ger cohorts of free living individuals including biomarker analysis would be completed soon. This will allow to val-idate dietary assessment with a larger variety of con-sumed food items. In the near future, the R24W could be used to assess the food intake in large-scale research projects and in nutrition practice.
Additional file
Additional file 1:Word document (.docx) Annexe 1: Checklist offered to the participant with their meals for each project. (DOCX 13 kb)
Abbreviations
BMI:Body mass index; R24W: Newly developed automated self-administered web-based 24-h dietary recall
Acknowledgements
Not applicable.
Funding
The present study was supported by a grant from the Canadian Institutes of Health Research (CIHR; grant no. FHG 129921).
Availability of data and materials
The datasets used and/or analyzed during the current study available from the corresponding author on reasonable request.
Authors’contributions
JL analyzed and interpreted most of the data and was actively involved in drafting the manuscript. BL, CL, JR and SL critically revised the manuscript and were major contributors to the revised version. JL, SL and CL made substantial contributions to the conception and design and the acquisition of data. All authors read and approved the final manuscript.
Competing interests
The authors declare that they have no competing interests.
Consent for publication
Not applicable.
Ethics approval and consent to participate
Data from three studies were included in this article. These studies received the approval of the Laval University Ethics Committee and participants provided written informed consent prior to taking part in the study. The analysis performs in this article was directly presented in one of the three consent forms (the latest study) and was proposed to the participants already included in the two other studies in an addendum to their initial consent form. Therefore, all participants gave their informed consent before completing their first 24-h recall knowing that it was part of a validation process (p.5 ln 1–8).
Publisher’s Note
Springer Nature remains neutral with regard to jurisdictional claims in published maps and institutional affiliations.
Received: 21 December 2016 Accepted: 1 April 2017
References
1. Beaton GH, Burema J, Ritenbaugh C. Errors in the interpretation of dietary assessments. Am J Clin Nutr. 1997;65(4):1100S–7.
2. Archer E, Hand GA, Blair SN. Validity of U.S. Nutritional surveillance: national health and nutrition examination survey caloric energy intake data, 1971– 2010. PLoS ONE. 2013;8(10):e76632.
3. Serra-Majem L, Frost Andersen L, Henríque-Sánchez P, Doreste-Alonso J, Sánchez-Villegas A, Ortiz-Andrelluchi A, et al. Evaluating the quality of dietary intake validation studies. Br J Nutr. 2009;102(Supplement S1):S3–9. 4. Hill RJ, Davies PSW. The validity of self-reported energy intake as
determined using the doubly labelled water technique. Br J Nutr. 2001; 85(4):415–30.
5. Goris AH, Westerterp-Plantenga MS, Westerterp KR. Undereating and underrecording of habitual food intake in obese men: selective underreporting of fat intake. Am J Clin Nutr. 2000;71(1):130–4. 6. Kirkpatrick SI, Subar AF, Douglass D, Zimmerman TP, Thompson FE, Kahle
LL, et al. Performance of the Automated Self-Administered 24-hour Recall relative to a measure of true intakes and to an interviewer-administered 24-h recall. Am J Clin Nutr. 2014;100(1):233–40.
7. Subar AF, Crafts J, Zimmerman TP, Wilson M, Mittl B, Islam NG, et al. Assessment of the accuracy of portion size reports using computer-based food photographs aids in the development of an automated self-administered 24-hour recall. J Am Diet Assoc. 2010;110(1):55–64. 8. Di Noia J, Contento IR. Criterion validity and user acceptability of a
CD-ROM-mediated food record for measuring fruit and vegetable consumption among black adolescents. Public Health Nutr. 2009;12(1):3–11.
9. Hebert JR, Ebbeling CB, Matthews CE, Hurley TG, MA Y, Druker S, et al. Systematic errors in middle-aged Women’s estimates of energy intake: comparing three self-report measures to total energy expenditure from doubly labeled water. Ann Epidemiol. 2002;12(8):577–86.
10. Illner A-K, Freisling H, Boeing H, Huybrechts I, Crispim SP, Slimani N. Review and evaluation of innovative technologies for measuring diet in nutritional epidemiology. Int J Epidemiol. 2012;41(4):1187–203.
12. Carroll RJ, Midthune D, Subar AF, Shumakovich M, Freedman LS, Thompson FE, et al. Taking advantage of the strengths of 2 different dietary assessment instruments to improve intake estimates for nutritional epidemiology. Am J Epidemiol. 2012;175(4):340–7.
13. Willett WC. Nutritional Epidemiology [Internet]. Oxford University Press; 1998 [cited 2016 Jan 26]. Available from: http://www.oxfordscholarship.com/view/ 10.1093/acprof:oso/9780195122978.001.0001/acprof-9780195122978 14. Tourangeau R, Rips LJ, Rasinski K. The psychology of survey response.
Cambridge: Cambridge University Press; 2000.
15. Kohlmeier L, Mendez M, McDuffie J, Miller M. Computer-assisted self-interviewing: a multimedia approach to dietary assessment. Am J Clin Nutr. 1997;65(4):1275S–81.
16. Moshfegh AJ, Rhodes DG, Baer DJ, Murayi T, Clemens JC, Rumpler WV, et al. The US department of agriculture automated multiple-pass method reduces bias in the collection of energy intakes. Am J Clin Nutr. 2008;88(2):324–32. 17. Byrd-Bredbenner C, Schwartz J. The effect of practical portion size
measurement aids on the accuracy of portion size estimates made by young adults. J Hum Nutr Diet. 2004;17(4):351–7.
18. Howat PM, Mohan R, Champagne C, Monlezun C, Wozniak P, Bray GA. Validity and reliability of reported dietary intake data. J Am Diet Assoc. 1994;94(2):169–73.
19. Thompson FE, Dixit-Joshi S, Potischman N, Dodd KW, Kirkpatrick SI, Kushi LH, et al. Comparison of interviewer-administered and automated self-administered 24-hour dietary recalls in 3 diverse integrated health systems. Am J Epidemiol. 2015;181(12):970–8.
20. Diep CS, Hingle M, Chen T-A, Dadabhoy HR, Beltran A, Baranowski J, et al. The automated self-administered 24-hour dietary recall for children, 2012 version, for youth aged 9 to 11 years: a validation study. J Acad Nutr Diet. 2015;115(10):1591–8.
21. Liu B, Young H, Crowe FL, Benson VS, Spencer EA, Key TJ, et al. Development and evaluation of the Oxford WebQ, a low-cost, web-based method for assessment of previous 24 h dietary intakes in large-scale prospective studies. Public Health Nutr. 2011;14(11):1998–2005. 22. Government of Canada SC. The Daily—Individual Internet use and
e-commerce, 2012 [Internet]. 2013 [cited 2017 Jan 23]. Available from: http://www.statcan.gc.ca/daily-quotidien/131028/dq131028a-eng.htm 23. Jacques S, Lemieux S, Lamarche B, Laramée C, Corneau L, Lapointe A, et al.
Development of a Web-based 24-h dietary recall for a French-Canadian population. Nutrients. 2016;8(11):724.
24. Harnack L, Steffen L, Arnett DK, Gao S, Luepker RV. Accuracy of estimation of large food portions. J Am Diet Assoc. 2004;104(5):804–6.
25. Nelson M, Atkinson M, Darbyshire S. Food Photography I: the perception of food portion size from photographs. Br J Nutr. 1994;72(5):649–63. 26. Landis JR, Koch GG. The measurement of observer agreement for
categorical data. Biometrics. 1977;33(1):159–74.
27. Heitmann BL, Lissner L, Osler M. Do we eat less fat, or just report so? Int J Obes Relat Metab Disord. 2000;24(4):435–42.
28. Vereecken CA, Covents M, Matthys C, Maes L. Young adolescents’nutrition assessment on computer (YANA-C). Eur J Clin Nutr. 2005;59(5):658–67. 29. Lafay L, Mennen L, Basdevant A, Charles MA, Borys JM, Eschwège E, et al.
Does energy intake underreporting involve all kinds of food or only specific food items? Results from the Fleurbaix Laventie Ville Santé (FLVS) study. Int J Obes Relat Metab Disord. 2000;24(11):1500–7.
30. Williamson DA, Allen HR, Martin PD, Alfonso AJ, Gerald B, Hunt A. Comparison of digital photography to weighed and visual estimation of portion sizes. J Am Diet Assoc. 2003;103(9):1139–45.
31. Nelson M, Atkinson M, Darbyshire S. Food photography II: use of food photographs for estimating portion size and the nutrient content of meals. Br J Nutr. 1996;76(1):31–49.
32. Masson L, MCNeill G, Tomany J, Simpson J, Peace H, Wei L, et al. Statistical approaches for assessing the relative validity of a food-frequency questionnaire: use of correlation coefficients and the kappa statistic. Public Health Nutr. 2003;6(3):313–21.
33. Stote KS, Radecki SV, Moshfegh AJ, Ingwersen LA, Baer DJ. The number of 24 h dietary recalls using the US Department of Agriculture’s automated multiple-pass method required to estimate nutrient intake in overweight and obese adults. Public Health Nutr. 2011;14(10):1736–42.
34. Labonté M-È, Cyr A, Baril-Gravel L, Royer M-M, Lamarche B. Validity and reproducibility of a web-based, self-administered food frequency questionnaire. Eur J Clin Nutr. 2012;66(2):166–73.
• We accept pre-submission inquiries
• Our selector tool helps you to find the most relevant journal • We provide round the clock customer support
• Convenient online submission • Thorough peer review
• Inclusion in PubMed and all major indexing services • Maximum visibility for your research
Submit your manuscript at www.biomedcentral.com/submit