S O F T W A R E
Open Access
Wormpath: searching for molecular interaction
networks in
Caenorhabditis elegans
Peter Frommolt
1,2,3*and Björn Schumacher
1,3,4,5Abstract
Background:High-throughput transcriptional profiling using Next-Generation Sequencing (RNA-Seq) or microarray technology have become standard tools in molecular biology. Successful investigations of gene regulatory
mechanisms from these data typically employ mathematical models of biological networks.
Results:We have developedWormpath, a software for molecular network discovery which operates on the genetic and physical interaction data of the Wormbase, a comprehensive resource of molecular data onCaenorhabditis elegans. We use Wormpath to show that the insulin/insulin-like growth factor signalling (IIS) pathway responds to UV-induced DNA damage during development.
Conclusions:Our software provides highly facilitated access toC. elegansinteraction data and is capable of identifying essential molecular networks within a list of differentially expressed genes.
Keywords:Molecular interaction networks, Gene expression, Wormbase, Web application
Background
Genome-wide expression profiling is achieved by high-throughput sequencing (RNA-Seq) or by expression microarrays. An initial analysis of the resulting data is typically achieved by sorting the entirety of all genes by statistical evidence for differential expression compared to a control condition. For downstream analysis, statis-tics about the functional properties enriched in a set of differentially expressed genes are needed as well as infor-mation on mutual dependencies between genes or larger molecular networks. The nematode wormCaenorhabditis elegansis a widely used model organism in developmental biology and genetics [1] and subject to multiple studies based on high-throughput gene expression data (e.g. [2]). In this paper, we describeWormpath, a software enabling the discovery of complex networks among a set of differ-entially expressed genes which is specifically optimized for use inC. elegansstudies. Recently, we used Wormpath as part of a larger study on the DNA damage response [3].
Since its inception in 1998, the Wormbase [4] has emerged as a widely used repository for genomic
in-formation onC. elegansand other nematodes, including comprehensive knowledge on previously reported mo-lecular interactions. These data comprise genetic as well as physical interactions and are based on a large variety of experimental methods such as yeast one-, two-, and three-hybrid assays as well as RNAi in mutant back-grounds. The interactions are both manually and automa-tically curated with an emphasis on including large-scale data sets [5]. Wormpath takes advantage of this resource to search for networks between members of a user-provided list of differentially expressed genes. For any of these networks, the software reports statistical measures, graphical plots and functional annotation by GO terms.
Other tools for molecular network discovery from high-throughput data include Cytoscape [6] or web-based software like the Pathway Projector [7]– a selec-tion of related tools was reviewed by Thomas and Bonchev [8]. As the aforementioned software programs, Wormpath is freely available but, in contrast to the others, it is specifically tailored for analyses inC. elegans and closely interacts with the comprehensive knowledge in the Wormbase. By adopting our software, researchers from the worm field can now use extensive information on molecular interactions of C. elegans without ad-ditional efforts like local software installation or database maintenance.
* Correspondence:[email protected]
1CECAD Research Center, University of Cologne, Joseph-Stelzmann-Str. 26, 50931 Cologne, Germany
2Cologne Center for Genomics, University of Cologne, Cologne, Germany Full list of author information is available at the end of the article
Implementation
Our software ignores interactions which are only com-putationally predicted, e.g. from orthologous interac-tions, but not experimentally confirmed in C. elegans. Furthermore, we call anindirectinteraction a pair of in-teractions that connect two nodes representing genes from the list of differentially expressed genes to an ad-ditional node that acts as alinker genewhich is not diffe-rentially expressed. This reflects the fact that a key gene might have been missed, for instance due to technical reasons. Given a list L of differentially expressed genes, our approach relies on a large basic graph G= (V, E) with a setVof vertices and a setEof edges, representing the topology of the network between members of L. Genes are represented by nodes in V and interactions between genes or their proteins are represented by edges inElabeled as eitherdirectorindirect.
Searching the graphGfor networks is closely related to the problem of finding theconnected componentsofG de-fined as all connected subgraphs which are not subgraphs of any larger connected graph, where a graph is called connectedif each pair of its nodes is connected by a path. Searching the connected components is a classical prob-lem for which a typical solution is formed e.g., by a depth-first search algorithm [9]. Members of larger candidate gene sets often form highly interconnected networks be-cause it is likely that many of them are players in the same biological processes. Thus, the connected components of the basic graph easily become very large themselves. To avoid this, our approach is controlled by an iteration depthDdefining the number of allowed steps from a start node. The software localizes the first gene ofL onGand searches alld-neighbours, i.e. all nodes that are reachable in at mostd∈{1,…,D} steps from that position, with both direct and indirectinteractions taken into account. After replacing the indirect interactions by the two respective interactions plus a new node for the linker gene, the soft-ware builds a new graph N= (VN, EN) composed of only
thed-neighbours and the edges between them. This pro-cedure is repeated with the remaining genes of the list. Statistical significance of the networks is assessed and the results are sorted according to their network scores (see below). The algorithm is then repeated withDreplaced by D-1, …, 1 to generate additional networks which are of smaller complexity.
To assess the statistical features of a networkN in the results list, N is assigned a score defined as the average number of citations supporting its edges, providing a measure of the strength of experimental evidence forN. To test whether this network score is larger than ex-pected by chance alone, the score is re-calculated for a given number of randomly simulated networks and a p-value is calculated as the fraction of those simulated scores which are at least as large as the original score.
Furthermore, the induced sub-networkcomposed of all 1-neighbours of N is given by N1= {(v, e) ∈ G | v ∈ V;
∃ ṽ∈VN:d(v,ṽ) = 1}. We consider the null hypothesis H0
that the proportion of genes that are elements of N1 is equal inLand in the entirety of allC. elegansgenes. IfH0
can be rejected, we conclude that the members ofN1are significantly over-represented in Land the presence ofN
inLis unlikely to have occurred by chance alone.
If the database contains a total number ofNgenes, the numberX of members ofN1contained in L is a hyper-geometrically distributed random variable with para-meters N, |N1|, and |L| and therefore has got the probability density function fXwith
fXð Þk :¼P Xð ¼xÞ ¼
N−N1
L j j−k
N1 k
N
L j j
From this, the p-value for N can be calculated by p¼Xn~
k¼kf
X k~ . If this p-value is sufficiently small, H
0
can be rejected at the predefined significance level. Our approach to statistical assessment of the networks resulting from a Wormpath analysis covers two distinct scientific aspects. The network score and its correspond-ing score-based p-value provide a measure of the strength of experimental evidence for the interactions involved in the network. On the other hand, the result from the second significance test termed the list-based p-value tells us to what extent differentially expressed genes are over-represented in the network compared to the entire genome. In some cases, these two approaches can lead to opposite results for the same network (see Results and Discussion); however, their combined infor-mation draws a broader picture of the statistical features of the respective molecular network than one of them alone.
The Wormpath software itself has been implemented using Perl/CGI and takes advantage of GraphViz [10] to layout the networks and generate the graphical output. Users can browse their results online or save a com-pressed version of the output to their local computer. The computation is based on a local database synchro-nized with the Wormbase using the AcePerl API. The source code of Wormpath as of version 1.0.4 is provided as a supplement to this manuscript (Additional file 1).
Results and discussion
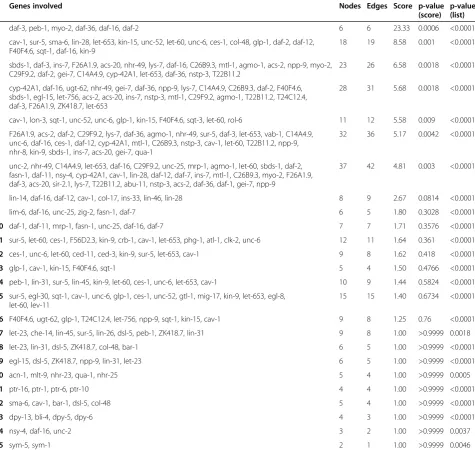
C. elegans L1 larvae after 6 h under UV irradiation at 60 mJ/cm−2 resulted in a list of 1349 differentially expressed genes (p< 0.01; fold change > ±1.5; Additional file 2: Table S1, online). Using iteration depth D= 1, Wormpath identifies a list of 25 molecular interaction networks significantly enriched among this set of genes (p< 0.01; Table 1). The p-values based on the network score and those based on the test for enrichment of dif-ferentially expressed genes represent two different statis-tical aspects of the resulting networks and the results for the two methods are opposite for some of them (Table 1). The IIS genesdaf-16/FoxOand daf-2/Igf1 are part of 10 (daf-16) and 4 (daf-2) out of these 25 networks, indicat-ing that they play a central regulatory role among the
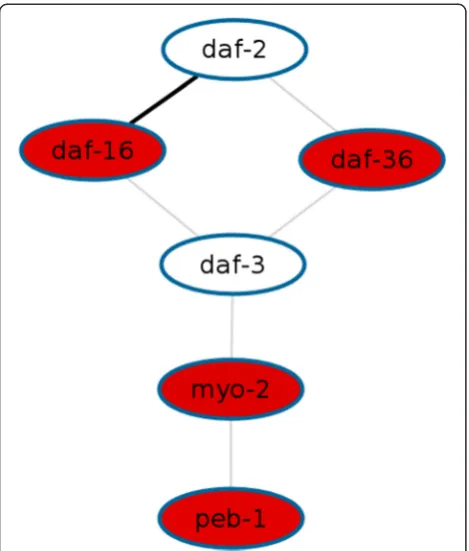
genes altered upon UV irradiation during development. The highest-scoring network (score 23.33; p< 0.0001) comprises both daf-16 and daf-2 (Figure 1). Wormpath links this network to a DAVID [11] analysis which re-veals that dauer larval development is among the GO terms enriched for the genes involved, indicating that they do in fact respond to DNA damage.
Although daf-2, the C. elegans orthologue of the hu-man insulin-like growth factor 1 (Igf1) receptor, is not differentially expressed upon UV irradiation, the soft-ware recognizes thatdaf-16 as well asdaf-2 are central players. This illustrates the effectiveness of using linker genes as in our approach. Regarding the statistical eva-luation, the largest network scores are achieved by
Table 1 Networks identified in a Wormpath analysis of 1349 genes regulated upon UV radiation
Genes involved Nodes Edges Score p-value
(score)
p-value (list)
1 daf-3, peb-1, myo-2, daf-36, daf-16, daf-2 6 6 23.33 0.0006 <0.0001
2 cav-1, sur-5, sma-6, lin-28, let-653, kin-15, unc-52, let-60, unc-6, ces-1, col-48, glp-1, daf-2, daf-12, F40F4.6, sqt-1, daf-16, kin-9
18 19 8.58 0.001 <0.0001
3 sbds-1, daf-3, ins-7, F26A1.9, acs-20, nhr-49, lys-7, daf-16, C26B9.3, mtl-1, agmo-1, acs-2, npp-9, myo-2, C29F9.2, daf-2, gei-7, C14A4.9, cyp-42A1, let-653, daf-36, nstp-3, T22B11.2
23 26 6.58 0.0018 <0.0001
4 cyp-42A1, daf-16, ugt-62, nhr-49, gei-7, daf-36, npp-9, lys-7, C14A4.9, C26B9.3, daf-2, F40F4.6, sbds-1, egl-15, let-756, acs-2, acs-20, ins-7, nstp-3, mtl-1, C29F9.2, agmo-1, T22B11.2, T24C12.4, daf-3, F26A1.9, ZK418.7, let-653
28 31 5.68 0.0018 <0.0001
5 cav-1, lon-3, sqt-1, unc-52, unc-6, glp-1, kin-15, F40F4.6, sqt-3, let-60, rol-6 11 12 5.58 0.009 <0.0001
6 F26A1.9, acs-2, daf-2, C29F9.2, lys-7, daf-36, agmo-1, nhr-49, sur-5, daf-3, let-653, vab-1, C14A4.9, unc-6, daf-16, ces-1, daf-12, cyp-42A1, mtl-1, C26B9.3, nstp-3, cav-1, let-60, T22B11.2, npp-9, nhr-8, kin-9, sbds-1, ins-7, acs-20, gei-7, qua-1
32 36 5.17 0.0042 <0.0001
7 unc-2, nhr-49, C14A4.9, let-653, daf-16, C29F9.2, unc-25, mrp-1, agmo-1, let-60, sbds-1, daf-2, fasn-1, daf-11, nsy-4, cyp-42A1, cav-1, lin-28, daf-12, daf-7, ins-7, mtl-1, C26B9.3, myo-2, F26A1.9, daf-3, acs-20, sir-2.1, lys-7, T22B11.2, abu-11, nstp-3, acs-2, daf-36, daf-1, gei-7, npp-9
37 42 4.81 0.003 <0.0001
8 lin-14, daf-16, daf-12, cav-1, col-17, ins-33, lin-46, lin-28 8 9 2.67 0.0814 <0.0001
9 lim-6, daf-16, unc-25, zig-2, fasn-1, daf-7 6 5 1.80 0.3028 <0.0001
10 daf-1, daf-11, mrp-1, fasn-1, unc-25, daf-16, daf-7 7 7 1.71 0.3576 <0.0001
11 sur-5, let-60, ces-1, F56D2.3, kin-9, crb-1, cav-1, let-653, phg-1, atl-1, clk-2, unc-6 12 11 1.64 0.361 <0.0001
12 ces-1, unc-6, let-60, ced-11, ced-3, kin-9, sur-5, let-653, cav-1 9 8 1.62 0.418 <0.0001
13 glp-1, cav-1, kin-15, F40F4.6, sqt-1 5 4 1.50 0.4766 <0.0001
14 peb-1, lin-31, sur-5, lin-45, kin-9, let-60, ces-1, unc-6, let-653, cav-1 10 9 1.44 0.5824 <0.0001
15 sur-5, egl-30, sqt-1, cav-1, unc-6, glp-1, ces-1, unc-52, gtl-1, mig-17, kin-9, let-653, egl-8, let-60, lev-11
15 15 1.40 0.6734 <0.0001
16 F40F4.6, ugt-62, glp-1, T24C12.4, let-756, npp-9, sqt-1, kin-15, cav-1 9 8 1.25 0.76 <0.0001
17 let-23, che-14, lin-45, sur-5, lin-26, dsl-5, peb-1, ZK418.7, lin-31 9 8 1.00 >0.9999 0.0018
18 let-23, lin-31, dsl-5, ZK418.7, col-48, bar-1 6 5 1.00 >0.9999 <0.0001
19 egl-15, dsl-5, ZK418.7, npp-9, lin-31, let-23 6 5 1.00 >0.9999 <0.0001
20 acn-1, mlt-9, nhr-23, qua-1, nhr-25 5 4 1.00 >0.9999 0.0005
21 ptr-16, ptr-1, ptr-6, ptr-10 4 4 1.00 >0.9999 <0.0001
22 sma-6, cav-1, bar-1, dsl-5, col-48 5 4 1.00 >0.9999 <0.0001
23 dpy-13, bli-4, dpy-5, dpy-6 4 3 1.00 >0.9999 <0.0001
24 nsy-4, daf-16, unc-2 3 2 1.00 >0.9999 0.0037
networks with strong experimental evidence for their in-teractions. In our analysis of the 1349 UV-responsive genes, the network score is therefore maximized by the smallest network among those which contain the daf-16/daf-2interaction given that the negative regulation of daf-16 activity downstream of daf-2has been described
multiple times in the literature. In our recent study [3], however, we have reported the network with the largest number of interactions as this gives the most compre-hensive selection of candidate genes related to the IIS pathway. In contrast, the network score defined in this paper is rather useful to assess the strength of scientific evidence for a particular network.
A summary of the features of Wormpath compared to those of other tools is given in Table 2. Among the soft-wares listed, Wormpath is the only one that is easily accessible to benchside biologists and can be used to systematically search a list of candidate genes for mo-lecular networks inC. elegans. For instance, the usage of Cytoscape requires at least basic knowledge on the structure and sources of the interaction database that is used and mapping your own data to the resulting net-work requires deeper software skills. Also, Cytoscape itself does not provide any functionality to extract or sta-tistically evaluate existing sub-networks. The Pathway Projector, on the other hand, can use candidate genes identified from experimental data only to highlight them on existing KEGG pathways in C. elegans, whereas a systematic search and assessment of networks within the candidate genes is not provided. Finally, Ingenuity Pathway Analysis is a very powerful software with a comprehensive back-end database, but it is subject to commercial licensing and supports the analysis of net-works in C. elegansdata only by homology mapping. In contrast to these softwares, Wormpath greatly facilitates access to the Wormbase interaction database and uses this rich resource to build molecular networks from a list of candidate genes uploaded by the user. In addition, the software is available free of charge and the design of its interface is very intuitive and easy to use.
Among the goals of Wormpath’s future development is the application of its methodology also to data from other model organisms such asDrosophila melanogaster (fruit fly) andSaccharomyces cerevisiae(yeast). Further-more, the interaction database used by the software will be enriched with interaction data from other sources including ChIP-Seq data from the modENCODE project Figure 1Top-scoring network among genes altered by UV
radiation.In an analysis of a set of 1349 genes differentially expressed upon UV radiation, Wormpath revealed 25 significantly enriched networks. The network shown exhibits the strongest statistical evidence among all results (score 23.33;p< 0.0001). Red nodes represent induced genes whereas white nodes represent unchanged genes. Any edge denotes an interaction between the two genes, where a grey line indicates that the interaction has been described in only one publication and the bold line betweendaf-16 anddaf-2indicates that this interaction has been described multiple times in the literature (135 papers).
Table 2 Features of Wormpath compared to other softwares
Wormpath Cytoscape Pathway projector Ingenuity pathway analysis
Species C. elegans Generic Multiple Human/Mouse/Rat
Implementation Web application/Perl, CGI Desktop application/Java Web application/Google Maps API Web application/Java
Database Wormbase Generic KEGG Undisclosed
Scope of analyses Networks/Functional annotation
Networks/Multiple add-ons Search details on pathways/ Map experimental data
Networks/Functional annotation
Target audience Bench scientists Computational biologists Bench scientists Bench scientists
Statistics Scores, significance tests Add-ons required None Scores, significance tests
[12] and miRNA target gene prediction algorithms (reviewed by [13]).
Conclusions
We have shown that the Wormpath software is generally suitable for the discovery of networks composed of pre-viously described molecular interactions of the worm. Our software facilitates downstream analysis of experi-ments based on high-throughput transcriptional pro-filing and enables an easy approach to network biology inC. elegans.
Availability and requirements Project name:Wormpath
Project home page:http://bifacility.uni-koeln.de/wormpath
Operating system: Browser-accessible web service, platform-independent
Programming language:Perl/CGI
Other requirements:None
License:GPL version 3
Restrictions to use by non-academics:The software is accessible without any restrictions.
Additional files
Additional file 1:Source code of the Wormpath software as of version 1.0.4 (February 2015).
Additional file 2: Table S1.List of 1349 genes differentially expressed upon UV radiation. The file is suitable as an input file for the Wormpath software.
Abbreviations
RNA-Seq:RNA sequencing; UV: Ultra violet; IIS: Insulin/insulin-like signaling; CGI: Common gateway interface; GO: Gene ontology.
Competing interests
The authors declare that they have no competing interests.
Authors’contributions
PF and BS developed the software and wrote the manuscript. Both authors read and approved the final manuscript.
Acknowledgements
PF acknowledges financial support from the Deutsche Forschungsgemeinschaft (CancerSysDB FR3313/2-1), the Bundesministerium für Wirtschaft und Energie (Transcriptalyzer KF2429610MS2) and the Bundesministerium für Bildung und Forschung (NGSgoesHPC 01IH11003A). BS received funding from the Deutsche Forschungsgemeinschaft (CECAD, SFB 829, SFB 670 and KFO 286), the European Research Council (ERC Starting Grant 260383), Marie Curie (FP7 ITN CodeAge 316354, aDDRess 316390, MARRIAGE 316964 and ERG 239330), the German-Israeli Foundation (1104–68.11/2010), the Deutsche Krebshilfe (109453) and the Bundesministerium für Bildung und Forschung (SyBACol 0315893A-B).
Author details
1CECAD Research Center, University of Cologne, Joseph-Stelzmann-Str. 26, 50931 Cologne, Germany.2Cologne Center for Genomics, University of Cologne, Cologne, Germany.3Systems Biology of Aging Cologne (SyBACol), University of Cologne, Cologne, Germany.4Institute for Genome Stability in Aging and Disease, Medical Faculty, University of Cologne, Cologne, Germany.5Center for Molecular Medicine Cologne (CMMC), University of Cologne, Cologne, Germany.
Received: 8 January 2015 Accepted: 12 March 2015
References
1. Brenner S. The genetics of Caenorhabditis elegans. Genetics. 1974;77(1):71–94. 2. Spencer WC, Zeller G, Watson JD, Henz SR, Watkins KL, McWhirter RD, et al. A spatial and temporal map of C. elegans gene expression. Genome Res. 2011;21(2):325–41.
3. Müller MM, Castells-Roca L, Babu V, Ermolaeva M, Müller RU, Frommolt P, et al. DAF-16/FoxO and EGL-27/GATA promote developmental growth in response to persistent somatic DNA damage. Nat Cell Biol. 2014;16(12):1168–79. 4. Stein L, Sternberg P, Durbin R, Thierry-Mieg J, Spieth J. Wormbase: network
access to the genome and biology of Caenorhabditis elegans. Nucleic Acids Res. 2001;29(1):82–6.
5. Rogers A, Antoshechkin I, Bieri T, Blasiar D, Bastiani C, Canaran P, et al. WormBase 2007. Nucleic Acids Res. 2008;36(database issue):D612–7. 6. Shannon P, Markiel A, Ozier O, Baliga NS, Wang JT, Ramage D, et al.
Cytoscape: a software environment for integrated models of biomolecular interaction networks. Genome Res. 2003;13(11):2498–504.
7. Kono N, Arakawa K, Ogawa R, Kido N, Oshita K, Ikegami K, et al. Pathway projector: web-based zoomable pathway browser using KEGG atlas and Google Maps API. PLoS One. 2009;4(11):e7710.
8. Thomas S, Bonchev D. A survey of current software for network analysis in molecular biology. Hum Genomics. 2010;4(5):353–60.
9. Hopcroft J, Tarjan R. Efficient algorithms for graph manipulation. Comm ACM. 1973;16(6):372–8.
10. Gansner ER, North SC. An open graph visualization system and its applications to software engineering. Software Pract Exper. 2000;30(11):1203–33. 11. Huang DW, Sherman BT, Tan Q, Collins JR, Alvord WG, Roayaei J, et al. The
DAVID gene function classification tool: a novel biological module-centric algorithm to functionally analyze large gene lists. Genome Biol. 2007;8(9):R183. 12. Celniker SE, Dillon LA, Gerstein MB, Gunsalus KC, Henikoff S, Karpen GH,
et al. Unlocking the secrets of the genome. Nature. 2009;459(7249):927–30. 13. Oulas A, Karathanasis N, Louloupi A, Pavlopoulos GA, Poirazi P, Kalantidis K,
et al. Prediction of miRNA targets. Methods Mol Biol. 2015;1269:207–29.
Submit your next manuscript to BioMed Central and take full advantage of:
• Convenient online submission
• Thorough peer review
• No space constraints or color figure charges
• Immediate publication on acceptance
• Inclusion in PubMed, CAS, Scopus and Google Scholar
• Research which is freely available for redistribution