Volume 1, Issue 2, October 2012
Page 104
A
BSTRACTThere was geometric distortion in MODIS remote sensing images. For the problem the geometric correction method was used based on ENVI that the each pixel in the remote sensing image of MODIS was loaded the information of latitude and longitude. The developed intelligent software by Multimedia ToolBook was for estimating the physical parameters of oceanic internal waves from the geometric corrected MODIS remote sensing images. The coordinate values of feature points in oceanic internal wave peaks could be show in the data fields in the intelligent software. There were many creative methods were used, such as linear fitting with least squares method, intelligent statistics method, simulation showing method. The parameters in the propagation directions of oceanic internal wave, wave-packet spacing and the maximum length of wave crest were calculated rapidly by the intelligent software. The result shown that the method was better than that of the non-corrected MODIS remote sensing images.
Keywords: intelligent software; remote sensing image; MODIS; Multimedia ToolBook
1.
I
NTRODUCTIONThe oceanic internal waves have extremely destructive potential [1-4]. The oceanic internal waves are caused by 3 causes. The first one is the gravity of the moon and the sun for seawater on the sea surface. The second one is the role of atmospheric wind. The third one is the ocean sports such as ships or submarines in the ocean. The wave theory of the interface between two fluids was researched by Stokes in 1847. The internal wave theory of the continuous layer fluid was studied by Rayleigh in 1883. The KdV theory was created by Korteng and Devries in 1895. In 1904, Ekman’s drift theory had explained the phenomenon of the "stagnant water" energy consumption. The spectrum models of GM72, GM75, and GM79 proposed by Garrett and Munk were universal application in the world's oceans. At present, the method of remote sensing image was a very important method and was a direct method [3-4] for researching the oceanic internal waves, Jiang, et al. [5, 6] studied the intelligent system for extracting the physical parameters of oceanic internal waves based on MODIS. There was the distortion in imaging process of the satellite carrying sensor and the accuracy of the extracted oceanic internal waves was affected. Fortunately, the each pixel in the MODIS remote sensing image loaded the information of latitude and longitude. It was more meaningful for estimation the physical parameters of oceanic internal waves based on MODIS by the developed intelligent software after the remote sensing image was geometric corrected with ENVI system.
2.
G
EOMETRIC CORRECTION2.1 Viewing of the MODIS remote sensing image
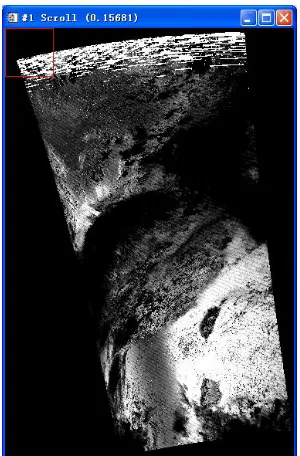
It went the ENVI system and the opened MODIS remote sensing image [5] was shown as figure 1. There were two points could be researched.
The first one was that the information provided by the horizontal periodic stripes at the left up image of figure 1. The resolution of the remote sensing image was 250m and the width of each pixel was 250m in earth surface. There were 40 pixels between the two adjacent horizontal stripes and the distance was 10km.
The second one was that the “leaf stalk” of the south of Taiwan Island was at the top and the remote sensing image was needed geometric correction because there was distortion when the MODIS sensor was imaging.
2.2 Geometric correction
The dialog box of “MODIS Input File” was opened in accordance with “Map / Georeference MODIS IB” for the whole remote sensing image at the right in figure 1. The item of “(5416×16760×2): Earth View 250M Reflective Solar Bands
A Method of the Parameter Estimation for the
Oceanic Internal Wave Based on the Developed
Intelligent Software
JIANG Xingfang 1, CHEN Fangfang 2 , JIANG Zhongyi 3 and BI Tianyu 4
1,2,3,4
Volume 1, Issue 2, October 2012
Page 105
uncertainty Indexes: Band 1” was selected in the column of “Select by”. Then the button of “OK” was clicked. The item “Geographic Lat/Lon” was selected in the pop-up dialog box of “Georeference MODIS Parameter”. The button of “Choose” was clicked at the column “Enter out put GCP Filename [.pts]” and the filename of “mos_20080701053_r” was entered.The geometric corrected remote sensing image “mos_ 200807010533_r1”was shown in figure 2.
Figure 1 The MODIS remote sensing image opened in ENVI system
Figure 2 The geometric corrected image
3.
M
AKING OF THE INTELLIGENT SOFTWAREVolume 1, Issue 2, October 2012
Page 106
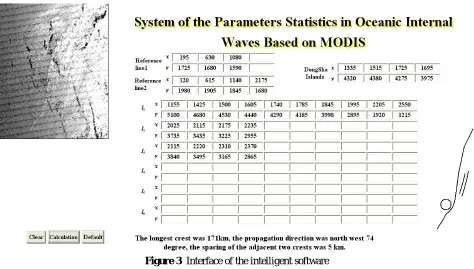
3.1 Interface designThe interface design was shown in figure 3. The interface design was designed the position of remote sensing image, data fields, reproduced figures, and the calculation result. The image whose filename was “moa_
200807010533_r3.bmp” was set at left-up in the interface and a red feature point was set at the top layer. The title of “System of the Parameters Statistics in Oceanic Internal Waves Based on MODIS” was designed at the top of the right-up in the interface.
Figure 3 Interface of the intelligent software
The data fields were set in the center of the right in the interface. The data fields included for the feature points of reference lines, Dongsha Atoll, and the crests of oceanic internal waves. The three buttons were at the left-below of the interface. The names of the three buttons were “Clear”, “Calculation”, and “Default” for clearing all data, calculation the results, and entering the default values in the data fields, respectively.
The prompting field was set at the below and it was shown the operation information for users. The finally results was shown in the prompting field.
There were the data fields for two reference lines and each reference line was allowed 4 feature points. Each feature point had x and y coordinate value. Because the Dongsha Atoll was near circle and its diameter was about 40km [7]. There were 3 feature points at last for deciding a circle. The edge of the Dongsha Atoll was decided was allowed 4 feature points.
The number of the oceanic internal wave crests in a group was less than 6. There were the data fields for the oceanic internal wave crests were allowed 6 crests. Each crest was allowed 10 feature points.
3.2 Moving the feature point and showing its coordinate values
The red feature point was dragged at the feature position of remote sensing image by user in the reader status of Multimedia ToolBook. The remote sensing image was geometric corrected MODIS remote sensing image. When the mouse was entered and clicked a data field the x or y coordinate value of the feature point was shown in the field. This creative work was for save time of filling data.
3.3 Judging the data for fitting calculation
Volume 1, Issue 2, October 2012
Page 107
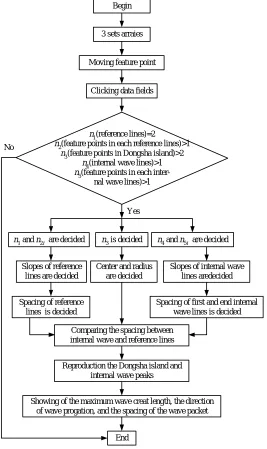
3.4 Calculation and showing the physical parameters of oceanic internal wavesThe calculation process was included 5 blocks. The flow chart of the intelligent software was shown in figure 4.
The first block was divided 3 steps. The first step was that the number of the feature points of each reference line was decided by the intelligent software. The second step was that the straight line question of each reference line was created by the linear fitting with least squares method. The third one was that the distance between the two reference lines was calculated. The distance was the distance of two points of intersection. The two intersection points were a new line with the two reference lines. The slope of the new line was based on the slope of the angle bisector line of two reference line. The new line passed the center of the feature points. The distance between the reference lines was 10km in earth surface.
3 sets arraies
n1(reference lines)=2
n2(feature points in each reference lines)>1 n3(feature points in Dongsha island)>2
n4(internal wave lines)>1 n5(feature points in each
inter-nal wave lines)>1
Yes
n1 and n2i are decided
Slopes of reference lines are decided
Showing of the maximum wave creat length, the direction of wave progation, and the spacing of the wave packet
Reproduction the Dongsha island and internal wave peaks
End Moving feature point
Clicking data fields
Spacing of reference lines is decided
n3 is decided
Center and radius are decided
n4 and n5i are decided
Slopes of internal wave lines aredecided
Spacing of first and end internal wave lines is decided
Comparing the spacing between internal wave and reference lines No
Begin
Figure 4 Flow chart of the intelligent software
The second block was divided 2 steps. The first step was that the number of the edge feature points of the Dongsha Atoll was decided. The second step was that it decided the center and radius.
Volume 1, Issue 2, October 2012
Page 108
passed the center of the feature points. The fourth step was that it compared the average spacing with the distance between the two reference lines and the average length of the oceanic internal wave adjacent two crests was decided. The propagation direction of the oceanic internal wave was decided by the average slope. The length of the longest crest in the remote sensing image was pointed.The fourth block was shown the Dongsha Atoll and the crests of the oceanic internal wave at the right below corner.
The fifth block was shown the result that the longest crest, the propagation direction, and the spacing of the oceanic internal wave crest shown in figure 3.
4.
C
ONCLUSIONSThe calculated results were that the longest crest was 171km, the propagation was north-west 74 degree, the spacing of the adjacent two crests was 5km and the calculation time was less 1 second for the oceanic internal wave at Beijing time 13:33, July 1st, 2008 in the MODIS remote sensing image. The result was more accurate for geometric corrected remote sensing image with the intelligent software. The next work was that the resolution of geometric corrected remote sensing image was increased. Because the resolution of geometric corrected remote sensing image was 1000m in this paper, the next work was the resolution of geometric corrected remote sensing image was 250m.
A
CKNOWLEDGMENTThis paper authors express their sincere thanks to the reviewer for suggestions and comments. This work was supported by the open issues of State Key laboratory of Satellite Ocean Environment Dynamics (No. SOED1201).
R
EFERENCES[1] P. Caillol, V. Zeitlin, “Kinetic equations and stationary energy spectra of weakly nonlinear internal gravity waves,” Dynamics of atmospheres and oceans, 32, pp. 81-112, 2000.
[2] B. A. Pascale, C. Koudella, C. Staquet, et al, “Particle dispersion and mixing induced by breaking internal gravity waves,” Dynamics of Atmopheres and Oceans, 33, pp. 95-134, 2001.
[3] Y. Lvov, E. G. Tabak, “A Hamitonian formulation for long internal waves,” Physica D, 195, pp. 106-122, 2004.
[4] K. G. Lamb, “Energy and pseudoenergy Flux in the internal wave field generated by tidal flow over topography,” Continental shelf research, 27, pp. 1208-1232, 2007.
[5] X. F. Jiang, T. Y. BI, F. F. Chen, et al, “Making of the intelligent calculation system for physical parameters of oceanic internal wave,” In Proceedings of the IEEE Symposium on Photonics and Optoelectronics (SOPO), 2010.
[6] X. F. Jiang, W. Zhou Wei, Y. M. Huang, et al, “Development of the intelligent system for estimating the parametres of ocean internal wave,” International Journal of Computer Science and Artificial Intelligence, 2(1), pp. 23-25, 2012.
[7] Z. H. Mao, J. Y. Chen, M. S. Lin, et al, Dongsha Atolls satellite remote sensing, Ocean Press, Beijing, 2007 (in
Chinese)
AUTHOR