Journal of Electroanalytical Chemistry 476 (1999) 118 – 131
Graphite photoelectrochemistry
2. Photoelectrochemical studies of highly oriented
pyrolitic graphite
Alexander D. Modestov
1, Jenny Gun, Ovadia Lev *
Di6ision of En6ironmental Sciences,Fredy and Nadine Herrmann School of Applied Science,The Hebrew Uni6ersity of Jerusalem, Jerusalem91904,Israel
Received 14 December 1998; received in revised form 19 May 1999; accepted 27 August 1999
Abstract
Photoelectrochemical reduction of oxygen and other observations of sustained electrochemically generated photocurrents with graphitic (HOPG) electrodes in aqueous solutions are reported. The photocurrents were observed over a wide pH range: 0 (0.5 M H2SO4) – 14 (1 M NaOH). Photocurrent-potential, capacitance-potential and photocurrent light action spectral measurements
were performed with basal plane and edge plane HOPG electrodes in order to elucidate the origin of the observed photocurrent. The photocurrent is attributed to hot electron – hot hole pairs photogenerated by direct transition betweenp-electronic states of the valence and conduction bands of graphite. Photogenerated carriers, holes or electrons, are driven by the electric field in the space charge layer (scl) to the electrodeelectrolyte interface, where they react directly with species in the electrolyte inducing anodic or cathodic photocurrent. The potential corresponding to the change of the photocurrent sign from cathodic to anodic was attributed to the flat band potential (EFB). TheEFBof the basal plane electrode was 0 V versus SHE regardless of pH, while for
the edge plane electrodeEFBchanged at a rate of 54 mV per unit of pH. The shift ofEFBof the edge plane electrode with pH
is ascribed to a change of the pH dependent surface dipole formed by oxygen containing surface redox groups. © 1999 Elsevier Science S.A. All rights reserved.
Keywords:Graphite; Carbon; HOPG; Photoelectrochemistry; Electronic properties; Hot electrons; Hot holes
1. Introduction
Graphite is a semimetal, which has been intensively studied due to its technological importance and archetypal properties. Comprehensive reviews on prop-erties and applications of this material are available [1 – 6]. The graphite structure consists of carbon atoms arranged in planar hexagonal layers connected by weak van der Waals bonds. The layered structure of graphite imposes strong anisotropy on all its properties. The conductivity of highly oriented pyrolytic graphite (HOPG) perpendicular to the graphene layers is ap-proximately 4000 times lower than parallel to the basal plane [7]. The structure of the electronic bands of
graphite was studied theoretically [8 – 11] and experi-mentally [11 – 15]. The sp2-hybridization of atomic
or-bitals forms a covalently bound lattice of graphitic planes, piled up one on the other, bonded by the residual forces that arise from the nonhybridized pz
orbitals (denoted as p). The conduction (CB) and va-lence (VB) bands in the vicinity of the Fermi level are composed of overlapping bands of bonding (p) and anti-bonding (p*) pz-electrons. The overlap of the va-lence and conduction bands near the Fermi level is very low, approximately 40 meV. The density of states (DOS) function exhibits a minimum at the Fermi level with a sharp and approximately symmetrical increase at higher and lower energies. The value of DOS at the Fermi level is approximately 1.2×10⁻⁴ states
(atom)−1eV−1 [9]. For comparison, metal Au is
char-acterized by 0.28 states (atom)−1 eV−1 at the Fermi
level [16]. The light absorption and reflection spectra in
* Corresponding author. Fax: +972-2-6586155. E-mail address:[email protected] (O. Lev)
1On leave from the A.N. Frumkin Institute of Electrochemistry,
Russian Academy of Sciences, Moscow, Russia.
the visible-near UV band are dominated by directp–p* transitions [11,13,15].
Due to the low level of charge carriers, the space charge layer (scl) in graphite is relatively thick, as compared to metals, but still much thinner as compared to moderately doped semiconductors. Randin and Yea-ger [17,18] reported capacitance measurements with basal plane HOPG. The capacitance – potential curves exhibited a minimum of approximately 2 – 4 mF cm−2
depending only slightly on the concentration of the electrolyte. The minimum of theC–Ecurves was found to be at 0 V versus SHE independent of pH for the entire 0 – 14 pH range. It was concluded that most of the potential drop applied to the HOPG electrode falls in the scl, and that a blocking contact is formed at the basal plane HOPGelectrolyte interface. The intrinsic semiconductor model was applied to account for the observed C–E behavior. Gerischer and co-workers [19,20] related the shape of the C–E curves of basal plane HOPG to the low DOS in graphite. Since the DOS of graphite increases sharply on both sides of the Fermi level, deviation from the potential of zero charge results in accumulation of charge in the scl. The thick-ness of the scl (W) in a graphite electrode is given roughly by (see Eq. (20) in Ref. [20]):
W=2(o0o/eN0)0.5ln(8se/kT)$4×10−7ln[8se/(kT)]
(1)
where o0 and o:3.3 [14] stand for the permitivity of
free space and the dielectric constant of graphite, re-spectively; e, elementary charge; N0$1.4×1019 cm−3
eV−1, DOS at Fermi level;8
s, potential drop in the scl;
k, Boltzmann constant; and T, absolute temperature. For8s=0.1 V, Eq. (1) givesW:5.5×10⁻⁷cm, which
roughly corresponds to 15 graphene layers.
The poor electrocatalytic properties of basal plane HOPG electrodes were related to the low DOS in the energy vicinity of the Fermi level [21]. The low DOS at the Fermi level of graphite and the zero DOS at the Fermi level of intrinsic semiconductors endow similar electrocatalytic properties to these two different types of solids [21]. The higher electrocatalytic properties of glassy carbon electrodes, as well as that of edge plane HOPG, were related to defects and active oxide groups populating these surfaces [1,3 – 6,21].
The goal of the present work was to describe the dependence of the photogenerated currents on pH, electrode potential and other parameters, and to deduce the source of the photogenerated currents based on these observations. We show that the photocurrent attributes provide an analytical tool for better under-standing of the electrochemical properties of HOPG electrodes. This work was largely influenced by studies of Yeager and co-workers [17,18], and Gerischer and co-workers [19,20], which demonstrated the presence of a significant thick scl in HOPG by capacitance –
poten-tial measurements. We further show here that photoex-citation of graphite gives both cathodic and anodic photoelectrochemical currents depending on applied potential. The photocurrent-potential dependences at basal and edge plane HOPG electrodes were studied and compared to the capacitance-potential measure-ments. Electrochemical reactions involving hot carriers, both electrons and holes, are assumed to be the source of the observed photocurrents.
A model for photocurrent generation by direct trans-fer of hot electrons to acceptors in solution was first proposed by Berg for hydrogen reduction at irradiated mercury electrodes [22,23]. The following mechanism was proposed [23].
ehot+− H
3O+H*+H2O; or ehot+− H2OH*+OH−
H*+H2O+e−H
2+OH− (2)
In this equation e−
hot stands for a hot electron.
Accord-ing to this scheme, the reaction of a hot electron with H3O+ or H2O is followed by consumption of a second
thermalized electron, doubling the photocurrent. Later, a similar approach was proposed by Gerischer and co-authors to account for observations of both anodic and cathodic photocurrents at irradiated Pt and Au electrodes [24 – 26]. Direct transfer of hot holes and hot electrons generated in metal electrodes to donor and acceptor levels in the electrolyte was assumed [24,25]. It was found that the final product of the photohole reaction with water was molecular oxygen [24]. The following elementary reactions were proposed [26]:
H2O+H+OH*+H+ solv
OH*+H2OH2O2+H++e−
H2O2HO2*+H++e−
HO2*O2+H++e− (3)
According to this reaction sequence, three electrons are released to the electrode per one absorbed hot hole, multiplying the photocurrent by a factor of 4.
of hot carriers to species in an electrolyte is treated using conventional charge transfer theory [28,29]. The high energy of hot carriers results in higher charge transfer rates compared to equilibrium charge carriers, which accounts for the photoinduced currents. The excess energy of hot charge carriers is lost by collisions with the lattice. The rate of energy loss is characterized by an energy relaxation time,tE, during which the hot
charge carriers lose (1−1/e) of their excess energy. At the same time, charge carriers are driven by the electric field of the scl, and the hot electrons or holes, depend-ing on the sign of applied bias, reach the elec-trodeelectrolyte interface generating cathodic or anodic photocurrents. The mean energy of hot charge carriers at the interface depends on two characteristic times: the energy relaxation time,tEand the scl transit
time, tt. If tE\tt, excited carriers reach the elec-trodeelectrolyte interface retaining high energy, while in the opposite case only a small fraction of the gener-ated carriers are able to reach the interface. In most solids,tEis in the range of 10−11– 10−13 s, e.g. [30].tt
perpendicular to the basal plane of HOPG can be evaluated using the data on scl thickness and carrier mobility. ForW:5 nm and 0.1 V potential drop over scl, tt can be evaluated taking the carrier mobility
perpendicular to the basal plane to be approximately 1/4000 of the in-plane mobility, i.e. 1.17 m2 V−1 s−1
[2,5,7], giving tt:8.5×10⁻¹³ s. The transit time, tt
falls within the range anticipated for the energy relax-ation time, tE. For HOPG edge plane electrodes, tt is
expected to be much lower due to the higher mobility of the carriers. The rate of electron transfer in electro-chemical reactions increases exponentially with electron or hole energy, and therefore electrochemical reactions of hot carriers are expected to be much faster than reactions involving thermalized ones.
Although hot carrier processes are well researched in solid state physics, e.g. [30], electrochemical reactions involving hot charge carriers have been scarcely demon-strated except for photoemission phenomena. Electro-chemical reactions of hot electrons in semiconductors have been considered [31 – 35] as a way to increase the energy output of photoelectrochemical cells. Hot elec-trons and hot holes have been injected into electrolyte using the tunnel junction of metalinsulator -electrolyte [36–40], metal1insulatormetal2 electro-lyte [39 – 43] or semiconductormetalelectrolyte [44] configurations.
Hellsing and coworkers [45,46] observed photodes-orption of K atoms from a potassium overlayer on graphite at 83 K by irradiation with 2 – 5.7 eV photons. The proposed mechanism of photodesorption involved photoexcitation of hot electrons in the graphite, migra-tion of hot electrons to the surface, and attachment of hot electrons to the adsorbed potassium and a desorp-tion step.
Photocurrent generation with a photoactive layer of camphoric carbon in solid state photovoltaic cells was reported recently [47]. The authors found that the camphoric carbon is comprised of approximately 90% sp2 and 10% sp3 carbon, and it behaves as a
semicon-ductor with approximately 1 eV band gap.
2. Experimental
The electrodes were made of HOPG type ZYA from Union Carbide Corp. (USA) and STM-1, SPI (USA). Prior to measurements, the basal surface of the HOPG electrodes was renewed by removing its upper layers with adhesive tape so as to achieve a visually defect-free surface. The basal plane electrodes with renewed sur-face were used for only one cycle of electrochemical measurements. The potential range was chosen so as to avoid damage to the HOPG basal plane by oxidation [48,49]. The edge plane HOPG was prepared by casting the HOPG in Torr-Seal (Varian) [50] with subsequent polishing using a set of wet emery papers and a cloth wetted with 0.2 mm alumina suspension. Subsequent sonication of the specimen in methanol and then in distilled water was conducted in order to remove dam-aged layers left after polishing. Prior to the measure-ments, the edge plane electrodes were treated by holding the potential at 1.6 V versus the hydrogen equilibrium potential for 20 min.
Israel). The light intensity hitting the sample was in the range 0.7 – 6 mW cm−2. For the 310 nm wavelength, at
which most of the photocurrent measurements were conducted, the light intensity was about 1.4 mW cm−2.
The rms and phase angle of the photocurrent were recorded by an X – Y recorder. Photocurrent – potential curves were measured at 0.5 – 1 mV s−1 scan rate. The
dependence of photocurrents on photon energy was measured at 5 – 20 nm min−1 wavelength sweep rate.
Since the value of photocurrent yield per one photon changed by orders of magnitude with electrode poten-tial, and in order to simplify comparison of the photo-current yield – photon energy dependences measured un-der different conditions, the photocurrent yield readings are given in normalized form. The yield values were divided by the maximal value in each curve. The elec-trodes were held at the specified potential for 15 min prior to the spectral and capacitance measure-ments.
Capacitance measurements were performed by super-imposing a 10 mV sinusoidal voltage on 1 mV s−1
potential scan. The electrode capacitance was calculated from the out of phase component of the ac current, measured by a lock-in amplifier and recorded using an X – Y recorder.
3. Results and discussion
3.1. HOPG basal plane electrode
Photocurrent density – potential (Iph–E) curves were measured in 0.5 M Na2CO3(pH 12.8), 0.25 M KH2PO4 (pH 4.5) and 0.5 M Na2SO4buffered with 0.1 M NaOH
(pH 13), 0.1 M H3BO3 (pH 5.2), 0.1 M H2SO4 (pH
0.7); 0.1 M Na2B4O7 (pH 9.2) and H3PO4 (to achieve
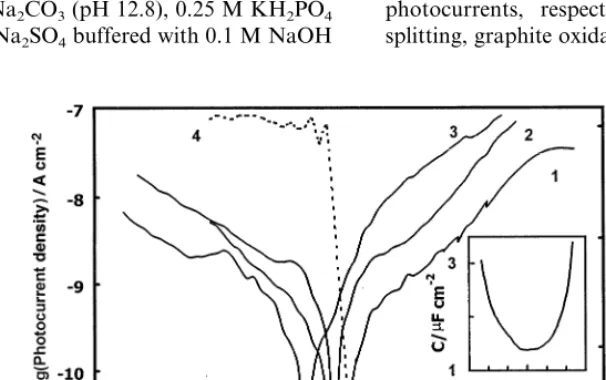
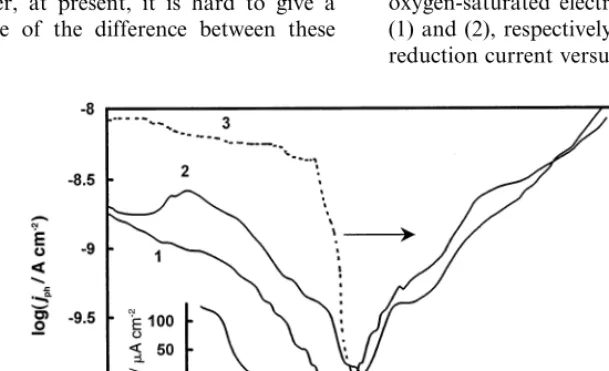
pH 2.6). The photocurrent – potential curves were also recorded in 1 M KCl unbuffered (pH 7) and with 0.1 M HCl (pH 1). The dependence of the logarithm of the photocurrent density on electrode potential measured at a basal plane HOPG electrode in three electrolytes: 0.5 M H2SO4, Na2SO4(pH 7), and 1 M NaOH, is shown in
Fig. 1. The Iph–Ecurves recorded in other electrolytes
[image:4.612.128.431.456.646.2]were quite similar to the curves shown in Fig. 1, implying negligible influence of the electrolyte composi-tion on photocurrent generacomposi-tion at the basal plane HOPG electrode. Potential scans were initiated in the positive direction after holding the electrode at the starting potential for 10 min. The phase angle of the modulated photocurrent is presented only for the curve measured in H2SO4, but this curve is representative for other cases as well. Zero phase angle corresponds to cathodic photocurrents. In all cases, the photocurrent was cathodic at the starting potential and decreased down to a minimum, where the photocurrent changed from cathodic to anodic, which was manifested by about 180° change of the phase angle. For basal plane electrodes, the photocurrent changed sign at 0.190.15 V (SHE) regardless of the electrolyte pH and electrolyte composition. The potential of the photocurrent minima at basal plane electrodes is given in Fig. 2, curve 1, as a function of pH. The scatter of data is apparently due to the presence of uncontrollable small amounts of defects at the basal plane electrode. The reaction schemes (2) and (3) were assumed to be the main reaction routes for generation of cathodic and anodic photocurrents, respectively. However, besides water splitting, graphite oxidation and intercalation processes,
Fig. 1. Potential dependence of the photocurrent at the HOPG basal plane electrode. Potential scan of 1 mV s−1initiated from negative potential,
photon energy 4.0 eV, light power 1.4 mW cm−2: (1) 0.5 M H
2SO4; (2) Na2SO4pH 7; (3) 1 M NaOH; (4) phase angle dependence corresponding
to (1). Insert shows the potential dependence of the basal plane electrode capacitance in 0.5 M H2SO4measured by superimposition of 10 mV,
Fig. 2. pH dependence of photocurrent minima measured at basal plane () and edge plane (+) HOPG electrodes. (x) pH dependence of pseudocapacitance maximum measured at the edge plane HOPG electrode.
3.2. Dynamic photocurrent response
The shape of the photocurrent – time response to intermittent irradiation of the HOPG basal plane elec-trode in 0.25 M KH2PO4 (pH 4.5) at E=1.16 V is shown in Fig. 3A and B. In this experiment, a mechan-ical shutter was used instead of a chopper. As can be seen from this figure, the photocurrent response was an almost ideal step function (within the accuracy of data acquisition time, 0.03 s) and remained constant between consecutive time events. Under the same experimental conditions, the rms photocurrent (Iph) measured by the
lock-in amplifier when the light beam was interrupted by the 12 Hz mechanical chopper was about 40% of the photocurrent step (Iphstep) measured when irradiation was
triggered by the mechanical shutter (Fig. 3A, B). As the light intensity – time function of the chopped light was of nearly perfect square wave shape, the first Fourier component of the relevant photocurrent should be equal to the value of the photocurrent step multiplied by a factor of 2/p[51]. Another 2−0.5factor arises from
the transformation of the amplitude of the sine signal to its rms value. As a result, the rms photocurrent should be about (2/p)0.71=0.45 of the relevant pho-tocurrent step. The fact that the calculated (0.45) and experimental (0.4) values of (Iph/Iphstep) were so close
proves that the photocurrent measured by the lock-in amplifier represents step changes between two constant steady state currents. In 0.25 M KH2PO4 (pH 4.5) at
E=1.16 V, the rms photocurrent, within the accuracy of measurements (10%), was independent of chopper frequency at the frequency range 12 – 1200 Hz. This enables us, in the present case, to assert that the rise time of photocurrent response to irradiation step is smaller than 1 ms.
as well as reduction of traces of dissolved oxygen, can also generate photocurrents. No attempt to identify the products of photocurrent generation was undertaken due to the low values of observed photocurrents.
The modulated photocurrent measured by the lock-in amplifier at a frequency of 12 Hz can be considered as a stationary photocurrent, since its period, of the order of 0.1 s, is many orders of magnitude higher than the energy relaxation time of hot-charge carriers, 10−11–
10−13 s, or the RC time constant 10−4 s of the
electrochemical cell. In this case, Ris ohmic resistance of the electrolyte and contacts (less than 100V), andC
is the capacitance of the electrode (about 1mF).
Fig. 3. (A) Photocurrent – time response to intermittent irradiation of the HOPG basal plane electrode in 0.25 M KH2PO4(pH 4.5),E=1.16 V,
photon energy 4.43 eV, light power 0.6 mW cm−2. The arrows indicate light switching by a mechanical shutter. (B) A section of curve (A) in
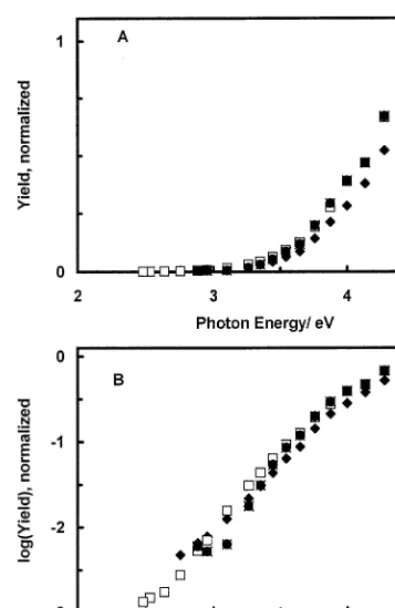
[image:5.612.123.438.487.657.2]Fig. 4. (A) Dependence of the normalized cathodic photocurrent yield on photon energy measured with the basal plane HOPG electrode in 0.25 M KH2PO4 (pH 4.5): (x) −0.18 V; ( ) E= −0.48 V; ()
E= −0.58 V; (")E= −0.68 V. (B) The same as (A) but theY-axis in logarithmic scale.
coincidence of the minima of the C–Ecurves with the potential of sign change of the Iph–E curve was
ob-served for intrinsic semiconductor electrodes, where band-to-band photoexcitation generates electron – hole pairs, which are separated by the electric field of the scl [53 – 55]. Note that the photocurrent – potential de-pendence is much steeper as compared to the capaci-tance – potential curve. A 1 V shift from EFB increases
the photocurrent by a factor of 10 – 50, while the ca-pacitance is only doubled by this potential change.
3.4. Photocurrent dependence on photon energy
The dependence of the normalized photocurrent quantum yield (Y) on photon energy was studied in order to rationalize the origin of the photocurrent and to discriminate it from photoemission and thermal ef-fects. Both cathodic and anodic spectra were measured up to l=700 nm, but since irradiation with photon energy (hn), lower than 2 eV, produced only very weak photocurrents, this portion of the spectra is not shown. Irradiation of the basal plane HOPG electrode by 700 – 900 nm light (P:2 mW cm−2) induced no
measurable modulated currents. The dependence of the normalized cathodic photocurrent yield and its logarithm on photon energy measured with HOPG electrodes in 0.25 M KH2PO4 (pH 4.5) is shown in
Fig. 4. Measurements were performed in the potential range −0.18 to −0.68 V. The points of the normal-ized spectra taken at different potentials nearly coin-cide. This observation helps to rule out photoemission of electrons as a source of cathodic photocurrents. In the case of photoemission, the spectra are expected to be shifted along the photon energy axis by 1 eV per 1 V of potential change [56 – 58]. N2O is an effective
scavenger of electrons. Therefore it increases photo-emission currents substantially [56 – 58] by scavenging solvated electrons. However, purging the electrolyte by N2O had no effect on photocurrent generation in 0.5
M H2SO4. This is also an indication that
photoemis-sion of electrons into electrolyte is not responsible for the observed photocurrent.
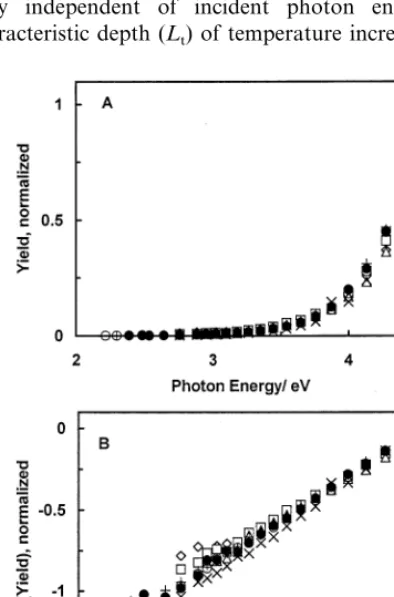
The dependence of the normalized anodic photocur-rent yield and its logarithm on photon energy mea-sured in 0.5 M H2SO4 in the potential range 0.62 – 1.22 V is shown in Fig. 5. As in the case of cathodic photocurrents, the shape of anodic spectra is practi-cally independent of potential. The photocurrent yield was highly dependent on irradiation energy, hn. For example, in 0.5 M H2SO4 at E= −0.58 V, the
ca-thodic photocurrent measured at 4.6 eV was approxi-mately 750 times larger than the photocurrent obtained at hn=2.5 eV (Fig. 4). Note that this com-parison is based on the same number of incident pho-tons.
3.3. Comparison of Iph–E and C–E cur6es
Measurements of electrode capacitance conducted by superimposition of a voltage modulation on the positive potential scan revealed capacitance minima at 0.090.15 V (SHE), regardless of the pH, in agree-ment with previous observations of Randin and Yea-ger [17,18]. The capacitance – potential dependence measured at the HOPG (ZYA) basal plane electrode in 0.5 M H2SO4 is shown in the insert of Fig. 1. The
electrode capacitance was almost independent of fre-quency in agreement with earlier findings [17,18]. The value of the capacitance minimum was proposed to be a measure of the density of defects at the HOPG basal plane [52]. The capacitance minimum was 1.4 mF cm−2 at the ZYA HOPG basal plane electrode, which
is close to the value of the capacitance minimum mea-sured by McCreery and coworkers [52] on cleaved HOPG ZYA electrodes, 1.2mF cm−2. The coincidence
of the potentials of the minima of theIph–E andC–E
[image:6.612.47.245.26.330.2]3.5. Discussion of thermal effects as a source of modulated currents
Regardless of the mechanism by which the photocur-rent can depend on thermal effects (e.g. change of electrode capacitance; change of Faradaic resistance; or increase of diffusion rate of species in the electrolyte), the modulated current is expected to be proportional to the temperature increase at the electrode surface, and the temperature increase at the electrode surface should be proportional to the absorbed irradiation power [56 – 63]. The absorbed light power is proportional to (1−
R), whereRstands for the light reflectivity coefficient. The reflectivity (R) of the basal plane – vacuum surface under near normal light incidence (as in the present studies) changes from a maximal value of 55% athn=5 eV to a minimal value of about 33% at hn=3 eV and then increases to about 40% athn=1.5 eV [11]. Multi-plication of (1−R) byhngives approximately the same absorbed power per photon in thehnrange of 3 – 5 eV (the difference between reflectivity values of graphitewater and graphitevacuum interfaces is ne-glected). Thus, the effect of heating should be practi-cally independent of incident photon energy. The characteristic depth (Lt) of temperature increase due to
heat transport within the electrode can be estimated by the following expression [58]:
Lt=(x/(2crv))0.5 (4)
where c=0.71 kJ kg−1 K−1 is the specific heat of
graphite, r=2300 kg m−3 is the density of graphite
[64], and v=2pf:75 is the light modulation fre-quency. Because of the relatively high heat conductivity of graphite (x=5.7 W m−1 K−1parallel to thec-axis
and much higher heat conductivity, 2000 W m−1K−1,
perpendicular to the c-axis [64]), the temperature in-crease during the irradiation period (0.1 s) spreads over a depth of 1.5×10⁻⁴ m (3×10⁻³ m) for the
basal (edge) plane. These values are many orders of magnitude larger than the light penetration depth in graphite (about 20 nm). Thus, the dependence of the light absorption index (k) on photon energy (hn), which determines the light absorption length (l=l/(4pk)) cannot play a significant role in the spectral dependence of thermally photoinduced current. Additionally, the k
versus photon energy dependence is rather weak. The value of k decreases from 2.6 to 1.6 when hn changes from 5 to 4 eV, and then remains approximately con-stant for the range 4 – 2 eV hn. The absence of a correlation between the optical properties of graphite and the observed photocurrent – photon energy curves rules out thermal effects as a source for the photomod-ulated currents.
The independence of photocurrent on light modula-tion frequency in the range of 12 – 1200 Hz also indi-cates that heating of the electrode is not the cause for the modulated current. The effect of heating the elec-trode by a pulsed or modulated light beam has been studied in Refs. [59 – 63]. The current response [61 – 63] was found to be strongly dependent on the frequency of light interruption. The response practically vanished at a frequency higher than 12 Hz [61] or 100 Hz [62,63]. The characteristic response time to pulse heating of the electrode in the stagnant electrolyte was found to be about 90 ms [59,60]. These observations are opposite to the frequency – independent response found in the present case.
3.6. Energy diagram of the HOPG basal planeelectrolyte interface
The symmetrical dependence of anodic and cathodic photocurrents on electrode potential cannot be inter-preted in the framework of modern theory of photo-emission [56 – 58], in which formation of hot delocalized electrons in electrolyte at the distance of 2 – 5 nm from the electrode is an essential step. The exponential de-pendence of cathodic and anodic photocurrents on both photon energy and applied potential can be ex-plained by the increased rate of electron transfer at the electrode surface for high-energy hot electrons or hot
Fig. 5. (A) Dependence of the normalized anodic photocurrent yield on photon energy measured with the basal plane HOPG electrodes in 0.5 M H2SO4: (2)E=0.62 V; ()E=0.72 V; ()E=0.82 V; (x)
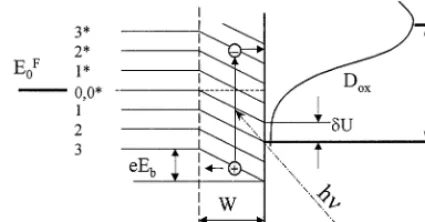
[image:7.612.47.244.339.638.2]Fig. 6. Energy diagram of the HOPG basal plane electrode in contact with electrolyte containing a redox couple. Dox is the density of
unoccupied electronic states of oxidized species in the electrolyte.EF0
andEFelare the Fermi levels in the electrode and electrolyte,
respec-tively,W, thickness of the scl. The scl is charged negatively.
collisions with the lattice are neglected. The flux of hot electrons that reaches the electrodeelectrolyte inter-face J is given by the expression:
JLaW (5)
Lis the photon flux hitting the electrode surface, anda stands for the light absorption coefficient. Light reflec-tion by the electrode is neglected. The average energy of hot electrons reaching the electrode surface is taken to be close to the energy of the electron photoexcited in the middle of the scl when it comes to the interface without energy losses. Under these assumptions, the flux of hot electrons hitting the electrodeelectrolyte interface is characterized by an average electron energy,
U measured relative to the Fermi level in graphite,EF0
(Fig. 6):
U=0.5(hn−eEb) (6)
In this equation,Ebis the potential drop in the scl. The energy (eEb) is taken to be positive. The factor 0.5 in Eq. (6) stems from the similarity of the p- and p *-sub-bands, so that the photon energy is shared roughly equally between the hot electron and hot hole. At the surface, hot electrons are expected to undergo fast thermalization. Thus, a steady concentration of hot electrons (nsJ) with energybU(bB1) is maintained
at the interface. According to the theory of charge transfer at semiconductor electrodes [28,29], the rate of electron transfer from the electrode to species in elec-trolyte is equal to
J=ekmaxn
scoxexp[−(U−E0ox)2/(4kTl)] (7)
where kmax stands for the heterogeneous rate constant,
cox is the concentration of oxidized species at the elec-trode surface, andE0
ox=lis the electronic energy level
of an Ox in its most probable configuration measured relative to the Fermi level in the electrolyte. l is the reorganization energy, andUis the electronic energy in the electrode measured relative to EFel. The Fermi level
in graphite relative to EFel is equal to
EF0=EFel+dU+eEb (8)
where dUis the electron energy at the level 0,0* at the surface relative to EFel. Substitution of Eqs. (5) and (6)
into Eq. (7), neglecting the second order terms and assuming dUl, gives:
J=ekmaxn scoxexp
−{[0.5bhn+(1−0.5b)eEb+dU−l]2/(4kTl)}
(9)
J:KaLWcoxexp{[0.5bhn+(1−0.5b)eEb)]/(2kT)}
(10)
All the constant parameters are combined in one com-mon constant,K. A similar treatment can be performed for a positively charged space charge layer, where hot holes. A simplified energy diagram of a HOPG basal
plane electrode in contact with an electrolyte is shown in Fig. 6 for a negatively biased electrode (versusEFB).
According to earlier observations [17 – 20] and our mea-surements, the capacitance of the scl of a HOPG basal plane electrode near EFB is substantially smaller than
the Helmholtz layer capacitance. Therefore, in the course of this discussion we consider the potential drop in the Helmholtz layer as constant. Thus, the applied bias changes only the potential drop over the scl. A linear drop of potential across the scl is assumed for simplicity. As a result of the band bending, some of the states in the CB are filled in the scl. The surface states at the interface represent defects at the basal plane. The defects are probably the sites of the increased charge transfer rate and the sites of increased adsorption of species from electrolyte due to the presence of oxygen-containing groups [52,65]. Monochromatic irradiation activates direct electronic transitions between p- and
p*-states separated by a photon energy, hn. Other hn
excitations are unlikely because they involve forbidden indirect transitions. Some of the continuum of p- and
p*-electronic states of graphite are shown in Fig. 6 marked by numerals, which represent arbitrarily chosen wave vectors. Asterisks denote levels in the p *-anti-bonding sub-band. The levels marked 0 and 0* corre-spond to energy levels at the overlap of the VB and CB. The DOS of graphite is minimal at this point and increases almost symmetrically on both sides of this level. Only direct transitions between p–p* electron states are allowed [8,15]. In terms of Fig. 6, only transitions between the levels marked with the same numbers (e.g. 33*) are permitted. According to Eq. (1), the scl thickness changes slowly with potential, and can be considered roughly constant. A light beam of
holes are driven to the electrodeelectrolyte interface. Eqs. (9) and (10) describe the photocurrent dependence on photon energy only on the basis of charge transfer kinetics. Therefore, the photocurrent action spectrum is expected to depend on the chemical identity of the donor and acceptor species in the electrolyte. On the other hand, the photocurrent action spectrum of graphite does not reflect the electronic structure of material, as is the case of semiconductor or insulator electrodes (band gap energy), since the optical proper-ties of graphite were taken to be independent of light wavelength.
Eq. (10) was developed for the electrode potentials far from theEFB. Photoexcitation of the graphite
elec-trode produces hot holes and hot electrons in equal amounts. Both are expected to possess sufficient energy to participate in electrochemical processes. The sign of the photocurrent is determined by excess of one of the two types of hot charge carriers at the electrode surface and by the kinetics of charge transfer for both anodic and cathodic currents. Close to EFB, the driving force
of the field in the scl vanishes, and the ratio between surface concentrations of hot holes and hot electrons will depend mostly on the energy relaxation time of the charge carriers. At some potential close to EFB, the
opposite currents originating from reactions of hot electrons and hot holes will compensate for each other giving zero photocurrent. This potential is expected to depend on the presence of acceptors of holes or elec-trons in electrolyte, which change the kinetics of charge transfer. Therefore, some difference between the value of EFB determined by capacitance measurements and the potential of minimal photocurrent magnitude is anticipated. However, at present, it is hard to give a quantitative estimate of the difference between these values.
3.7. Influence of dissol6ed oxygen
Figs. 1 – 5 present photocurrents in aqueous solution without a deliberate introduction of redox species to the cell. Thus, the underlying electrochemical reactions remain unknown, and we can only postulate that they arise from water-splitting or redox reactions of the graphite. Dissolved oxygen does not absorb light in the range of 2 – 4.6 eV; however we observed a cathodic photocurrent in the presence of oxygen. Oxygen reduc-tion on graphite electrodes proceeds through a complex mechanism involving dioxygen adsorption and a one-electron charge transfer step of reduction of the ad-sorbed O2molecule. This is followed by a fast chemical
disproportionation step [66,67]:
O2O2(ads)
O2(ads)+H2O+e−HO2(ads)+OH−
2HO2(ads)+H2O2H2O2+1/2O2 (11)
Oxygen reduction on irradiated HOPG electrodes is expected to follow the reaction scheme of Eq. (11) with participation of photogenerated hot electrons and oxy-gen molecules adsorbed at HOPG defect sites. Nitrooxy-gen (99.999%) was bubbled through 0.1 M H2SO4for 1 h to deaerate the electrolyte prior to the photocurrent mea-surements. After recording the Iph–E dependence in
oxygen free electrolyte, oxygen was purged for 1 h, and a new curve was recorded. Subsequent bubbling of nitrogen returned the Iph–E curve to its initial form.
[image:9.612.126.431.469.655.2]The dependence of the photocurrent on electrode po-tential in the absence of oxygen in the electrolyte and in oxygen-saturated electrolyte is shown in Fig. 7, curves (1) and (2), respectively. The curve of the dark oxygen-reduction current versus potential is shown in the insert
Fig. 7. Potential dependence of photocurrent at the HOPG basal plane electrode in deaerated and oxygen saturated 0.1 M H2SO4, scan rate 0.5
mV s−1,hn=4.0 eV, light power 1.4 mW cm−2. Insert shows dark current – potential dependence, scan rate 0.5 mV s−1. Curve (1), nitrogen
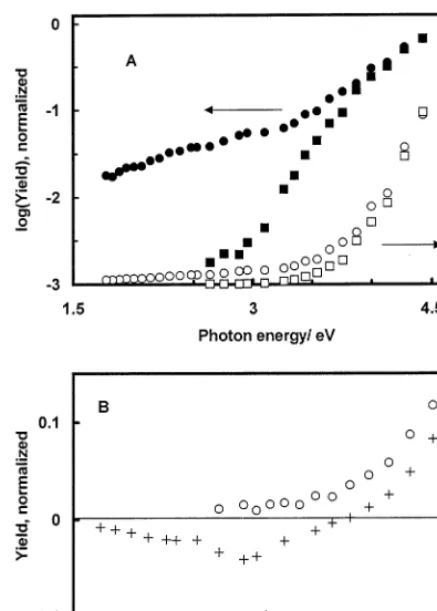
Fig. 8. (A) Dependence of normalized cathodic photocurrent yield on photon energy in 0.1 M H2SO4in oxygen-free electrolyte () and in
oxygen-saturated electrolyte (). Open symbols correspond to Yield-axis; filled symbols correspond to log(Yield)-axis. (B) Dependence of normalized photocurrent yield in oxygen-free () and oxygen-satu-rated (+) 0.1 M H2SO4atE=0.62 V, positive values correspond to
anodic photocurrents.
[image:10.612.34.253.27.333.2]the low photon energy band (B3 eV). Sequential purg-ing of the electrolyte by nitrogen and oxygen at E= −0.48 V versus SHE resulted in a reproducible change of photocurrent spectra between the curves shown in Fig. 8A. This qualitative change of the dependence of the photocurrent – yield spectra provides further proof of the kinetic nature of the photocurrent. The anodic photocurrent spectra measured at potentials far from the potential of the photocurrent minimum remained unaffected by the presence of oxygen. However, at potentials close to the potential of minimal photocur-rent, evidence of the simultaneous occurrence of ca-thodic and anodic processes was obtained. The low photon energy portion of the Iph–hndependence in 0.1
M H2SO4 in the presence and in the absence of
dis-solved oxygen is shown in Fig. 8B (forE=0.62 V). The curve recorded in the presence of oxygen shows a change of photocurrent sign from anodic to cathodic as a function of photon energy with an inversion point at 3.5 eV, while the photocurrent recorded in oxygen-free electrolyte remained anodic throughout. At photon en-ergies higher than 4 eV, the data points for both curves nearly coincide. The qualitative change of the depen-dence of the photocurrent – yield spectra on potential proves the kinetic nature of the photocurrent.
3.8. Edge plane HOPG electrode
Since the thickness of the scl depends on the concen-tration of charge carriers but not on their mobility (Eq. (1)), a scl is expected to be formed on the HOPG edge plane as well. In this case, the mobility of charge carriers in a direction perpendicular to the electrode plane is about 4000 times higher than for the basal plane electrode, due to the anisotropic conductivity of HOPG. This increased mobility implies a lower scl transit time, and consequently lower energy losses by relaxation processes, conditions that favor photocur-rent generation. Indeed, sustained photocurphotocur-rents were observed with edge plane electrodes as well. TheIph–E
curves measured in H2SO4, Na2SO4(pH 7) and Na2CO3
(pH 12.8) at edge plane HOPG are shown in Fig. 9. The change of the photocurrent phase angle with po-tential is shown only for the H2SO4 solution. The
curves are similar to the Iph–E dependence measured with the basal plane HOPG electrode (Fig. 1). How-ever, the potential values of photocurrent minima are shifted relative to the potentials of minimal photocur-rent at the basal plane. The dependence of the pho-tocurrent yield on photon energy measured at the edge plane electrode is shown in Fig. 10 for anodic and cathodic photocurrents. The slope of the log(Yield)−
hndependence of the cathodic photocurrent is approxi-mately half the slope of this dependence at the basal plane electrode at the same potential (Fig. 4). The anodic log(Yield)−hn curve follows the trend of the in Fig. 7. Comparison of the photocurrent curves
recorded in oxygen-free and in oxygen-saturated elec-trolyte shows a two-fold increase of photocurrent in the potential range between −0.3 V and the potential of minimal photocurrent. The potential of minimal pho-tocurrent is shifted about 70 mV to more positive values in the oxygen saturated electrolyte. A reduction of the photocurrent is observed around −0.3 V, which brings the photocurrent magnitude in the presence of oxygen to its value in oxygen-free solution (curve 1). The decrease of the photocurrent coincides with oxygen depletion in the vicinity of the electrode by the dark current, which is manifested by the saturation of the dark current. Indeed, mass-transport-limited conditions can be clearly seen in the dark current-potential insert of Fig. 7.
The dependence of the normalized cathodic pho-tocurrent yield on photon energy in the presence of oxygen in 0.1 M H2SO4 atE= −0.48 V versus SHE is
Fig. 9. Potential dependence of the photocurrent for the edge plane HOPG electrode, scan rate 0.5 mV s−1, photon energy 4.0 eV, light power
2.8 mW cm−2: (1) 1 M Na
2CO3; (2) 1 M Na2SO4, pH 7; (3) 0.5 M H2SO4; (4) phase angle corresponding to (3). basal plane electrode at photon energies of 3 – 4.7 eV,
with increased slope athn2 – 3 eV. The pH dependence of the potential of photocurrent minima for edge plane electrodes is shown in Fig. 2. The slope of the curve is about 54 mV per unit of pH. One can ascribe the pH shift of EFB of the HOPG edge-plane electrode to the
influence of surface oxygen-containing groups (similar to semiconductor electrodes) for whichEFBshifts by 59
mV per unit of pH [53 – 55] due to charging of surface OH groups. Redox processes of oxygen-containing sur-face groups are known to be the source of large, frequency-dependent capacitance in graphitic elec-trodes, which exceeds the capacitance of the Helmholtz layer substantially [1,67 – 72]. To distinguish double layer capacitance from the capacitance related to sur-face change transfer processes, the latter is called a pseudocapacitance.
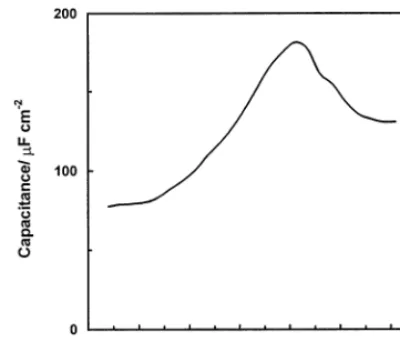
The potential dependence of the capacitance of the edge plane electrode measured by imposing 10 mV, 5 Hz modulation on a potential ramp in 0.5 M H2SO4 is
shown in Fig. 11. The measurements were performed in the absence of redox species in the electrolyte and inside the potential window of water decomposition in order to avoid shunting of capacitance elements by the rela-tively low resistance of Faradaic processes. In contrast to the basal-plane electrode, the pseudocapacitance curve exhibited a maximum at potentials close toEFB.
A similar bell-shaped potential dependence of the ca-pacitance has been reported for titania and ascribed to surface states [73]. Capacitance measurements per-formed at a single audio frequency can be considered only as a rough estimate. Nevertheless, we have used measurements performed by superimposition of 5 Hz modulation voltage on a potential scan to study pH dependence of the potential of maximal capacitance. The dependence of the potential of the capacitance maximum on pH is shown in Fig. 2 (x symbols). The
slope of the corresponding linear fit is 61 mV per unit of pH. The points nearly coincide with the EFB– pH
dependence in the same figure (+symbols). The poten-tial of the maximal electrode capacitance is roughly equal to the potential of the peaks of the background current and of differential pulse voltammograms at glassy carbon electrodes [68 – 72]. These current peaks are ascribed to redox reactions of surface bound groups. The voltammetric peaks were also shifted to a rate of 60 mV per unit of pH [68 – 70].
Hot electrons (holes) can be captured by surface redox groups (surface states) located at the surface of the HOPG edge plane electrode forming reduced (oxi-dized) states of the group. Surface states are probably the mediators of charge transfer from graphite to redox species in solution [21], similar to the role of surface states at semiconductor electrodes [74]. On the other hand, trapping of hot charge carriers at the surface
Fig. 10. Dependence of normalized photocurrent yield at the edge plane electrode in 0.5 M H2SO4: ()E= −0.38 V, cathodic
[image:11.612.299.517.482.646.2]Fig. 11. Potential dependence of the capacitance at the HOPG edge plane electrode in 0.5 M H2SO4. Capacitance was measured by
superposition of 10 mV, 5 Hz potential modulation on 1 mV s−1
potential scan.
photon energy, while for the edge plane electrode, this quantity reached 1.2 – 1.8 V.
Since b is assumed to be less than unity, the depen-dence of photocurrent on potential should be stronger than the dependence on photon energy. Indeed, the slopes of log(photocurrent) versus potential curves are about 1.5 – 1.8 times higher than the slopes of log(Iph)
versus hn curves. However, the actual slopes of these curves are smaller than predicted. These estimates indi-cate that the overall model is based on simplifying assumptions, and while it can explain qualitatively the photocurrent dependence on both potential and photon energy, it is not suitable for accurate quantitative anal-ysis. The presence of surface groups at the edge plane electrode further complicates the mathematical model-ing of the photogenerated current at these electrodes. The highest magnitude of the photocurrent generated at an HOPG basal plane electrode was 0.1 mA cm−2
(Fig. 1) atE=1.2 V. Taking into account that the light penetration depth is about four times larger than the scl thickness, then for the given light beam power (P=1.4 mW cm−2), the efficiency of the photocurrent
genera-tion (based on 0.25Pabsorbed within scl) at basal plane electrodes reached 0.15%. Current multiplication is not taken into account. For edge plane electrodes (Fig. 9), the efficiency was two to three times higher.
4. Conclusions
A description of photocurrent generation on HOPG basal plane and edge plane electrodes is presented. Both cathodic and anodic photocurrents were observed. The observed photocurrent is explained by photogeneration of hot electron – hole pairs by direct band-to-band (p–
p*) electron transition within the scl of graphite. The photogenerated carriers (hot holes or hot electrons) are driven to the electrodeelectrolyte interface by the elec-tric field in the scl, where they participate in charge-transfer reactions. The action spectra of the photocurrent reflect the dependence of charge transfer rate on hot-charge carrier energy and thus, unlike semi-conductors, no threshold excitation energy is required. In contradistinction to photoemission of electrons, the photocurrent in graphite is described by an exponential dependence rather than by a power law, and both anodic and cathodic currents were observed.
The photocurrent generation in oxygen-free elec-trolytes is ascribed to water splitting reactions. The photoelectrochemical reduction of oxygen was demon-strated by the increase of cathodic photocurrents in oxygen saturated electrolytes.
The flat band potential of graphitic electrodes can be determined by photocurrent measurements at the po-tential at which the photocurrent changes sign. TheEFB
of the basal plane HOPG electrode was found to be in states can be expected to change the energy distribution
of hot charge carriers affecting the shape of the pho-tocurrent dependence on photon energy. Indeed, the curves of photocurrent dependence both on photon energy and on electrode potential measured using an edge-plane electrode differ from the curves measured at the basal plane electrode. After correction for the dif-ference in photon fluxes in these experiments, the pho-tocurrents measured at edge plane electrodes (Fig. 9), at the same potential relative toEFB, appeared to be about
three times higher than photocurrents at basal plane electrodes (Fig. 1).
3.9. Trends of the Iph–E and Iph–hn cur6es
On the basis of Eq. (10), one can expect a ten-fold increase of the photocurrent magnitude per 240×b−1
meV increase of the photon energy and 240×(1 – 0.5b)−1 mV of the potential increase. Exponential
de-pendence of the photocurrent on both potential and photon energy was indeed observed. The reciprocal value of slope of the logarithm of the photocurrent-po-tential dependence approaches 200 – 300 meV per one order of photocurrent increase only within a rather narrow potential region close to EFB for a basal plane electrode (Fig. 1). Further away, at a larger distance from EFB, the photocurrent increases by one order of magnitude for a potential change of 0.6 – 0.8 V for the basal plane electrode (Fig. 1), and by 0.7 – 1 V for the edge plane electrode (Fig. 9). It was not possible to obtain action spectra in the potential region adjacent to
EFBbecause the photocurrent was too small. Therefore,
the photocurrent action spectra were measured only at potentials rather distant from EFB (Figs. 4, 5 and 10).
agreement with previous capacitance studies [17 – 19]. The EFB of the edge-plane electrode determined by
photocurrent measurements shifts with the electrolyte pH as expected for pH equilibrated surface groups.
Capacitance measurements revealed a dependence of the pseudocapacitance on potential. The potential of the pseudocapacitance maximum is roughly equal to
EFB, and accordingly shifts with the pH of the solution.
The pseudocapacitance is ascribed to surface electronic states.
An energy diagram of the basal-plane HOPG elec-trode in contact with solution was proposed.
The photoreduction of dissolved oxygen at an irradi-ated basal plane HOPG electrode was demonstrirradi-ated.
Acknowledgements
We thank the BMBF-KFK, Germany and MOS, Israel for financial help. We gratefully acknowledge the helpful comments of Professor A.M. Kuznetsov, Pro-fessor Yu. V. Pleskov and ProPro-fessor Z.A. Rotenberg during the preparation of the manuscript.
References
[1] R.L. McCreery, in: A.J. Bard (Ed.), Electroanalytical Chemistry, vol. 17, Marcel Dekker, New York, 1990, p. 221.
[2] A.W. Moore, in: P.C. Walker, P.A. Thrower (Eds.), Chemistry and Physics of Carbon, Marcel Dekker, New York, 1981, p. 119. [3] J.O. Besenhard, H.P. Fritz, Angew. Chem. 22 (1983) 950. [4] K. Kinoshita, Carbon: Electrochemical and Physicochemical
Properties, Wiley, New York, 1988.
[5] J.-P. Randin, in: A.J. Bard (Ed.), Encyclopedia of Electrochem-istry of the Elements, vol. 7, Marcel Dekker, New York, 1976, p. 2.
[6] M.R. Tarasevich, E.I. Khrushcheva, in: B.E. Conway, J.O.M. Bockris, R.E. White (Eds.), Modern Aspects of Electrochem-istry, vol. 19, Plenum, New York, 1989, p. 295.
[7] I.L. Spain, A.R. Ubbelohde, D.A. Young, Phil. Trans. R. Soc. 262 (1967 – 1968) 345.
[8] F. Bassani, in: E.D. Haidemenakis (Ed.), Optical Properties of Solids, Gordon and Breach, New York, 1970, p. 1.
[9] R.C. Tatar, S. Rabii, Phys. Rev. B 25 (1982) 4126.
[10] J.-C. Charlier, J.-P. Michenaud, X. Gonze, Phys. Rev. B 46 (1992) 4531.
[11] D.L. Greenaway, G. Harbeke, F. Bassani, E. Tossati, Phys. Rev. 178 (1969) 1340.
[12] P. Skytt, P. Glans, D.C. Mancini, J.-H. Guo, N. Wassdahl, J. Nordgren, Y. Ma, Phys. Rev. B 50 (1994) 10457.
[13] E.A. Taft, H.R. Philipp, Phys. Rev. 138 (1965) A197.
[14] S. Ergun, J.T. McCartney, Gmelins Hanbuch der Anorganischen Chemie, Achte vollig neu bearbeitete auflage, Kohlenstoff; teil B-liefcrung 2, das element: graphit, system-nummer 14, Verlag chemie, Wienchheim, 1968, p. 698.
[15] L.G. Johnson, G. Dresselhaus, Phys. Rev. B 7 (1973) 2275. [16] K. Kokko, E. Ojala, K. Mansikka, Phys. Stat. Solidi B 153
(1989) 235.
[17] J.-P. Randin, E. Yeager, J. Electroanal. Chem. 36 (1972) 257. [18] J.-P. Randin, E. Yeager, J. Electroanal. Chem. 54 (1974) 93.
[19] H. Gerischer, R. McIntyre, D. Scherson, W. Storck, J. Phys. Chem. 91 (1987) 1930.
[20] H. Gerischer, J. Phys. Chem. 89 (1985) 4249.
[21] K.K. Cline, M.T. McDermott, R.L. McCreery, J. Phys. Chem. 98 (1994) 5314.
[22] H. Berg, Naturwissenschaften 47 (1960) 320. [23] H. Berg, Electrochim. Acta 13 (1968) 1249.
[24] H. Gerischer, E. Meyer, J.K. Sass, Ber. Bunsenges. Phys. Chem. 76 (1972) 1191.
[25] H. Gerischer, Ber. Bunsenges. Phys. Chem. 77 (1973) 771. [26] J.K. Sass, H. Gerischer, in: B. Feuerbacher, B. Fitton, R.F.
Willis (Eds.), Photoemission and the Electronic Properties of Surfaces, Wiley, Chichester, NY, 1978, p. 469.
[27] A.D. Modestov, J. Gun, O. Lev, Surf. Sci. 417 (1998) 311. [28] A. Kuznetsov, Charge Transfer in Physics, Chemistry and
Biol-ogy. Physical Mechanisms of Elementary Processes and an Intro-duction to the Theory, Gordon and Breach, New York, 1995. [29] H. Gerischer, J. Phys. Chem. 95 (1991) 1356.
[30] M. Shur, Physics of Semiconductor Devices, Prentice Hall: En-glewood Hills, New York, 1990, p. 74.
[31] D.C. Boudreaux, F. Williams, A.J. Nozik, J. Appl. Phys. 51 (1980) 2158.
[32] J.A. Turner, J. Manassen, A.J. Nozik, in: A.J. Nozik (Ed.), Photoeffects at Semiconductor – Electrolyte Interfaces, American Chemical Society, Washington, DC, 1981, p. 253.
[33] G. Cooper, J.A. Turner, B.A. Parkinson, A.J. Nozik, J. Appl. Phys. 54 (1983) 6463.
[34] J.A. Turner, A.J. Nozik, J. Phys. Lett. 41 (1982) 101. [35] C.A. Koval, R. Torres, J. Am. Chem. Soc. 115 (1993) 8368. [36] S. Kulmala, A. Kulmala, M. Helin, I. Hyppanen, Anal. Chim.
Acta 359 (1998) 71.
[37] S. Kulmala, T. AlaKleme, Anal. Chim. Acta 355 (1997) 1. [38] Y.E. Sung, F. Gaillard, A.J. Bard, J. Phys. Chem. B 102 (1998)
9797.
[39] S. Kulmala, T. AlaKleme, L. Heikkila, L. Vare, J. Chem. Soc. Faraday Trans. 93 (1997) 3107.
[40] Y.E. Sung, A.J. Bard, J. Phys Chem. B 102 (1998) 9806. [41] D. Diesing, S. Russe, A. Otto, M.M. Lohrengel, Ber. Bunsenges.
Phys. Chem. Chem. Phys. 99 (1995) 1402.
[42] D. Diesing, H. Janssen, A. Otto, Surf. Sci. A 333 (1995) 289. [43] H. Janssen, D. Diesing, A. Otto, Surf. Sci. B 333 (1995) 1267. [44] C. Chen, K.W. Frese, J. Electrochem. Soc. 140 (1993) 1355. [45] B. Hellsing, D.V. Charakov, L. Ostrlund, V.P. Zhdanov, B.
Kasemo, J. Chem. Phys. 106 (1997) 982.
[46] B. Hellsing, V.P. Zhdanov, J. Photochem. Photobiol. A 79 (1994) 221.
[47] K.M. Krishna, T. Soga, K. Mukhopadhyay, M. Sharon, M. Umeno, Sol. Energy Mat. 48 (1995) 25.
[48] A.A. Gewirth, A.J. Bard, J. Phys. Chem. 92 (1988) 5563. [49] C.A. Goss, J.C. Brumfield, E.A. Irene, R.W. Murray, Anal.
Chem. 65 (1993) 1378.
[50] R.J. Rice, R.L. McCreery, Anal. Chem. 61 (1989) 1637. [51] R.C. Wenst (Ed.), Handbook of Tables for Mathematics, fourth
edition, The Chemical Rubber Co., New York, 1994.
[52] M.T. McDermott, K. Kneten, R.C. McCreery, J. Phys. Chem. 96 (1992) 3124.
[53] Yu. V. Pleskov, Yu. Ya. Gurevich, Semiconductor Photoelectro-chemistry, Consultants Bureau, New York, 1986 Ch. 2. [54] A.J. Bard, L.R. Faulkner, Electrochemical Methods, Wiley, New
York, 1980 Ch. 1.
[55] J.O.M. Bockris, S.U.M. Khan, Surface Electrochemistry. A Molecular Level Approach, Plenum, New York, 1993 Ch. 5. [56] Yu. Ya. Gurevich, Yu. V. Pleskov, Z.A. Rotenberg,
Photoelec-trochemistry, Consultants Bureau, New York, 1980.
[58] V.A. Benderskii, A.M. Brodskii, Photoemission from Metals into Electrolytes, Nauka, Moscow, 1977 (Russian).
[59] J.L. Valdes, B. Miller, J. Phys. Chem. 93 (1989) 7275. [60] J.L. Valdes, B. Miller, J. Electrochem. Soc. 135 (1988) 2223. [61] A. Olivier, E. Merienne, J.P. Chopart, O. Aaboubi, Electrochim.
Acta 37 (1992) 1945.
[62] Z.A. Rotenberg, Russ. J. Electrochemistry 33 (1997) 221. [63] Z.A. Rotenberg, Russ. J. Electrochemistry 33 (1997) 142. [64] C.Y. Ho, R.W. Powell, P.E. Liley, J. Phys. Chem. Ref. Data 3
(1974) 279.
[65] M.R. Kagan, R.L. McCreery, Langmuir 11 (1995) 4041. [66] I. Mocros, E. Yeager, Electrochim. Acta 15 (1970) 953.
[67] A.L. Rotinyan, A.I. Anurova, N.B. Dobrozdrakova, Elek-trokhimiya 5 (1969) 1352.
[68] I.F. Hu, D.H. Karweik, T. Kuwana, J. Electroanal. Chem. 188 (1985) 59.
[69] T. Nagaoka, T. Sakai, K. Ogura, T. Yoshino, Anal. Chem. 58 (1986) 1953.
[70] Y. Oren, A. Soffer, J. Electroanal. Chem. 186 (1985) 63. [71] Y. Oren, A. Soffer, J. Electroanal. Chem. 206 (1986) 101. [72] C. Kozlowski, P.M. Sherwood, J. Chem. Soc. Faraday Trans. 81
(1985) 2745.
[73] M. Tomkiewicz, J. Electrochem. Soc. 127 (1980) 1518. [74] J.-N. Chazalviel, J. Electrochem. Soc. 129 (1982) 963.