Creative Components Iowa State University Capstones, Theses and Dissertations
Summer 2018
Development of K-12 Lessons Plans that Integrate Construction
Development of K-12 Lessons Plans that Integrate Construction
Engineering and Mathematics and Align with Educational
Engineering and Mathematics and Align with Educational
Standards
Standards
Nancy Nicho
Iowa State University, [email protected]
Follow this and additional works at: https://lib.dr.iastate.edu/creativecomponents
Part of the Architectural Engineering Commons, Construction Engineering and Management Commons, and the Curriculum and Instruction Commons
Recommended Citation Recommended Citation
Nicho, Nancy, "Development of K-12 Lessons Plans that Integrate Construction Engineering and Mathematics and Align with Educational Standards" (2018). Creative Components. 32.
https://lib.dr.iastate.edu/creativecomponents/32
1
Development of K-12 Lessons Plans that Integrate Construction Engineering and Mathematics and Align with Educational Standards
By
Nancy L. Nicho
Creative Component for the degree of MASTER OF SCIENCE
Interdisciplinary Graduate Studies (Architecture, Construction Engineering, Math Secondary Education)
Program of Study Committee:
Dr. Kristen S. Cetin, Major Professor Dr. Andrea Wheeler
Dr. Ji Yeong I
2
TABLE OF CONTENTS
ABSTRACT ... 4
INTRODUCTION ... 5
METHODOLOGY ... 7
Relation with Construction Engineering, Architecture, and Sustainability ... 9
Differentiated Lessons Plans ... 10
Addressing Specific Common Core State Standards ... 11
Related Factors That Encourage Students To Be Successful ... 12
DISCUSSION AND CONCLUSIONS ... 13
APPENDIX: LESSON PLANS ... 15
3
Acknowledgments
I am grateful to Dr. Kristen Cetin, my major advisor in the Department of Civil, Construction
and Environmental Engineering, for her positive attitude, willingness to share her knowledge,
and punctual and constructive feedback. She was an important part of my career success, she
motivated me to excel and be more productive. Thank you to my Committee Members, Dr.
Andrea Wheeler from the Architecture Department and Dr. Ji Yeong I from the School of
Education Department, for taking the time to review the paper, attend my presentation and
provide constructive comments to my work.
I want to thank my parents for teaching me about the value of education and to never give up
on my dreams; and thank you to my children because their happiness, love, and understanding
4
ABSTRACT
This research project works towards the integration of the fields of (a) math education, (b)
construction engineering and (c) architecture for the Interdisciplinary Graduate Study program.
These three topic areas are integrated into a single project which involves the development of
several lesson plans, with the goal of teaching K-12 students, through hands-on interactive
activities, about the design, construction, and operation of buildings within the built
environment. These lessons plans serve several purposes, specifically (1) to introduce students
to the concepts of architecture and construction engineering, particularly how these fields
encourage sustainability and comfort in the built environment, and (2) teach students how the
math they are learning in the classroom is directly applicable to these fields. The lesson plans
also align with the core standards and provide more resources to the educational field since
resources on the discussed topics are not widely available. This project specifically focuses on
5
INTRODUCTION
The Program for International Student Assessment (PISA), sponsored by the Organization for
Economic Cooperation and Development (OECD), is an international assessment that is taken
every three years and measures fifteen years old students’ skills in reading, mathematics, and
science. Of the 72 countries that participate, the United States was ranked 35th in 2015, as
compared to 28th in 2012. The findings of this study indicate that even though the
teacher-student relationships are positive in U.S. classrooms, high school teacher-students are generally not
motivated to excel in their math classes, nor are they motivated to pursue careers where Math
is an important skill that is needed to be successful. Given the significant need for STEM
(science, technology, engineering, and math) graduates in today’s society, particularly those
with strong Math skills, this presents future workforce challenges that must be addressed.
Many careers and fields require strong math skills, including the fields of Construction
Engineering and Architecture. Architects are responsible for the design and look of the built
environment, and Construction Engineers, as well as the broader Civil Engineering discipline,
are responsible for the built environment’s creation and sustained maintenance over the years
of operation. Math is very commonly used in these fields in many situations, particularly in
engineering. It is highly important to have a strong background in Math to be successful in these
careers. In Construction Engineering and Architecture, sustainability is an important topic. This
topic also coincides with the current generation’s general interest in helping people and the
environment.
Architecture and Construction Engineering have important roles in designing, constructing and
6
conditions, such as to predict how much energy the built environment uses. A topic that has
received little coverage, particularly in terms of translation to the K-12 curriculum, but has
become increasingly important, particularly in sustainable building standards, its occupant
comfort. In other words, the topic of how comfortable and satisfied people are living and
working in buildings (i.e., occupants). Since people in developed countries, including the U.S.,
spend nearly 90% of their time inside of buildings, their level of comfort is of particular
importance. This fact has increasingly been recognized in the building sustainability field as
sustainable building standards, and certifications move from a more strict focus on reduced
energy and environmental impact (e.g., LEED) to a broader focus on both the building and the
occupants which inhabit it. Certifications such as WELL work towards ensuring the building is
also providing a healthy and comfortable environment for occupants. Many of the concepts
associated with these efforts translate well to the development of K-12 lesson plans on
math-related topics. However, there has been little effort to date in this area. By utilizing applied
examples in this field in the K-12 classroom, it is also the hope that these lesson plans would
help to inspire students to be interested in STEM fields.
Despite the efforts to improve the grades, and the enthusiasm of the students for pursuing STEM
careers, still, there is a disconnect between what is taught in Math and Science curriculum at
the high school level. Science teachers rely on the fact that the students who are receiving their
classes have an interest in science or have the preparation level required for their subject. The
Math teacher teaches and prepares the lessons to plan without mentioned where exactly in
science the student will be using this knowledge. Many factors play into the learning process,
including curriculum design, students’ attitude towards Mathematics, and teacher’s attitudes
7
family and community support. One path to improving the students’ performance, is to design
for success where students are exposed to engineering subjects through a Math context. My
graduate degree in Interdisciplinary Graduate Studies has given me the opportunity to apply the
skills I learned in the subjects of Architecture, Civil Engineering, and Secondary Education
with a major in Math. At the same time, it has also resulted in the ability to, through the
developed lesson plans, demonstrate to students the importance of sustainability as is one of the
most important issues of this century.
This project specifically proposes early exposure of ninth and tenth-grade students to concepts
in building science. It develops lessons plans where students will learn the terminology used in
these fields. Through real-world problems and data, students will develop physical
representations and models related to buildings and thermal environments, and use real-world
tools and methods to assess and understand the built environment.
The remainder of this paper is divided into several sections, including the methodology section,
which explains the development of the lesson plans, copies of the lesson plans, and a discussion
and conclusions section which discusses the anticipated benefits of this work, and recommends
additional extensions on these efforts.
METHODOLOGY
Part of the purpose of this work is to demonstrate people in the educational sector that if we
want to encourage students to enter careers in engineering and/or science, teachers have to
present lessons plans and materials used by the teachers (following the Common Core State
Standards for Mathematics), at the student’s level, and in a smooth way. The goal is to present
8
retain the students’ interests who are already considering this path. The developed materials,
therefore, are presented in a format that is close to the typical format used by high school
teachers when developing their lesson plans. Many of the reference materials are also taken
directly from standards and other materials utilized today by engineers and architects in this
field (e.g., ASHRAE Standard 55 on Thermal Comfort). Additionally, the suggested extensions
of this work include discussions of careers in these areas as a part of the summary/close for
each lesson plan and suggestions for possible topics for future lesson plans in the conclusions.
The research design of this work is based on several factors as follows: (a) Relation with
Construction Engineering, Architecture, and Sustainability, (b) Differentiated Lessons Plans,
and (c) Addressing specific Common Core State Standards, as well as related factors that
encourage students to be successful. All of these factors were taken into account in the
development of the lesson plans, and all are discussed in this section in individual subsections.
The research inquiry in this work is the actual lessons plans, where the goal of the teachers is
to integrate Science, Engineering, and Math together, following the Common Core State
Standards, and to encourage the students to follow a career in the field of Science, Engineering
or Math, or other STEM fields. It is recommended to have the lessons plans prepared ahead of
time. In these lesson plans, apart from the content knowledge, the order in which the topics will
be presented and the key ideas that the lesson will present, it is very important to include a
warm-up section; this opening section is not just for introducing the new topic or refreshing
what was studied in the previous class, it is also for presenting the relevance of math and the
use of math in real-world situations. The methodology used in this work is qualitative, based
on the idea that “qualitative research requires the researcher to ponder and reflect on the data
9
Relation with Construction Engineering, Architecture, and Sustainability
Currently, there are some educational materials at the K-12 level related to engineering, but few
available related specifically to architecture, civil engineering, and construction engineering,
and the intersection of these fields. Yet at the same time there is a high demand in the civil and
construction industry currently: “The industry’s core around engineering and construction
alone employs approximately 100 millions people worldwide, and its nearly $10 trillions
annual revenue represents 6% of GDP (Gross Domestic Product)” (World Economic Forum,
2018). Sustainability is also an integral part of the construction and civil engineering industry,
particularly for buildings. Sustainability comes in many forms, part of which focuses on energy
conservation, and part of which focuses on balancing this conservation with comfort in
buildings. The Organization for Economic Cooperation and Development (OECD),
International Energy Agency (IEA) and Nuclear Energy Agency (NEA) support efforts towards
conservation of the production and consumption of energy, which will improve energy security.
(U.S. Mission to the Organization for Economic Cooperation & Development, 2018). Energy
has become one of the most important topics worldwide, and many efforts are currently being
pursued now to help improve energy efficiency. However, the current lifestyles also demand a
higher use of energy than previously, or approximately a 14% increase over 14 years
(International Energy Agency, 2007). Thus, there is a need for improved education in the
energy efficiency field as well. The IEA estimates that by the year 2030, buildings can save 20
Exajoule (EJ) if governments implement policies for the construction of the buildings with
performance standards (MEPS), net-zero energy consumption, improvements in building
10
(International Energy Agency, 2011). As discussed, for buildings, in particular, this is important
to balance with providing a comfortable and productive indoor environment for occupants.
In reviewing current building standards and construction requirements for buildings with the
goal of identifying materials to use for lesson plan development, some sources of K-12 type
activities were identified on the topics of energy efficiency and conservation. However, content
which specifically pulls from current standards and construction practices is limited, as is any
materials discussing the balance of energy and comfort requirements. Therefore, it was chosen
to work on this topic.
Differentiated Lessons Plans
Another aspect of the reviewed existing materials was the lack of discussion on differentiation;
because of this, a “modifications” section is included in each lesson plan. Math is different from
other subjects, where the teacher can designate alternative assignments to the students. In Math
all the students in a particular grade generally have to be working on the same topic; therefore
differentiation is recommended. As discussed by Johnson, “designed differentiation is the
deliberate act of modifying instruction or an assignment to customize the effect to match the
particular developmental level and skills of a student or group of students” (Johnson, 2009).
Teachers can differentiate lessons through content, process, product, and effect/environment.
Teachers who differentiate their lessons, consider learning readiness, personal interests, and
cultural aspect of their students in their lesson plans (Tomlinson, 2014). This effort began when
educators began trying to reach their students through applying differentiation; in the days of
one-room-schools. Efforts in recent history include the Individuals with Disabilities Education
11
classroom do differ mathematically in significant ways. Teachers want to be successful in their
instruction of all students. Understanding differences and differentiating instruction are
important processes for the achievement of that goal” (Mariam Small, 2010). In the proposed
lesson plans, differentiation is included to reach students at different levels with similar but
varying levels of content.
Addressing Specific Common Core State Standards for Mathematics
With the purpose to enhance the student learning, the Common Core State Standards was first
published in 2010. This approach to common standards across different states is convenient in
that students can move between states while still being held to similar levels. It represents a
measure for the states to compare their standard with other states and see to determine
similarities and differences. In summary for math standards, “the standards are meant to be a
blueprint for math instruction that is more focused and coherent. The focus and coherence in
this blueprint are largely in the way the standards progress from each other, coordinate with
each other and most importantly cluster together into coherent bodies of knowledge.
Crosswalks and alignments and pacing plans and such cannot be allowed to throw away the
focus and coherence and regress to the mile-wide curriculum” (Phil Daro, 2013). The NCTM
(National Council of Teachers of Mathematics) President J. Michael Shaughnessy (2010-2012)
remarked that this approach would not be something usual and said “with the inclusion of the
Standards for Mathematical Practice, we have been handed an opportunity to make some
significant changes in our mathematics instruction. And for the first time, we have an
opportunity to have cross-state, common mathematics assessment of our students’ progress in
both content and mathematical practices (NCTM, 2011). In this research, the relevant
12
lesson plans with standards they work to meet in their teaching. Even though each teacher has
to connect to their own state’s department of education, the standards are similar to benefit the
teacher receiving students from another state and students moving from state to state.
Related Factors That Encourage Students To Be Successful
To engage students in teaching content in STEM fields, such as those proposed in the developed
lesson plans, the process must be gradual and start from an early age and increase through high
school. Then if the student was not exposed to science when they were young, the transition
has to be smooth, and the lessons should not be saturated, like with advanced vocabulary.
“Traditional approaches to teaching and learning can suppress and smother interest and
creativity among many students who do not have resilience or support after early failures or
disappointing experiences in STEM subjects. Accordingly, some students dismiss themselves
from STEM subjects, majors, and careers based on experiences” (Egenrieder, 2010). In the
developed lesson plans, subject-specific vocabulary is introduced and defined for students.
However, there are only a few vocabulary words in each lesson. The approach should help to
ensure that students are learning new concepts but that they are not overwhelmed with new
words and content.
Another factor is engaging classes in practicing science or engineering subjects and at the same
time, making the connections with math. With only information about a math concept, or only
information about a science topic, students will ask where the subject will be used. “Teachers
present concepts and demonstrates techniques repeatedly but never understand why they are
important or useful” (John Dossey, 2002). Therefore, “it is important that the math teacher help
13
“the content and the processes learned in geometry class will be useful in pre-calculus.” (John
Dossey, 2002). Inside a broader STEM topic, teachers should not only mention that math and
science are used in this field, but should also mention more specific math fields like geometry,
algebra, or parts of these disciplines such as areas, proportions, and functions. Mentioning the
different areas of math provides specific connections between the STEM topic and the specific
math skills being learned. Following these recommendations, the developed lesson plans
include links between specific math skills and broader STEM topics.
DISCUSSION AND CONCLUSIONS
The subjects included in this research, including Math, Math Education, and STEM careers,
and in particular where these topics intersect, are currently of significant interest for furthering
education in the United States. This paper contributes to these fields with the aim of improving
Math Education and interest in STEM career choices. Some students tend to believe that they
do not need Math skills to be successful. This may be because they do not like Math, they are
scared of Math, or for other reasons. However, Math is necessary, and it is a life skill. The
question is who will teach and convince these students that Math is necessary? Primarily it will
be parents and teachers in charge of this task helping students develop good attitudes towards
Mathematics. Already developed lesson plans related to STEM careers benefit the teacher and
the student, saving time for the teachers who may utilize these plans, and providing students
with critical thinking opportunities that are not isolated from real-life situations and that show
that Math is meaningful.
Many teachers find that developing detailed lesson plans takes a lot of time to do successfully.
14
available for free to teachers. Teachers must make modifications to these lessons plans,
including adding essential elements, such as objectives, previous knowledge, Common Core
State Standards for Mathematics, engaging activities or discussion, differentiation, activities for
the lesson, assessment, and materials. The materials include readings, exercises or experiments
related to the topic being covered; for example, in this research content on Architecture and
Construction Engineering is included.
The construction industry and the civil engineering industry, in general, are two of the most
important industries in the development and maintenance of a country. These industries
continually upgrade their techniques and methods, because countries are always constructing
hospitals, airports, housing buildings, bridges, schools, and structures, as well as operating,
renovating and updating these facilities. The World Economic Forum announced the relevance
of this industry as follows: “The industry is expected to grow greatly in the coming years, to
estimated revenues of $15 trillion by 2025. More than 100 million people are already employed
today in construction worldwide.” (World Economic Forum, 2016). It is the hope of this effort
and future efforts that can build off of this, that further awareness and interest in the building,
civil and construction industries can be developed in Algebra I or in 9th grade. Further ideas for
topics to cover in lesson plans in this area could include statistics lessons, such as topics which
would review mean, variation and standard deviation, in the context of the construction
industry. These topics are used as a strategy to approximate the prices in a construction project
before companies bid on a project. Another possible topic to include in the lesson plans is
geometry, related to the design of a roof surface in order to achieve a net zero design; in this
15 APPENDIX: LESSON PLANS
Lesson Plan 1: Interpreting Functions and the Thermal Environment
Objective(s): Locate data in a table.
Identify the relationship between the input and output Interpret tables.
Grade Level Algebra I
Est. Time 50 minutes
Prerequisite
Knowledge:
Understand that a function includes a rule that assigns to each
input exactly one output. Graph a linear function.
Vocabulary: Line graph: A graphical representation using points connected by line segments to show how something changes over time.
Operative Temperature: A measure of the temperature inside of a building felt by people (occupants), based on temperature and airspeed. It is used to evaluate the thermal comfort of building occupants.
Occupants: Humans (people) who are inside of a building. Thermal Comfort: A subjective evaluation of the satisfaction of a person with the thermal environment; this is mainly influenced by several factors, including temperature, air speed, humidity, how much clothing is worn, and the activity level of a person.
Materials Needed:
[image:16.612.91.533.159.706.2]Thermometer
Table 1 Graph Sheet
16 Iowa Common
Core Content Standards for Mathematics
HS F.IF.A.1
Understand that a function from one set (called the domain) to another set (called the range) assigns to each element of the domain exactly one element of the range. If f is a function and x is an element of its domain, then f(x) denotes the output of f corresponding to the input x. The graph of f is the graph of the equation y = f(x).
Iowa Standards for
Mathematical Practices
SMP 2: Reason Abstractly and Quantitatively.
SMP 6: Attend to Precision
SMP 7: Look for and make use of the structure.
Resources/
References
https://iowacore.gov/content/mathematical-content-and-practice-standards
https://www.illustrativemathematics.org
http://community.ksde.org/Default.aspx?tabid=5646
Dejan Mumovic and Mat Santamouris, A Handbook of Sustainable Building Design & Engineering - An Integrated Approach to Energy, Health, and Operational Performance.
Lesson
Overview (2-3 sentences)
· The students will represent data in a graph and analyze the the relationship between the input and the output.
· The students will use a condition to interpret the data on a graph.
17
Opening Activity – Icebreaker (engage the student in the content)
Students will work in pairs, with a classmate from the next row. They will talk about how he/she feels when it is too cold or too hot in the room they are currently in. Did he/she ever feel uncomfortable or sick in certain room conditions, including different levels of temperature, humidity, air speed/air movement? All students will share their answers with the class. Once all responses are discussed, the idea of “thermal comfort” can be introduced and explained that these factors discussed all influence the thermal comfort of people inside of a building, the most important of which is temperature.
Explore(activities to explore the content)
● The students will use a thermometer to measure the temperature inside and outside the building, including at least three temperature measurements per each student. These will be compared with the data provided. Students will make comments about the temperatures provided and the temperatures they have measured.
● The data provided is as follows:
The daily mean outdoor temperature in °C (Group A)
8, 9, 10, 11,12, 13, 14, 15, 16, 17, 18,19, 20, 21, 22, 23, 24, 25, 26, 27, 28, 29, 30
● Acceptable indoor temperatures in °C (possible results) (Group B) 19, 20, 21, 22, 23, 24, 25, 26, 27, 28, 29, 30, 31, 32
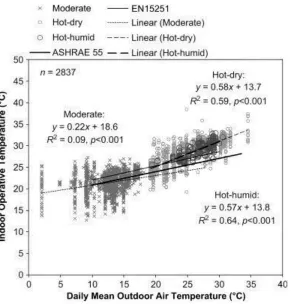
● The students will look at Fig. 1 about Indoor Operative Temperature and use the equation in this graphic for moderate climate (for Iowa) and the values in Group A to complete a numerical table (Table 1), to predict the Indoor Operative
Temperature.
18 Outdoor Air
Temp.
Indoor Operative Temp.
● Compare the values of Indoor Operative Temperature obtained from the equation with the possible values in Group B of the provided data, to see if they are close in value.
[image:19.612.175.468.337.641.2]● The students will represent the Indoor Operative Temperature as a function of the outdoor temperature with a graph and visualize the linear function.
19
Source: Frontiers of Architectural Research (2013) 2, 278–291
Development of an adaptive thermal comfort equation for naturally ventilated buildings in hot–humid climates using ASHRAE RP-884 database
Summary/Close of the lesson (highlight the important points of the lesson)
In-class-discussions about how they feel in a comfortable or uncomfortable room temperature, and if people can do anything about it?
Name and discuss professions in the field working to make our lives comfortable like Architecture, Civil Engineering, Construction Engineering, Environmental Engineering.
What does a linear function look like? A straight line. How do you determine if the equation is a linear function or a nonlinear function? Variable X is a zeroth degree. Variable X is first degree. Two examples of each one. Which one is considered a linear function?
Extension(s)
Represent the same table in Fahrenheit (convert from degrees C to degrees F)
T (∘ 𝐹) = 𝑇(∘ 𝐶) ∗ 9/5 + 32 Talk more about Fig 1.
● If you look at the figure, what do you see? Just dots each one represents a specific data point of data collected.
● What is the name of this graphic? Scatter plot.
● What do we call the line in Figure 1? Best fit, trendline. This line is a close representation of the data, but not 100%.
● Reading Ia, Ib
Check for Understanding (Assessment)
1. Name a set of Domain with its respective set of Range
Is the relationship between the input and output (a) direct, or (b) inverse or (c) is the graphic a flat line (i.e., no relationship).
2. Label the Graphic and interpret the results.
20 Modifications (IEPs, 504s, English learners)
The following are extra materials that could be used for this lesson:
504 students - Graphic organizer and extra time on assignment
English Language Learners - Work on extra short materials, for example, multiple
representations, build a table of values of the first ten outdoor temperatures and acceptable indoor temperatures, graph it and then give a report of the results in at least four sentences. The teacher can supply sentences frames to improve the mathematical language.
IEP students (Individualized Education Program) - The teacher must work with the student’s support group. If the student does not know how to read a thermometer, teach that first, then the student can take three temperatures inside and outside the classroom, and organize data.
Key Ideas
Key ideas/important points Teacher strategies/actions
Identify the relationship between the input and output.
Substitute a value for the variables in the formula: What students observe? For
each input we have one output.
A function has multiple representations, for example: tables, graphs.
Set the coordinates, observe the data, and according to the data, choose an appropriate scale for the graphical representation.
Use a function to predict values. How much will the output be given a determinate temperature (input) value?
Student Solution Strategies (What are three different ways that students will solve your task? One way to do this is to think about three solutions from least to most
sophisticated.)
Solution Strategy 1 Solution Strategy 2 Solution Strategy 3
Quick response, they do not use any coefficient in front
They experiment by themselves with Group A
21 of x and estimate the outputs
quickly.
and B without using the formula in Figure 1.
directions given.
Guiding Questions (Minimum 3 – focus on the mathematics and using open-ended questioning)
Good questions to ask Possible student responses or actions
Possible teacher responses
How is the trend of the input and outputs
Both are growing/increasing Yes, because there is a direct (positive) relationship between the variables
Why is it important to label your graphics
To remember what is represented in the
figure/graphic in this lesson
Yes, you remember what you did, but also you communicate your work to anyone reading it.
Misconceptions, Errors, Trouble Spots (Minimum 3 – focus on the mathematics)
Possible errors or trouble spots
When a student sees the graphic, they might think that one input can have several
outputs.
Teacher questions/actions to resolve them
22 Reading I
a) Thermal Environment and Health
Thermal conditions affect health. This is best illustrated by the rates of mortality in nursing homes (Marmor, 1978) and ordinary households (Rogot et al., 1992) during hot weather. When thermal conditions are less extreme, elevated temperatures have been associated with increased prevalence of symptoms typical of sick building syndrome (SBS), non-specific building-related symptoms of headache, chest tightness, difficulty in breathing, fatigue, and irritation of eyes and mucous membranes, which are alleviated when the individual left the building (WHO, 1983). The survey by Burge et al. (1990) in six office buildings showed that the occupants in buildings with lower dry bulb air temperature experienced fewer SBS symptoms. An intervention study by Burt (1996) showed that reducing the temperature from 22° C to 20.4° C reduced SBS symptoms. High air temperatures were found to be a risk factor for work-related general symptoms (headaches and difficulty in concentrations) in 14 office buildings studied by Skov et al. (1990)
Source: A Handbook of Sustainable Building Design & Engineering – an Integrating Approach to Energy, Health, and Operational Performance, Dejan Mumovic and Mat Santamouris, MPG Books Ltd. Bodmin; UK 2009; pg. 183-184.
b) Building Envelope and Thermal Properties
The building envelope is one of the most important parts of a building, from both the aesthetic as well as the performance perspective. Aesthetically, it is where the design team spends most of its time and effort and where the construction community provides the greatest amount of quality control. From the performance perspective, the role of the envelope is to separate the interior of the building from the exterior environment: heat and cold (i.e., thermal), air, water vapor, (liquid) water, noise, dust, insects, and so on. In addition to being structurally adequate, the envelope must mediate between the exterior and the interior of the building so that required interior environmental conditions can be achieved. In other words, the envelope must control the flow of heat/cold, air, vapor, water, noise, dust, and so on.
Twentieth-century advances in heating, ventilating, and air-conditioning (HVAC) equipment made it possible to achieve interior comfort independent of building form and climate. Advances in materials and their mass production allowed designers to build larger spaces and taller buildings. These factors, in conjunction with modern ideas about design, resulted in buildings that conformed to specific design aesthetics rather than considerations of site and climate. Similar design solutions were used everywhere in the world because the HVAC system allowed any design solution to be adapted to any climate. The resulting design freedom was fully exploited by architects to the extent that an all-glass exterior became a recognized facade formula, particularly for commercial buildings.
23
Lesson Plan 2: Interpreting Statements Using Function Notations and Thermal Comfort
Objective(s): Evaluate the input of a function.
Distinguish a pattern in a graphic. Interpret a function in a specific context.
Grade Level Algebra I
Est. Time 50 min.
Prerequisite
Knowledge:
Read the rate of change from a table or a graph.
Vocabulary: Thermal Neutral Zone: The thermal neutral zone is the range of temperatures in the immediate environment in which a healthy adult animal can maintain normal body temperature.
Context: the parts of a discourse that surround a word or passage and can throw light on its meaning
Materials Needed:
Readings
ASHRAE survey (see Appendix)
Iowa Common Core Content Standards
HSF-IF.A.2
Use function notation, evaluate functions for inputs in their domains and interpret statements that use function notation in a specific context.
Iowa Standards for
Mathematical Practices
SMP 4: Model with Mathematics SMP 6: Attend to Precision
Resources/
References
ASHRAE Standard 55: Thermal Environmental Conditions for Human Occupancy -
standard-55-thermal-environmental-conditions-24 for-human-occupancy
https://www.illustrativemathematics.org
Mathematics Methods and Modeling for Today’s Mathematics Classroom https://www.amazon.com/MathematicsMethods -Modeling-Todays-Classroom/dp/053436604X
Lesson
Overview (2-3 sentences)
Students will use formal language for functions
f(t) is not the function, it is an output value when the input value is equal to t.
Opening Activity – Icebreaker (engage the student in the content)
The students will work in pairs and will answer the thermal environment satisfaction survey, (from ASHRAE, see Appendix). One group of students will answer questions 1 to 4 and the second group of students will answer questions 5 to 8. The students will discuss and comment on why the survey designer needs all this information.
Explore(activities to explore the content)
● First students will read the information about Thermal Neutrality (see Appendix) ● Study the scatterplot of Indoor Operative Temperature (Use graphic representation in a
previous class and Activity I)
● Review the information is provided in the legend. What symbol represents a moderate climate? What is in the Domain? What is in the Range of the function?
● Read the second reading, what number is the formula for a moderate climate, is this formula is closest to formula number (2) or (3) in the reading.
Summary/Close of the lesson (highlight the important points of the lesson)
A function is a relationship between the input and the output. We can use the function to make predictions. What is the output if I use ten as an input in the formula? When will our output be negative?
Extension(s)
25 Check for Understanding (Assessment)
What is the relationship between the independent and dependent variables?
Why do you think it is important to study these issues on indoor temperature and the thermal comfort zone?
Modifications (IEPs, 504s, English learners)
504 students – Using the information in the graphic representation create a table. Also, students can fill out a graphic organizer where they can write down the symbol representing moderate, Hot-dry, Hot-humid climates, write the label of the x-axis.
English Learners - These students can summarize the information in the graphic in four sentences, using the words: output, input, diagram. This is an extra activity.
Key Ideas
Key ideas/important points Teacher strategies/actions
What is the output when the outdoor air temperature is 25?
Write the ordered pair for that (or any other specific) temperature.
For each input there is just one output; try to determine the output with the inputs of 19.5, 20 and 20.2
All of these inputs are close in value, do they have the same output?
Do you think all outputs values in the graphic are considered acceptable Operative Temperatures?
According to to the Predicted Mean Vote (PMV) model (see Appendix), we can say no.
26
Student Solution Strategies (What are three different ways that students will solve your task?
Solution Strategy 1 Solution Strategy 2
A student can draw a perpendicular line from temperature (e.g., 25 C) until they reach the line. From that point, they go to the left of the graph to get an approximation of the answer.
Student replaces the input (25 C) in the formula, make the calculations and find the answer using the equation.
Solution Strategy 1 Solution Strategy 2
Students can use the graphics methods used before; the outputs will not be the same value. Students will have to work with precision to accomplish this task using this method.
Students use the three inputs as the value of the variable in the formula and must obtain three different outputs (one for each input). Students should use up to four decimal points to see the difference in the output value.
Guiding Questions (Minimum 3 – focus on the mathematics and using open-ended questioning)
Good questions to ask Possible student responses or actions
Possible teacher responses
What happens in this function if the temperature value (input), decreases?.
The output will be different. The graphic of the line will fall left to right.
As the input and output are related, the graphic of the line will change its direction.
27
Misconceptions, Errors, Trouble Spots (focus on the mathematics)
Possible errors or trouble spots Teacher questions/actions to resolve them
The student thinks that this is a
multiplication problem (i.e., f(t) = f * t )
The teacher tests the students presenting f(t+4) to see if the students try to resolve to apply distributive property.
The students may confuse the interpretation of this function if they saw f(2+x)
Ask what is the interpretation of the output, and explain as needed.
28 Activity 1 -
[image:29.612.86.522.88.613.2]Multiple Representations
Tables Graphs Equations
Relationship
Direct Inverse
Rate of change ∆y/∆x
Slope
Positive Negative
Is increasing Is decreasing
29 First Reading – Second Lesson Plan
The main focus of this study was to determine the statistical relationship between indoor comfort temperature = Tcomf, and outdoor temperature = Tout. The expected linear equation (Eq. (1)) has outdoor temperature as its independent variable.
T comf = a T out + b (1)
Adaptive thermal comfort equation
A scatter diagram of observed indoor operative temperatures at thermal neutrality and the corresponding daily mean outdoor air temperatures is presented in Fig. 2. The existing major adaptive standards (ASHRAE, 2010; BSI, 2008) utilize operative temperature. It is clear that data for each climate have a distinguishable range of daily mean outdoor air temperatures. For hot–humid and hot–dry climates, their daily mean outdoor air temperatures are higher than approximately 20 °C degrees (Fig. 2) and extend to approximately 30 °C degrees and 35 °C degrees, respectively. In contrast, most of the data for moderate climate appear below the daily mean outdoor air temperature of 20 °C degrees (Fig. 2). The adaptive thermal comfort equations used for predicting neutral temperatures in respective climates are illustrated by discontinuous linear regression lines in Fig. 2. The comfort temperature lines for naturally ventilated buildings prescribed in ASHRAE Standard 55 (ASHRAE, 2010) and EN15251 (BSI, 2008) are also compared in the figure. The adaptive comfort equations underlying ASHRAE and EN15251 standards are
Tcomfop = 0.31 Toutmm + 17.8 (2)
Tcomfop = 0.33 Toutrm + 18.8 (3)
respectively, where Tcomfop is indoor comfort operative temperature (°C), Toutmm is monthly mean outdoor air temperature (°C), and Toutrm is running mean outdoor air temperature (°C) (de Dear and Brager, 2002; Nicol and Humphreys, 2010). Both equations share nearly the same regression coefficients (gradient). It is considered that both standards suggest a change in indoor comfort temperature per unit change of the outdoor temperature at a similar rate. The EN15251 equation consistently predicts a higher comfort temperature than that of the ASHRAE equation by one °C (Fig. 2).
The regression lines for hot–humid, hot–dry, and moderate climates are defined by the following equations, respectively:
Tneutop = 0.57 Toutdm + 13.8 (4)
Tneutop = 0.58 Toutdm + 13.7 (5)
Tneutop = 0.22 Toutdm + 18.6 (6)
30 Second Reading – Second Lesson Plan
31 Glossary
Dry Bulb Temperature: refers to the ambient air temperature. It is called "Dry Bulb" because the air temperature is indicated by a thermometer and not affected by the moisture of the air. Occupants: Humans (people) who are inside of a building.
Operative Temperature: A measure of the temperature inside of a building felt by people (occupants), based on temperature and airspeed. It is used to evaluate the thermal comfort of building occupants.
Thermal Neutral Zone: The thermal neutral zone is the range of temperatures in the immediate environment in which a healthy adult animal can maintain normal body temperature.
Thermal Comfort: A subjective evaluation of the satisfaction of a person with the thermal environment; this is mainly influenced by several factors, including temperature, air speed, humidity, how much clothing is worn, and the activity level of a person
Thermal neutrality: the indoor thermal index value corresponding with a mean vote of neutral on the thermal sensation scale.
32
References
Anita Hunter, P. L. (2002). Making Meaning: The Creative Component in Qualitative Research.
Qualitative Health Research, 12(3), 388-398.
Doris Hooi, T. K. (2013, September). Development of an adaptive thermal comfort equation for naturally ventilated buildings in hot–humid climates using ASHRAE RP-884 database.
Frontiers of Architectural Research, 278-291.
Egenrieder, J. A. (2010). Facilitating Student AutonomFacilitating Student Autonomy in Project-Based Learning to Foster Interest and Resilience in STEM Education and STEM Careers. JSTOR, 1-2. Retrieved from https://www-jstor-org
Hannah Pallusky, L. S. (2015, June 3). Human Thermoneutral Zone: Effects of Mild Heat Acclimation.
Extreme Physiology and Medicine, 1.
International Energy Agency. (2007). Energy Use in the New Millenium. Paris: IEA Publications.
International Energy Agency. (2011). 25 Energy Efficiency Policy Recommendations. paris: International Energy Agency.
John Dossey, S. M. (2002). Mathematics Methods and Modeling for Today's Mathematics Classroom. A Contemporary Approach to Teaching Grades 7-12. 43-57.
Johnson, B. (2009). Differentiated Instruction Allows Students to Succeed. Edutopia. Retrieved from https://www.edutopia.org
Mariam Small, A. L. (2010). More Good Questions: Great Ways to Differentiate Secondary
Mathematics Instruction. New York: Teachers College Press.
NCTM. (2011, May). Summing Up. Reston: NCTM.
Phil Daro, W. M. (2013). Achieve The Core. Retrieved from https://achievethecore.org/
Tomlinson, C. A. (2014). The Differentiated Classroom: Responding to the Needs of All Learners (Second ed.). Alexandria, VA: ASCD.
U.S. Mission to the Organization for Economic Cooperation & Development. (2018). U.S. Mission to
the OECD. Retrieved from https://usoecd.usmission.gov/
World Economic Forum. (2016). Shaping the Future of Construction, A Breakthrough in Mindset and
Technology. Geneva: World Economic Forum.
World Economic Forum. (2018). Shaping the Future of Construction-An Action Plan to solve the
Industry's Talent Gap. Geneva: Future of Construction. Retrieved 2018, from