10-2014
Dynamic Speed Feedback Signs
Shauna L. Hallmark
Iowa State University, [email protected]
Neal R. Hawkins
Iowa State University, [email protected]
Follow this and additional works at:
http://lib.dr.iastate.edu/intrans_techtransfer
Part of the
Civil Engineering Commons
This Report is brought to you for free and open access by the Institute for Transportation at Iowa State University Digital Repository. It has been accepted for inclusion in Tech Transfer Summaries by an authorized administrator of Iowa State University Digital Repository. For more information, please [email protected].
Recommended Citation
Dynamic Speed Feedback Signs
Abstract
Dynamic speed feedback sign (DSFS) systems are traffic control devices that are programmed to provide a message to drivers exceeding a certain speed threshold. A DSFS system typically consists of a speed-measuring device, which may be loop detectors or radar, and a message sign that displays feedback to drivers who exceed a predetermined speed threshold. The feedback may be the driver’s actual speed, a message like “SLOW DOWN,” or activation of a warning device such as beacons or a curve warning sign.
For more on this topic by these authors, see also "Evaluation of Dynamic Speed Feedback Signs on Curves: A National Demonstration Project":http://www.trb.org/main/blurbs/172092.aspx
Keywords
85th percentile speed, Before and after studies, Crash analysis, Countermeasures, Crash analysis,
Demonstration projects, Evaluation, Highway curves, Highway Safety, Rural highways, Speed Control, Speed signs, Safety, Traffic control devices, Traffic safety
Disciplines
Civil Engineering
Comments
Please note: this summary is part of the website Synthesis of Safety-Related Research <<a
href="http://www.ctre.iastate.edu/research-synthesis/" target="_blank">http://www.ctre.iastate.edu/ research-synthesis/> which brings together a number of individual reports available in the InTrans collections in this repository.
Authors
Shauna L. HallmarkDirector, Institute for Transportation, and Professor, Civil, Construction, and Environmental Engineering,
Iowa State University
515-294-5249, [email protected]
Neal Hawkins
Director, Center for Transportation Research and Education, Iowa State University
Sponsors
Iowa Department of Transportation Federal Highway Administration (InTrans Project 12-452)
For More Information
Center for Transportation Research and Education
Iowa State University 2711 S. Loop Drive, Suite 4700 Ames, IA 50010-8664
515-294-8103
www.intrans.iastate.edu/
SPR RB04-013
Description
Dynamic speed feedback sign (DSFS) systems are traffic control devices that are programmed to provide a message to drivers exceeding a certain speed thresh-old. A DSFS system typically consists of a speed-measuring device, which may be loop detectors or radar, and a message sign that displays feedback to drivers who exceed a predetermined speed threshold. The feedback may be the driv-er’s actual speed, a message like “SLOW DOWN,” or activation of a warning de-vice such as beacons or a curve warning sign.
Dynamic speed feedback signs are also referred to as dynamic warning signs, radar speed signs, radar message signs, electronic speed signs, and dynamic speed display signs.
One of the main advantages is that DSFS systems can specifically target drivers who are speeding rather than providing a message to all drivers. In this way, the system “interacts” with an individual driver, which may lead to better
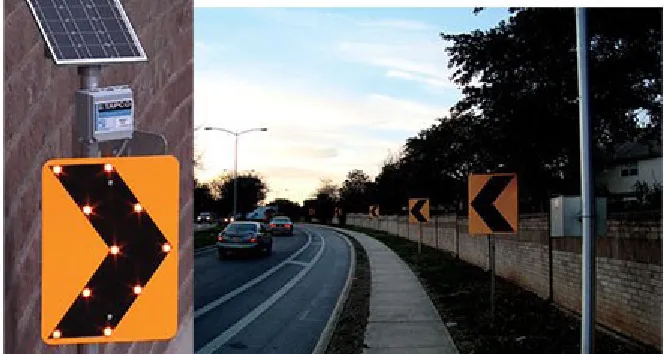
[image:3.612.232.564.529.706.2]compli-Dynamic Speed Feedback Signs
Figure 1. Sequential dynamic curve warning system (FHWA 2012)
ance because the message appears more personalized.
It alerts drivers that they are speeding while creating a sense of being mon-itored. These devices may also slow drivers who have radar detectors.
DSFS systems have been used to reduce vehicle speeds successfully and, sub-sequently, crashes in applications like traffic calming on urban roads.
2
[image:4.612.32.580.365.501.2]Dynamic Speed Feedback Signs
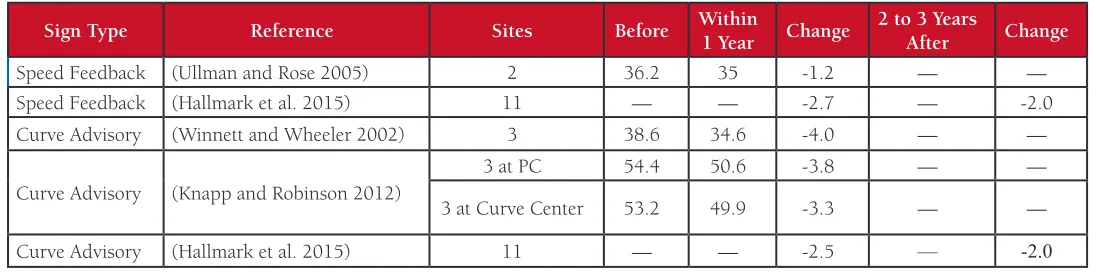
Table 2. Summary of Changes in 85th Percentile Speed (mph) with DSFS System Table 1. Summary of Changes in Mean Speed (mph) with DSFS System
Sign Type Reference Sites Before Within
1 Year Change
2 to 3 Years
After Change
Speed Feedback (Ullman and Rose 2005) 2 36.2 35 -1.2 — — Speed Feedback (Hallmark et al. 2015) 11 — — -2.7 — -2.0 Curve Advisory (Winnett and Wheeler 2002) 3 38.6 34.6 -4.0 — —
Curve Advisory (Knapp and Robinson 2012)
3 at PC 54.4 50.6 -3.8 — — 3 at Curve Center 53.2 49.9 -3.3 — — Curve Advisory (Hallmark et al. 2015) 11 — — -2.5 — -2.0
Sign type Reference Sites Before Within
1 Year Change
2 to 3 Years After
Change
4+ Years After
Change
Speed/Slow (Bellevue 2009) 1 35.5 31 -4.5 — — 31.0 -4.5
Speed Feedback (Bellevue 2009) 2 42.2 38.0 -3.3 38.0 -4.2 35.0 -6.3
Speed Feedback (Ullman and Rose 2005) 2 41.5 40 -1.5 — — — —
Speed Feedback (Hallmark et al. 2015)
11 — — -2.7 — -2.3 — —
Curve Advisory 11
—
—
-2.4—
-2.0—
—
Curve Advisory (Knapp and Rob-inson 2012)
3 at PC 60.8 56.6 -4.2 — — — —
3 at Curve
Center 60.1 56.6 -3.5 — — — —
for roadway scenarios where lane departures are a concern are described in the following sections.
Table 1 summarizes the various studies for changes in mean speed while Table 2 summaries the results of changes in 85th percentile speeds for the various studies.
Effectiveness of DSFS Systems for Speed Management (Iowa Studies)
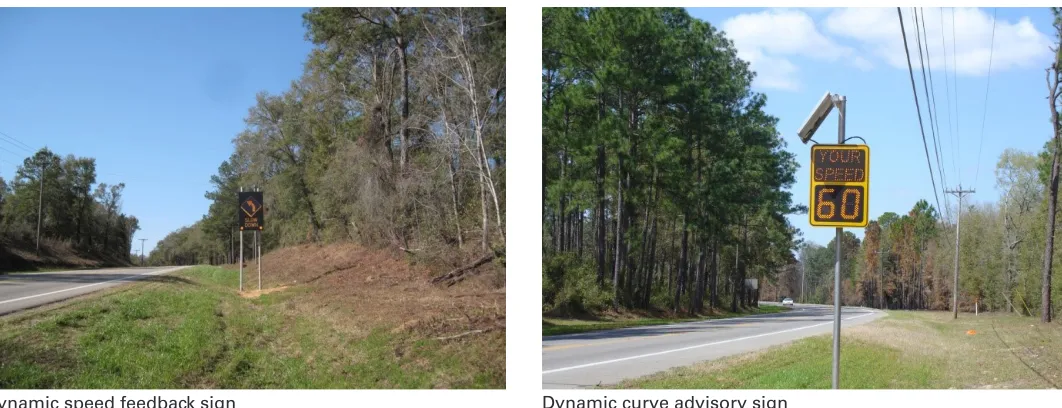
One study was conducted in Iowa that evaluted the effective-ness of two different types of DSFS systems in reducing speed and crashes on rural two-lane curves (Hallmark et al. 2013). One curve displayed a regular speed feedback sign when drivers exceeed the posted or advisory speed and the other displayed the corresponding speed avisory sign when the driv-er exceeded the posted or advisory speed (see Figure 2). Signs were also installed at 22 curves on rural two-lane roads in seven states (11 of each sign type) (Hallmark et al. 2015). Tan-gent speed limits ranged from 50 to 70, and advisory speeds ranged from no advisory speed to 50 miles per hour (mph). Volumes ranged from 346 to 5,506 vehicles per day (vpd) with the majority having less than 2,000 vpd.
Placement
Devices are placed in the location where a reduction in speed is desired. They may also be used in transition zones to slow traffic in advance of lower speed areas. Given DSFS systems are often expensive, they have typically been applied selectively to high-crash locations.
Sign placement should be placed based on perception-reaction, deceleration, and the expected reduction in speed so that the sign can be placed so drivers have time to adjust their speed. A clear line of sight to the radar or video equipment is also necessary (Ray et al. 2008).
Effectiveness of DSFS Systems in
Reducing Speeds
[image:4.612.36.579.543.728.2]3
[image:5.612.44.575.332.536.2]Dynamic speed feedback sign Dynamic curve advisory sign
Figure 2. Dynamic speed feedback sign evaluated in seven sates (Hallmark et al. 2015)
Speeds were compared before installation of the signs and then at 1, 12, and 24 months after. Speeds were compared at the point of curvature and center of curve. Table 3 shows the average change in speeds across all 22 sites.
As noted, the average decrease in mean at the point of cur-vature (PC) ranged from 1.8 to 2.6 mph over the three time periods at the PC of the curves and ranged from 1.8 to 2.1 at the center of curve. Similarly, the average decrease in 85th per-centile speeds across the three time periods ranged from 2.2 to 2.9 at the PC and 1.6 to 1.9 at the center of the curve.
The decrease in the fraction of vehicles traveling 5, 10, 15, or 20 or more mph over the advisory speed, if present, or posted speed if no advisory speed was present, is also shown in Table 3. As indicated, the average decrease in the frac-tion of vehicles traveling 5 mph over the advisory or posted speed limit ranged from 12 to 20 percent across the 1-, 12-, and 24-month periods after installation at the PC and ranged from 20 to 28 percent at the center of curve. The fraction of vehicles traveling 10 or more mph over ranged from 29 to 34
percent at the PC and 33 to 42 percent at the center of curve. The decrease in the fraction of vehicles traveling 15 or more mph over ranged from 30 to 36 percent at the PC and 37 to 57 percent at the center of the curve. The fraction of vehicles traveling 20 or more mph over the advisory or posted speed limit decreased by 29 to 50 percent at the PC and 14 to 37 percent at the center of curve.
As noted, moderate reductions were noted in the mean and 85th percentile speeds. The reductions were sustained across the two year period that the signs were evaluted. Signficant decreases in the fraction of vehicles traveling at various thresh-olds over the advisory or posted speed limit were observed, and these changes were also sustained over time.
Effectiveness of DSFS Systems for Speed Management (Other National Studies)
[image:5.612.36.578.601.725.2]The City of Bellevue, Washington (2009) evaluated DSFS systems on urban two-lane roads (25 to 35 mph speed limits). Two different types of signs were evaluated: one with YOUR
Table 3. Average Speed Changes Across Sites at the PC (Hallmark et al. 2015)
At PC of Curve At Center of Curve
1 Month 12 Months 24 Months 1 Month 12 Months 24 Months
Average Mean Speed (mph) -1.8 -2.6 -2.0 -2.1 -1.7 -1.8
Average 85th Percentile Speed -2.2 -2.9 -2.2 -2.5 -1.6 -1.9
Average Change in Fraction of Vehicles Exceeding Posted or Advisory Speed By:
5 mph -12% -19% -20% -28% -20% -26%
10 mph -30% -34% -29% -42% -33% -42%
15mph -36% -36% -30% -57% -37% -44%
4
SPEED signing and a DSFS displaying the vehicle speed for vehicles traveling over the posted speed limit. Speed results for curve sites are shown in Table 4.
The average reduction in 85th percentile speed was 4.2 mph for data collected 12 months after installation of the signs. Signs were installed between 2001 and 2008. An average speed reduction of 6.3 mph was noted when data were collected four to eights years after the signs were installed.
The second sign type displays a specific static message, YOUR SPEED, and the vehicle speed for vehicles traveling over the posted speed limit up to a certain threshold. Once that threshold is reached, the sign then displays the message SLOW DOWN.
One curve location had this sign type (see Table 4). As noted, the average decrease in 85th percentile speed was 4.5 mph within the first year after installation. This reduction was sus-tained four or more years after installation.
Preston and Schoenecker (1999) also evaluated the safety effect of a DSFS system on Minnesota State Highway 54, which is a two-lane rural roadway with a speed limit of 55 mph and an annual average daily traffic (AADT) of 3,250 vpd. The curve had an advisory speed of 40 mph.
The DSFS system had a changeable message sign and radar unit. The researchers conducted a field test over a four-day period with a unit that consisted of a closed circuit TV camera, a VCR, and a personal computer. A portable trailer housed the entire system.
The sign displayed the following information:
• CURVE AHEAD from 6 to 10 a.m., 11 a.m. to 2 p.m., and 4 to 7 p.m.
• No message during other times of the day unless activat-ed.
The team randomly evaluated whether vehicles negotiated the curve successfully based on curve messages. Vehicles that crossed a left or right lane line on one or more occasions were defined as not navigating the curve successfully.
[image:6.612.35.578.87.224.2]The team found that about 35 percent of the drivers who received the static message were unable to negotiate the curve successfully. Vehicles that received the CURVE AHEAD sign were more likely to negotiate the curve successfully, but the difference was not statistically significant. Only 26 percent of vehicles that received the CURVE AHEAD – REDUCE SPEED sign were unable to negotiate the curve successfully, and the difference was statistically significant at the 90 percent level of confidence.
Figure 3: DSFS on curve in the UK (© TRL (Transport Research Laboratory) 2002, from Winnett and Wheeler 2002)
Site
Speed Limit (mph)
Before 1 to 6
Months Change
12
Months Change
2 to 3
Years Change
4+
Years Change Speed Sign
Sammamish/117th 35 43 40 -3
Sammamish/Vasa 30 41.3 38 -3.3 36 -5.3 35 -6.3
Average for speed sign 42.2 38.0 -3.3 38.0 -4.2 35.0 -6.3
Speed/SLOW sign
[image:6.612.315.560.436.705.2]Phantom/160th 25 35.5 31 -4.5 31 -4.5
Table 4. 85th Percentile Speed (mph) Results for DSFS in Bellevue, WA (2009)
5
Table 5. Results for DSFS Systems on Curves along County Roads in Minnesota (Knapp and Robinson 2012)
Site Vpd
Posted/ Advisory
Speed (mph)
Mean (mph) 85th Percentile Speed (mph)
Before 1 Month Change Months12 Change Before 1 Month Change Months12 Change
Point of Curvature
25 630 55/NA 53.4 51.7 -1.7 54.5 1.1 59.3 58.4 -0.9 61.5 2.2
3 455 55/40 53.9 48.2 -5.7 45.1 -8.8 61.8 53.9 -7.9 51 -10.8
7 710 55/50 55.8 53.4 -2.4 52.2 -3.6 61.3 58.4 -2.9 57.2 -4.1
Average -3.3 -3.8 -3.9 -4.2
Center of Curve
25 630 55/NA 56.2 51.9 -4.3 52.5 -3.7 63.2 59 -4.2 60 -3.2
3 455 55/40 51.5 47.9 -3.6 45.2 -6.3 59.3 54.2 -5.1 52.4 -6.9
7 710 55/50 52.0 51.3 -0.7 52.1 0.1 57.7 56.3 -1.4 57.4 -0.3
Average -2.9 -3.3 -3.6 -3.5
Ullman and Rose (2005) evaluated the effectiveness of DSFS systems at two curves on two-lane roadways. The signs displayed the static message YOUR SPEED and the vehicle’s speed. The tangent speed was 55 mph and the advisory speed was 20 mph. Results are shown in Table 6. As noted, the aver-age decrease was 1 to 3 mph for mean speed and about 2 mph for 85th percentile speeds.
Effectiveness for Speed Management (International
Studies)
A vehicle-activated curve warning sign was tested on three curves on two-lane roads in the United Kingdom as shown in Figure 3 (Winnett and Wheeler 2002). The signs were blank when drivers were under the 50th percentile speed. As shown Knapp and Robinson (2012) evaluated the impacts of a
[image:7.612.35.581.574.698.2]dy-namic curve warning sign on three curves on rural two-lane roadways in Minnesota. The sign is similar to the one shown in Figure 3. The three sites were along county roads with volumes ranging from 455 to 710 vpd. Data were collected be-fore, at 1 month and 12 months after installation of the signs. Results are listed for the point of curvature and center of curve in Table 5. As noted, the average reduction at 1 month was 3.3 at the PC and 2.9 at the center of curve. The average change in 85th percentile speed at 1 month was -3.9 mph at the PC and -3.6 at the center. Similar results were found at 12 months with an average change in mean speed of -3.8 at the PC and -3.3 at the center of curve with an average decrease in 85th percentile speed of 4.2 at the PC and 3.5 mph at the center of curve.
Table 6. DSFS Systems on Rural Two-Lane Curves (Ullman and Rose 2005)
Site Time Period Mean Speed (mph) 85th Percentile Speed (mph)
Before After Change Before After Change 1
1 Week 35.3 33.2 -2.1 41 38 -3
2 37.1 33.6 -3.5 42 40 -2
Average 36.2 33.4 -2.8 41.5 39 -2.5
1
4 Months 35.3 32.9 -2.4 41 38 -3
2 37.1 37.1 0 42 42 0
6
in Table 7, mean speeds were reduced by 2.1 to 6.9 mph, and the authors note that speed reductions were maintained over time. The average decrease was 4 mph.
Effectiveness of DSFS in Reducing
Crashes
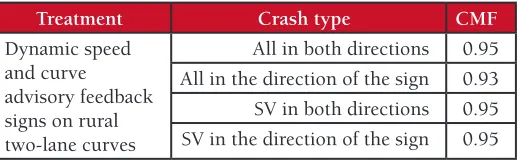
Hallmark et al. (2013) also compared crashes before and after installation of the DSFS on rural two-lane curves and devel-oped crash modification factors (CMFs) using a Bayesian analysis. Control sites were also included. Depending on the direction and type of crash, reductions from 5 to 7 percent resulted (see Table 8). No other U.S. studies were found that evaluated crash reduction for DSFS for lane departure applica-tions.
A study in the United Kingdom (Winnett and Wheeler 2002) conducted a simplistic analysis of DSFS on curves (see Table 9). Crash data were available for two sites and the researchers found that crashes decreased from 3.2 personal
Dynamic Speed Feedback Signs
Treatment Crash type CMF
Dynamic speed and curve
advisory feedback signs on rural two-lane curves
[image:8.612.38.297.497.577.2]All in both directions 0.95 All in the direction of the sign 0.93 SV in both directions 0.95 SV in the direction of the sign 0.95
Table 8. CMFs for Dynamic Speed Feedback Signs (Hallmark et al. 2013)
Treatment Sites Crash Type Change in Crashes
Dynamic curve advi-sory feedback signs on rural two-lane
curves (UK)
2 Personal Injury -54% to -100%
Table 9: Change in Crashes for Dynamic Speed Feedback Signs (Winnett and Wheeler 2002)
injury crashes per year to 1.5 (54 percent) at one site and from 0.7 to 0 (100 percent) at the other.
Advantages
• Do not physically affect vehicle operation • Do not have an impact on emergency vehicles • Do not impact drainage
• Can be moved and used at different locations when portable
• Provide a sense of enforcement • May be implemented immediately
Disadvantages
• DSFS have high initial cost
• They require regular maintenance and a power source • Motorists may speed up to see how fast they can go (can
be addressed by only posting speeds in a certain range) • Drivers may become immune to them if overused with no
perception of further enforcement
Appropriateness
Dynamic speed feedback signs are appropriate for most road-ways.
Cost
Dynamic speed signs cost from $2,000 to $11,000 per display.
References
City of Bellevue Transportation Department, Washington. Sta-tionary Radar Sign Program: 2009 Report. 2009.
FHWA. Sequential Dynamic Curve Warning System. Federal Highway Administration, Highways for Life. www.fhwa.dot. gov/hfl/partnerships/safety_eval/brochure_tapco.cfm. 2012. (Last accessed February 2015).
Hallmark, Shauna L., Neal Hawkins, and Omar Smadi. Eval-uation of Dynamic Speed Feedback Signs on Curves: A National Demonstration Project. Federal Highway Administration, 2015.
Hallmark, Shauna, Neal Hawkins, and Omar Smadi. Toolbox of Countermeasures for Rural Two-Lane Curves. Center for Trans-portation Research and Education, Ames, IA, 2012.
Hallmark, Shauna, Neal Hawkins, and Omar Smadi. Toolbox of Countermeasures for Rural Two-Lane Curves (Revised Final Report). Center for Transportation Research and Education, Ames, IA, 2013.
Knapp, Keith K. and Ferrol Robinson. The Vehicle Speed Impacts of a Dynamic Horizontal Curve Warning Sign on Low-Volume Local Roadways. Minnesota Department of Trans-portation, 2012.
Sites Speed limit (mph)
Mean speed (mph)
Before After Change
Norfolk 30 36.7 29.8 -6.9
Wiltshire 60 38.3 35.3 -3.0
W Sussex 50 40.9 38.8 -2.1
Average 38.6 34.6 -4.0
7
About the Center for Transportation Research and Education
The mission of the Center for Transportation Research and Education (CTRE) at Iowa State University is to develop and implement innovative methods, materials, and technologies for improving transportation efficiency, safety, reliability, and sustainability while improving the learning environment of students, faculty, and staff in transportation-related fields.
The sponsors of this research are not responsible for the accuracy of the information presented herein. The conclusions expressed in this publication are not necessarily those of the sponsors.
Iowa State University does not discriminate on the basis of race, color, age, ethnicity, religion, national origin, pregnancy, sexual orientation, gender identity, genetic information, sex, marital status, disability, or status as a U.S. veteran. Inquiries regarding non-discrimination policies may be directed to Office of Equal Opportunity, Title IX/ADA Coordinator, and Affirmative Action Officer, 3350 Beardshear Hall, Ames, Iowa 50011, 515-294-7612, email [email protected].
Preston, Howard and Ted Schoenecker. Potential Safety Effects of Dynamic Signing at Rural Horizontal Curves. Minnesota Local Road Research Board, 1999.
Ray, Brian, Wayne Kittelson, Julia Knudsen, Brandon Nevers, Paul Ryus, Kate Sylvester, Ingrid Potts, Douglas Harwood, Da-vid Gilmore, Darren Torbic, Fred Hanscom, John McGill, and Delbert Stewart. NCHRP Report 613: Guidelines for Selection of Speed Reduction Treatments at High-Speed Intersections. Trans-portation Research Board, Washington, DC, 2008.
Ullman, G. L. and E. R. Rose. “Evaluation of Dynamic Speed Display Signs.” Transportation Research Record 1918 (2005): 92-97.