www.biogeosciences.net/10/7207/2013/ doi:10.5194/bg-10-7207-2013
© Author(s) 2013. CC Attribution 3.0 License.
Biogeosciences
Photobleaching as a factor controlling spectral characteristics of
chromophoric dissolved organic matter in open ocean
Y. Yamashita1, 2, Y. Nosaka2, K. Suzuki1, 2, H. Ogawa3, K. Takahashi4, and H. Saito5
1Faculty of Environmental and Earth Science, Hokkaido University, N10, W5, Kita-ku, Sapporo, Hokkaido 060-0810, Japan 2Graduate School of Environmental Science, Hokkaido University, N10, W5, Kita-ku, Sapporo, Hokkaido 060-0810, Japan 3Atmosphere and Ocean Research Institute, The University of Tokyo, 5-1-5, Kashiwanoha,
Kashiwa-shi, Chiba 277-8564, Japan
4Graduate School of Agricultural and Life Sciences, The University of Tokyo, 1-1-1, Yayoi,
Bunkyo-ku, Tokyo, 113-8657, Japan
5Tohoku National Fisheries Research Institute, Fisheries Research Agency, 3-27-5 Shinhama-cho, Shiogama 985-0001, Japan
Correspondence to: Y. Yamashita ([email protected])
Received: 10 May 2013 – Published in Biogeosciences Discuss.: 19 June 2013
Revised: 11 September 2013 – Accepted: 11 October 2013 – Published: 12 November 2013
Abstract. Chromophoric dissolved organic matter (CDOM) ubiquitously occurs in marine environments and plays a sig-nificant role in the marine biogeochemical cycles. Basin scale distributions of CDOM have recently been surveyed in the global ocean and indicate that quantity and quality of oceanic CDOM are mainly controlled by in situ production and photobleaching. However, factors controlling the spec-tral parameters of CDOM in the UV region, i.e., specspec-tral slope of CDOM determined at 275–295 nm (S275−295)and the ratio of two spectral slope parameters (SR); the ratio of S275−295 toS350−400, have not been well documented. To evaluate the factor controlling the spectral characteristics of CDOM in the UV region in the open ocean, we determined the quantitative and qualitative characteristics of CDOM in the subarctic and subtropical surface waters (5–300 m) of the western North Pacific. Absorption coefficients at 320 nm in the subarctic region were higher than those in the subtropi-cal region throughout surface waters, suggesting that magni-tudes of photobleaching were different between the two re-gions. The values of S275−295 andSR were also higher in the subtropical region than the subarctic region. The dark microbial incubation showed biodegradation of DOM little affected S275−295, but slightly decreased SR. On the other hand, increases inS275−295and relative stableness ofSRwere observed during photo-irradiation incubations respectively. These experimental results indicated that photobleaching of CDOM mainly induced qualitative differences in CDOM at
UV region between the subarctic and subtropical surface wa-ters. The results of this study imply thatS275−295can be used as a tracer of photochemical history of CDOM in the open ocean.
1 Introduction
Chromophoric dissolved organic matter (CDOM) ubiqui-tously occurs in the open ocean (Kitidis et al., 2006; Nelson et al., 2007, 2010; Swan et al., 2009; Yamashita and Tanoue, 2009). CDOM is one of the major factors controlling optical properties of seawater (Siegel et al., 2002; Nelson and Siegel, 2013), and thus, controls the light penetration, especially, in the UV region (Fichot et al., 2008; Nelson and Siegel, 2013), which affects the primary production and microbial produc-tion, and also the structure of the marine food web (Smith et al., 1992; Herndl et al., 1993; Häder et al., 1998). CDOM is also known to be an important player in biogeochemical cy-cles since it is photo-reactive and is destroyed upon exposure to sunlight, producing inorganic carbon, volatile species such as carbonyl sulfide, and bioavailable low molecular weight DOM (Mopper and Kieber, 2002).
considered to be produced autochthonously through various biological processes (Nelson et al., 2004; Steinberg et al. 2004; Ortega-Retuerta et al., 2009; Shank et al., 2010), and the primary local source of CDOM has been assigned to mi-crobial activity (Nelson et al., 2004; Yamashita and Tanoue, 2004). From the global distribution of CDOM, microbially produced CDOM has been considered biologically refractory components with the time scale of the thermohaline circula-tion (Nelson et al., 2007, 2010; Yamashita and Tanoue, 2008; Swan et al., 2009), and thus, CDOM has been suggested as a tracer of deep ocean biogeochemical processes and circu-lation (Nelson et al., 2007, 2010). As such, the distribution of CDOM in the open ocean is basically controlled by a bal-ance between autochthonous production and photobleaching under the influence of transport by vertical mixing, ventila-tion, and upwelling of water masses.
The composition of CDOM can be determined by the spectral slope parameter (S), andS of CDOM in the open ocean has known to be different among sources (Kitidis et al., 2006; Yamashita and Tanoue, 2009).Shas also known to change with photobleaching (Swan et al., 2012) or diagenesis (Nelson et al., 2007) of CDOM. Thus,Scan be legitimately employed to address CDOM “history” including the sources and biogeochemical processing. However, lack of standard method to determine theSlimits its usefulness since its value depends on the wavelength range for estimation (Carder et al., 1989; Stedmon et al., 2000; Twardowski et al., 2004). Recently, the ratio of the spectral slope parameters (SR) ob-tained from two wavelength ranges, i.e.,Sat 275 to 295 nm (S275−295)to 350 to 400 nm (S350−400), was introduced as an index of molecular weight of DOM and/or photobleaching history (Helms et al., 2008). TheSRhas been widely applied to evaluating the environmental dynamics of DOM in terres-trial aquatic environments (e.g. Yamashita et al., 2010a, b; Osburn et al., 2011; Mladenov et al., 2011) as well as coastal environments (Guéguen et al., 2011; Shank and Evans, 2011; Romera-Castillo et al., 2013). In addition,S275−295was suc-cessfully used as a retrieval method of DOC concentration and as a tracer of terrestrial DOC in river-influenced ocean margin (Fichot and Benner, 2011, 2012; Fichot et al., 2013). SinceS275−295can be measured with high precision due to relatively high absorbance levels in this wavelength range (Helms et al., 2008), these spectral parameters may also be used as a tracer of water masses and biogeochemical history of CDOM in the open ocean where CDOM levels are quite low (Nelson et al., 2007, 2010; Swan et al., 2009; Yamashita and Tanoue, 2009). Although changes in SR andS275−295 along with photobleaching of deep ocean DOM have recently been reported (Stubbins et al., 2012; Helms et al., 2013), the distribution of these parameters has not been evaluated in the open ocean thus far.
Since the levels of CDOM in the open ocean are basi-cally controlled by microbial production, photobleaching, and transport as mentioned above, the levels of CDOM in the surface water is higher in subpolar regions compared
[image:2.595.331.521.67.258.2]SA-A-1 SA-A-2 SA-M-1 SA-M-2 SA-J-1 SA-J-2 ST-1 ST-2 ST-3 STP
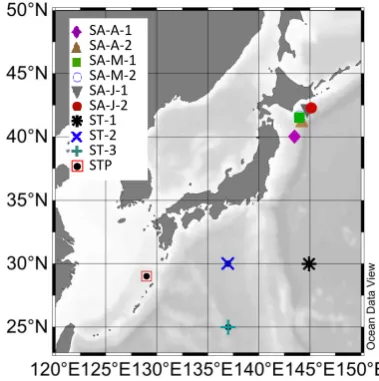
Fig. 1. Sampling locations. Samples for photo-irradiation
experi-ments were collected from the station located at 29.0◦N, 129.0◦E (STP).
with subtropical regions due to extensive photobleaching of CDOM at subtropical regions (Nelson et al., 2007, 2010; Swan et al., 2009; Yamashita and Tanoue, 2009). Thus, it can be hypothesized thatSRandS275−295in the subpolar surface water are different from those in the subtropical surface wa-ter due to different photobleaching history of CDOM, and thus, these parameters can be used as biogeochemical trac-ers in the open ocean. In this study, we determined the spec-tral characteristics of CDOM, includingSRandS275−295, in the upper 300 m of the subarctic and the subtropical regions at the western North Pacific. In addition, in order to exam-ineSRandS275−295as potential biogeochemical tracers, the changes in CDOM spectral characteristics along with pho-tobleaching of CDOM and microbial degradation of DOM were evaluated.
2 Materials and methods
2.1 Observation and sample collection
Sampling locations are shown in Fig. 1. Samplings of the subarctic region were carried out at 2 stations (SA-A-1, SA-A-2) on 20 April 2010 by the R/V Wakataka-maru (WK1004), at 2 stations (SA-J-1, SA-J-2) from 9 to 11 June 2010 by the R/V Wakataka-maru (WK1006), and at 2 sta-tions (SA-M-1, SA-M-2) from 10 to 11 May 2011 by the R/V Tansei Maru (KT-11-07). Samplings of the subtropical region were carried out at 3 stations (ST-1, ST-2, ST-3) from 19–20 May 2010 during the R/V Hakuhou Maru cruise (KH-10-01).
Table 1. Sample details for dark microbial incubations and photo-irradiation experiments.
Depth Temp. Chla a320 S275−295 S350−400
Experiment Type Location (m) (◦C) Salinity (µg L−1) (m−1) (nm−1) (nm−1) SR
SAM-1 Microbial incubation 41.7◦N, 144.0◦E 5 4.5 32.88 1.22 0.284 0.0303 0.0141 2.15
SAM-2 Microbial incubation 41.5◦N, 144.0◦E 5 4.4 32.99 2.06 0.398 0.0279 0.0136 2.05
STP-1 Photo-irradiation 29.0◦N, 129.0◦E 400 14.3 34.52 0.158 0.0294 0.0134 2.20
STP-2 Photo-irradiation 29.0◦N, 129.0◦E 766 5.7 34.35 0.216 0.0216 0.0127 1.70
CTD carousel system equipped with Niskin bottles. The plas-tic in-line filter holder that contained pre-combusted (450◦C, 3–5 h) glass fiber filter (0.7 µm of nominal pore size, What-man GF/F,) was attached directly to the spigot of Niskin bot-tles, and seawater was gravity filtered into pre-combusted glass vial with teflon-lined cap after triple rinsing. The sam-ples were then stored frozen in the dark until analysis. All the equipment, except glassware were pre-soaked in 5–10 % HCl and rinsed thoroughly with Milli-Q water.
Chlorophylla(Chla) concentrations were determined us-ing two methods. For samples form the subarctic region, high-performance liquid chromatography (HPLC) was used following Endo et al. (2013). Chlaconcentrations at the sub-tropical region were determined by the fluorometric method of Welschmeyer (1994).
2.2 Microbial incubation experiments
To evaluate the changes in CDOM quantity and quality dur-ing microbial degradation of bioavailable DOM, seawater bottle incubation experiments were performed according to Hasegawa et al. (2010). Seawater samples were collected from 5 m at two stations in the subarctic region on 10 May 2011 during the KT-11-07 cruise (Table 1). Seawater was gravity filtered using GF F filter into pre-cleaned 20 L poly-carbonate bottles after triple rinsing, and the filtrate was then dispensed into 24 pre-combusted glass bottles with teflon-lined caps after triple rinsing. Half of the glass bottles con-taining the GF/F filtrate were incubated in the dark room tem-perature (16–25◦C) and others were incubated in the dark in a refrigerator (1–6◦C) that was close to surface seawa-ter temperature (Table 1). Triplicate samples for each treat-ment were sequentially collected at 10, 20, and 40 days from a set of experimental bottles and filtered using pre-combusted GF/F filter, and then stored frozen in the dark until analysis.
2.3 Photo-irradiation experiments
Seawater samples were collected from 400 m and 766 m at the subtropical region (Fig. 1, Table 1) on 19 November 2012 during the cruise of R/V Tansei Maru (KT-12-31). The large surface area 0.2 µm capsule filter (HCl pre-cleaned AcroPak, Pall) was attached directly to the spigot of Niskin bottles, and seawater was gravity filtered into pre-cleaned 9 L poly-carbonate bottles after triple rinsing. The filtrate was kept in the dark at∼4◦C until photo-irradiation experiments
con-ducted on land. Eighteen 50 mL quartz bottles were filled with the filtered seawater sample after triple rinsing. Then, 9 out of the 18 bottles were wrapped with aluminum foil. The quartz bottles containing the filtrate were incubated in the water bath on the roof of the Environmental Science build-ing, Hokkaido University (43.1◦N, 141.3◦E) under natural sunlight for 13 days. The water bath maintained a tempera-ture between 3 and 10◦C throughout the irradiation during daytime, and the quartz bottles were kept in the refrigera-tor (∼4◦C) during nighttime. On the days of 2, 6, and 13 of the incubation, three replicate samples for each treatment were allowed to stand in the dark until reaching near room temperature (approx. 23◦C), and then, absorbance analyses were carried out without further filtration. The global solar radiation was measured by a pyranometer (SR507, Field Pro) installed on the roof of the Environmental Science building. The cumulative irradiance was 23, 60, and 87 MJ m−2for 2, 6, and 13 days, respectively.
2.4 Absorbance measurements
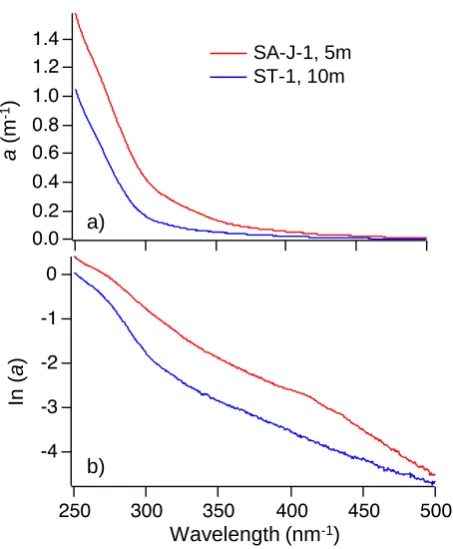
Water samples were thawed and allowed to stand until reach-ing room temperature (approx. 23◦C) prior to absorbance measurements. Absorbance spectra were obtained between 200 and 1000 nm at 0.5 nm intervals using a spectropho-tometer (UV-1800, Shimadzu). A 10 cm quartz-windowed cell was used for the absorbance analysis. Due to limited sample volumes, a 5 cm quartz-windowed cell was used for the samples obtained from photo-irradiation experiments. Absorbance spectra of a blank (Milli-Q) and samples were obtained against air, and a blank spectrum was subtracted from each sample spectrum. Sample spectra were baseline-corrected by subtracting average values ranging from 590 to 600 nm from the entire spectrum (Yamashita and Tanoue, 2009), and then converted to absorption coefficients, a(λ) (m−1)(Green and Blough, 1994). CDOM absorption spec-tra are declining exponentially with wavelength (Fig. 2) and have usually been fit to an exponential function as follows (Green and Blough, 1994):
a(λ)=a(λi)e−S(λ−λi),
wherea(λ) anda(λi) are the absorption coefficients at wave-lengthλand reference wavelengthλi(m−1), respectively.S
Wavelength (nm-1)
a)
a
(m
-1)
In
(
a
)
b)
[image:4.595.52.279.62.337.2]SA-J-1, 5m ST-1, 10m
Fig. 2. Typical absorption spectrum at the subarctic (SA-J-1, 5 m)
and the subtropical (ST-1, 10 m) regions: (a) on a linear scale and
(b) on a logarithmic scale.
parameter of CDOM (Yamashita and Tanoue, 2009). TheSR value, the ratio of theS obtained from the two regions, 275 to 295 nm (S275−295)and 350 to 400 nm (S350−400), was cal-culated according to Helms et al. (2008).
Specifications for the spectrophotometer (UV-1800) pro-vided by the manufacture are as follows; photometric re-peatability is less than ±0.001 optical density (OD) unit at an absorbance of 0.5 OD and noise level is less than 0.00005. The 0.001 OD corresponds to absorption coeffi-cients of 0.023 and 0.046 (m−1)for 10 cm and 5 cm measure-ments, respectively. These values occur around 350–400 nm and 400–450 nm for the subtropical and subarctic surface waters, respectively (Fig. 2). We also determined errors as-sociated with the spectrophotometer by triplicate measure-ments of two subtropical surface waters with 5 cm cells. The results (average±standard deviation) were as follows; Sample 1:a(320)=0.108±0.003 m−1,S275−295=0.0408
±0.0004 nm−1, S350−400= 0.0131 ±0.0004 nm−1, SR= 3.11±0.08, and Sample 2: a(320) =0.082 ±0.003 m−1,
S275−295= 0.0459 ± 0.0004 nm−1, S350−400= 0.0164 ± 0.0018 nm−1,SR=2.82±0.35. Thus, even though we only used the 5 cm cell for photo-irradiation experiments of deep water samples that contained relatively high levels of CDOM (Table 1), the results ofS350−400andSRmight have relatively large analytical errors.
3 Results
3.1 Vertical profiles of salinity, temperature, and Chla
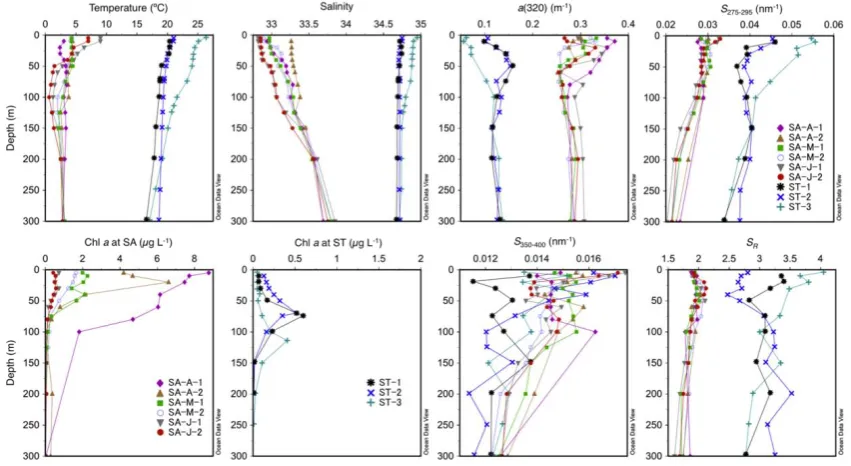
Salinity ranges in the upper 300 m water column of the sub-arctic region were 32.9–33.7, 32.9–33.8, and 32.9–33.7 in April, May, and June, respectively (Fig. 3). Temperature ranged from 2.4 to 4.5◦C in April, 2.0 to 4.7◦C in May, and 0.6 to 9.0◦C in June. These water masses could be catego-rized as a cold subarctic Oyashio water according to the cri-terion of a temperature of < 5◦C at a depth of 100 m (Kawai, 1972). The Oyashio is a mixture of the western boundary cur-rent of the western subarctic gyre in the North Pacific and the Sea of Okhotsk (Yasuda, 2004). Chla concentrations were different among the sampling periods, i.e.,∼8.8 µg L−1 in April,∼2.3 µg L−1in May, and∼0.7 µg L−1in June. From the Chlaconcentration, April, May, and June could be cat-egorized as spring bloom, decline of the bloom, and post bloom phase, respectively (Saito et al., 2002).
Salinity and temperature at 3 stations of the subtropical region ranged from 34.7 to 35.0 and 16.6 to 26.4◦C, respec-tively. The highest temperature and salinity were evident in the upper 150 m waters at ST-3 near the central part of the subtropical gyre. Chlaconcentrations at the subtropical re-gion were quite low (less than 0.6 µg L−1)compared to the subarctic region and showed subsurface maxima at 74, 70 and 114 m at ST-1, ST-2, and ST-3, respectively.
3.2 Vertical profiles of CDOM quantity and quality
Levels of CDOM were higher in the subarctic region com-pared with the subtropical region (Fig. 2). a(320), ranged from 0.253 to 0.372 m−1 in the subarctic region and from 0.056 to 0.159 m−1 in the subtropical region (Fig. 3). The values ofa(320) in each region were similar with those in the subarctic and subtropical surface waters of the central North Pacific, respectively (Yamashita and Tanoue, 2009) and were similar with or slightly higher thana(325) in the surface wa-ters of the Pacific (Swan et al., 2009). In the subarctic region, the levels of a(320) and Chl a in the upper water column (∼50 m) were higher than those in the lower water column irrespective of differences in sampling periods. However, the temporal change in a(320) in the upper water column did not coincide with that in Chlaconcentrations in the Oyashio waters. The lowest value ofa(320) in this study was found at ST-3 in the subtropical region. At ST-3,a(320) tended to increase with depth. The levels ofa(320) at 1 and ST-2 showed subsurface maxima at 50 m which were shallower than the subsurface Chlamaxima.
Fig. 3. Vertical profiles of temperature, salinity, chlorophyllaconcentration,a(320),S275−295,S350−400, andSRat the subarctic region
(SA) and the subtropical region (ST). Note: ranges ofx-axis for chlorophyllaconcentration were different between SA and ST.
in the upper 100 m at ST-3, compared with the subarctic re-gion (0.0203–0.0330 nm−1)but decreased with depth, irre-spective of differences in oceanic regions (Fig. 3). The val-ues ofS275−295at the subarctic region were similar irrespec-tive of differences in sampling periods, even thoughS275−295 of surface water (5–10 m) in June were slightly higher than those in April and May. The range ofS275−295 observed in this study was higher than those in river waters (Helms et al., 2008; Spencer et al., 2012), butS275−295in the subarc-tic waters were similar to those found in the Hudson Bay and Hudson Strait (Guéguen et al., 2011; Granskog, 2012).
S275−295 in the subtropical waters were similar to those in the high salinity Gulf of Mexico waters (Fichot and Benner, 2012) as well as surface water (5 m) of the central North Pa-cific (Helms et al., 2013).
S350−400 tended to decrease as depth increased irrespec-tive of difference in oceanic regions, and the values were not different between the subarctic and subtropical regions. The ranges ofS350−400 (0.0114 to 0.0174 nm−1for all samples) found in this study were relatively smaller than those found in river waters (Helms et al., 2008; Spencer et al., 2012), but were similar with those found in the high salinity Gulf of Mexico waters (Fichot and Benner, 2012).
Significant difference inSR, basically due to difference in S275−295, was also evident between the subarctic and the sub-tropical waters. Interestingly, vertical profiles ofSR in the subarctic region showed small subsurface maxima at depths between 30 and 80 m. Vertical profiles ofSRdid not show any clear increase or decrease trends among the 3 stations in the subtropical region. The range ofSRfound in the
sub-arctic waters (1.61–2.12) was similar to those found in deep ocean DOM (Stubbins et al., 2012; Helms et al., 2013) but was generally higher than that in the river waters (Helms et al., 2008; Yamashita et al., 2010a, b; Spencer et al., 2012) and in the Hudson Bay (Granskog, 2012). TheSRin the sub-tropical waters ranged from 2.48 to 4.05. These values were similar to that found for the Georgia Bight but smaller than that found for the surface waters of the Sargasso Sea and the central North Pacific (Helms et al., 2008, 2013).
3.3 Changes in CDOM during dark microbial incubations
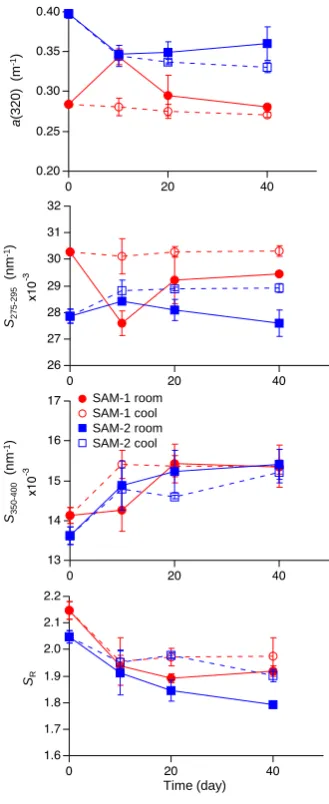
a(320) sharply increased for first 10 days, and then decreased from 10 to 40 days for the SAM-1 room incubation. Such changes in CDOM quantity during dark incubations could be explained by the combination of degradation of bioavail-able fraction and microbial production (Nelson et al., 2004; Biers et al., 2007). The magnitudes of change in a(320) (∼0.067 m−1)during 40 day incubations were comparable to its spatial and temporal differences observed in the surface waters of the subarctic region (Fig. 3).
S275−295did not change systematically during incubations. Compared with the initial values (d=0), the changes in
S275−295were less than 0.0011 nm−1during 40 days incuba-tions with one exception (0.0027 nm−1for SAM-1 room at 10 days). The magnitudes of change inS275−295during dark incubations were quite small compared with the ranges ob-served for vertical differences (∼0.01 nm−1at the subarctic region,∼0.02 nm−1at the subtropical region, Fig. 3). On the other hand,S350−400increased throughout the incubations at increments of 0.0012–0.0018 nm−1 for 40 day. The net in-crements inS350−400 during incubation were comparable to those found for vertical differences in the subtropical and the subarctic regions (Fig. 3). As a result of changes inS275−295 andS350−400,SRcontinued to decrease during incubations. The net decrements ofSRduring 40 day incubations (0.15– 0.26) were similar with vertical differences found in the sub-arctic region (Fig. 3).
3.4 Changes in CDOM during photo-irradiation experiments
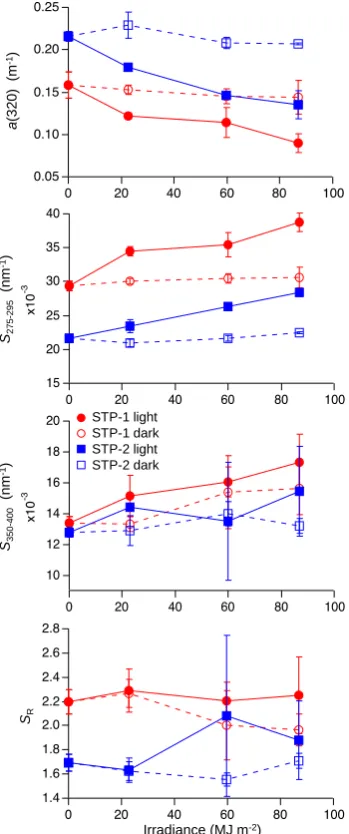
Levels ofa(320) were decreased for light treatments but not for dark experiments during photo-irradiation experiments (Fig. 5), indicating the photobleaching of CDOM during nat-ural sunlight irradiation. The net decreases ina(320) were 0.068 and 0.081 m−1for STP-1 and STP-2 light experiments, respectively. Such magnitudes of decrease in a(320) for 13 day photo-irradiation were comparable to its spatial and temporal differences found in the surface waters of the sub-arctic region (Fig. 3). During the photobleaching of CDOM,
S275−295continued to increase with the increment of 0.0093 and 0.0067 nm−1 for 13 day STP-1 and STP-2 light exper-iments, respectively. It should be noted that this range was one order of magnitude greater than that found during 40 day dark microbial incubations. On the other hand, the values of S275−295 were constant throughout the experiments for STP-1 and STP-2 dark experiments.S350−400also tended to increase with increment of 0.0027–0.0039 nm−1 for 13 day during photobleaching of CDOM, even though the values were largely scattered among the three replicates.S350−400 at dark treatments also tended to increase for 13 days exper-iments, implying that increases inS350−400observed during photobleaching of CDOM might be overestimated. As a re-sult,SRdid not exhibit large variations for the three replicates throughout the photo-irradiation experiments.
a
(320)
(
m
-1)
S275
-295
(nm
-1)
S350
-400
(nm
-1)
SR
[image:6.595.343.508.66.469.2]Time (day) SAM-1 room SAM-1 cool SAM-2 room SAM-2 cool
Fig. 4. Changes ina(320),S275−295,S350−400, andSRduring dark
microbial incubation experiments of the subarctic surface waters for 40 days.
4 Discussion
4.1 Factors controlling the CDOM level at the subarctic and the subtropical region
50 m (R= −0.39,p=0.04,n=29), implying that the con-tribution of terrestrial CDOM was much smaller as compared with autochthonous CDOM.
The accumulation of DOC along with phytoplankton bloom events has been observed for the Oyashio waters of the subarctic region (Hasegawa et al., 2010). On the other hand, the levels of CDOM, namelya(320), in the subarctic region did not change along with phytoplankton bloom events, i.e., bloom (April), the decline of bloom (May), and post bloom (June) phases, indicating that major factors controlling the bulk DOM and CDOM levels are different and phytoplank-ton is not major source of CDOM in this study area (Fig. 3). At the BATS site in the Sargasso Sea, the seasonal cycle of CDOM level has been considered the result of photobleach-ing, winter convective mixphotobleach-ing, and production during het-erotrophic recycling of organic carbon rather than primary production (Nelson et al., 1998; Nelson and Siegel, 2002). The microbial production of CDOM has also been observed during microbial culture experiments (Nelson et al., 2004; Biers et al., 2007; Ortega-Retuerta et al., 2009). On the other hand, various biological sources, i.e., zooplankton (Stein-berg et al., 2004; Ortega-Retuerta et al., 2009), cyanobacteria Trichodesmium spp. (Steinberg et al., 2004), and dinoflagel-lates (Vernet and Whitehead, 1996) have been considered as sources of CDOM. The CDOM derived from such specific sources usually have a distinct peak in absorbance spectra. In the present study, distinct peaks were not evident in CDOM spectra (Fig. 2). In addition, spectral slope parameters, i.e.,
S275−295,S350−400, andSR, were not different among sam-pling periods in the subarctic region, suggesting that het-erotrophic microbial regeneration, rather than phytoplank-ton and zooplankphytoplank-ton activity, seems to be a major source of CDOM for the Oyashio waters at the subarctic region.
The higher levels of CDOM in the upper-50 m waters com-pared with 50–30 m waters were possibly due to higher mi-crobial production. Kobari et al. (2010) reported that bacte-rial abundance and growth were not related to Chla concen-tration during the spring phytoplankton bloom events in the Oyashio region. The active regeneration with high bacterial production was observed after the peak of primary produc-tion during in situ iron enrichment experiments conducted at the subarctic region of the western North Pacific (Kudo et al., 2009). However, in the present study, the highest levels of CDOM did not occur during the decline of bloom (May) or post bloom (June) phases. Such a temporal pattern of CDOM level suggests that degradation of newly produced CDOM is an important factor controlling the CDOM level in the Oy-ashio waters at the subarctic region. The photobleaching that causes a decrease in CDOM level occurs with a time scale of hours to days (Fig. 5; Swan et al., 2012). The microbial cul-ture incubation experiments have highlighted the production of a bioavailable CDOM fraction that is quickly degraded by microbes within days (Nelson et al., 2004; Biers et al., 2007). Our dark microbial incubation experiments also showed net decrease in CDOM with one exception (Fig. 4). These pieces
of evidence suggested that major fractions of newly produced CDOM might disappear rapidly due to the photobleaching and/or microbial degradation. Interestingly, subsurface max-ima of CDOM levels were clearly observed for 20–30 m at SA-J-1 and SA-J-2 (Fig. 3), suggesting either photobleach-ing dominated in surface waters (< 20 m) or freshly produced CDOM accumulated in the subsurface layer (20–30 m) dur-ing the post bloom phase.
The levels of CDOM in the subtropical region were lower than those in the subarctic region throughout the water col-umn (Fig. 3). Such differences in CDOM level (subarc-tic > subtropical) have also been found for basin scale obser-vations of CDOM (Kitidis et al., 2006; Nelson et al., 2007; 2010; Swan et al., 2009; Yamashita and Tanoue, 2009) as well as satellite observations of CDOM (e.g. Siegel et al., 2002; Bricaud et al., 2012). Low levels of CDOM in the lower water column due to contribution of mode water have also been observed in subtropical regions (Nelson et al., 2007, 2010; Yamashita and Tanoue, 2009; Swan et al., 2009). The low levels of CDOM found in the subtropical region has been explained by extensive photobleaching of CDOM due to the long residence time of surface waters in the subtropi-cal gyres with high insolation (Swan et al., 2009). Seasonal variability of vertical profiles and characteristics of fluores-cent DOM in the subtropical region of the western Pacific were also explained by deep winter mixed layer and the ex-tensive photobleaching (Omori et al., 2010, 2011). Thus, dif-ferent levels of CDOM found between the subarctic and the subtropical regions in this study can be explained mainly by differences in photobleaching degree of CDOM between the regions.
Subsurface maxima of CDOM level were found at ST-1 and ST-2 in the subtropical region (Fig. 3). These maxima are possibly due to the results of photobleaching and micro-bial production of CDOM as discussed above. However, at the southern most ST-3, lowest level of CDOM, possibly due to extensive photobleaching, was found in the surface wa-ter (5–10 m) and the CDOM level increased with depth be-low the surface water. It should be noted that ST-3 is near the central part of the subtropical gyre, and consequently, the upper water column at ST-3 is relatively stratified through-out the year compared with ST-1 and ST-2. In addition, the upper water column at ST-3 characterized as high salinity suggests longer exposure to sunlight in the sea surface. Inter-estingly, in the water column between 150 to 300 m, levels of CDOM as well as salinity and temperature were within a narrow range, suggesting that the same water mass was dis-tributed for 150–300 m at the 3 stations.
4.2 Spectral characteristics of CDOM as a biogeochemical tracer in the open ocean
subarctic and the subtropical regions (Fig. 3). The values of
S275−295 were different between the subarctic and the sub-tropical regions. Such differences in S275−295 between the two oceanic regions was consistent with the results of photo-irradiation experiments, i.e., an increase inS275−295 along with photobleaching of CDOM (Fig. 5). In addition, the lowest level of CDOM found at ST-3, possibly due to ex-tensive photobleaching, was accompanied with the highest
S275−295. Even though changes in S275−295 during photo-irradiation experiments using oceanic DOM have scarcely been reported, an increase in S275−295 was also observed during photo-irradiation experiment of the North Atlantic Deep Water (Stubbins et al., 2012). More recently, Helms et al. (2013) conducted a photo-irradiation experiment using deep ocean (near Hawaii) sample concentrated by reverse os-mosis with electrodialysis and found thatS275−295increased with photobleaching of deep ocean CDOM. Ortega-Retuerta et al. (2010) conducted the photo-irradiation incubations us-ing Southern Ocean waters and found thatS275−295 exhib-ited a net increase over the incubation where photobleach-ing was the dominant process, whereas that did not show this trend in the incubations where photohumification (photo-induced transformation) was observed. Increases inS275−295 have also been observed during photobleaching of terrestrial and coastal DOM (Helms et al., 2008; Zhang et al., 2009b; Osburn et al., 2011; Fichot and Benner, 2012). From the relationships betweenS275−295 and salinity observed at the northern Gulf of Mexico, Fichot and Benner (2012) sug-gested that photobleaching is a major process regulating
S275−295in surface waters regardless of origin, i.e., marine or terrigenous.
It appearsS275−295 changed slightly but did not exhibit systematic a increase/decrease trend during dark microbial incubation (Fig. 4). The slight decrease in S275−295 was found during microbial incubation of river water (Helms et al., 2008). Fichot and Benner (2012) found the slight decrease in S275−295 (1–2.4 %) during microbial incuba-tion of ambient coastal DOM. They also conducted the mi-crobial incubation experiments of ambient coastal DOM (that S275−295 values were 0.0168–0.0196 nm−1) with ad-dition of protein-rich plankton DOM obtained from a di-atom bloom (thatS275−295was 0.0259 nm−1)and found that S275−295decreased moderately with degradation of highly la-bile, protein-rich plankton DOM. These experimental results suggest thatS275−295is not changed significantly by micro-bial degradation (modification) of bioavailable DOM, even though highly labile, protein-rich DOM shows relatively high
S275−295values. Therefore,S275−295can be used as a tracer of photochemical history of CDOM in the open ocean.
The increase inS275−295during photobleaching of terres-trial and coastal CDOM has been considered the result of high molecular weight CDOM into low molecular weight CDOM (Helms et al., 2008). This increase, however, could also be explained by the solar radiation spectrum and ab-sorption spectra of CDOM. Del Vecchio and Blough (2002)
found that the primary (direct) loss of CDOM absorption oc-curred at the irradiation wavelength, with smaller secondary (indirect) losses occurring outside the irradiation wavelength using monochromatic radiation. Using polychromatic radia-tion that is comparable to solar radiaradia-tion, they also found that the relative loss of CDOM absorption was greater at longer wavelengths due to (1) the greater photons at longer wave-lengths and (2) the higher rates of indirect absorption loss at longer wavelengths. Fichot and Benner (2012) pointed out that the S275−295 increase with greater indirect loss of ab-sorption at 295 nm compared to 275 nm during irradiation under the natural solar radiation, because the position of the 275–295 nm window is the outer edge of the incident solar spectrum. In fact, Swan et al. (2012) estimated the absorbed quanta by CDOM (Qa)that was calculated by solar simu-lator spectrum and oceanic CDOM absorption spectra and found thatQawas sharply increased from 300 nm, peaked at 320–325 nm, then gradually decreased toward 450 nm. Such spectral characteristics of solar radiation and CDOM cause less photobleaching at the shorter wavelength region, and thus, increase inS275−295during photobleaching of CDOM. The difference between the subarctic and the subtropical regions was also found forSR, implying that highSRvalues found at the subtropical waters were results of photobleach-ing of CDOM (Fig. 3). TheSR values, on the other hand, did not increase along with photobleaching of CDOM dur-ing photo-irradiation experiments (Fig. 5), even though in-creases inSRwere found during photo-irradiation of terres-trial and coastal CDOM (Helms et al., 2008). Even though
S350−400 observed for photo-irradiation experiments might have relatively large analytical errors,S350−400tended to in-crease accompanied by an inin-crease inS275−295during pho-tobleaching of CDOM, resulting the unchanged SR values in this study (Fig. 5). Zhang et al. (2009b) reported the de-crease in S350−400 during photobleaching of lake CDOM. On the other hand, Osburn et al. (2011) found the slight in-crease in S350−400 during photobleaching of lake CDOM. The different behavior, i.e., increase or decrease trend, of
a
(320)
(
m
-1)
S275
-295
(nm
-1)
S350
-400
(nm
-1)
SR
Irradiance (MJ m-2)
[image:9.595.81.256.68.486.2]STP-1 light STP-1 dark STP-2 light STP-2 dark
Fig. 5. Changes in a(320), S275−295, S350−400, andSR during
photo-irradiation experiments of the subtropical deep waters. Note: 23, 60, and 87 MJ m−2on thexaxis was corresponding to 2, 6, and 13 days for the dark control experiments, respectively.
Interestingly,SRshowed subsurface maxima in the subarc-tic region, suggesting that newly produced CDOM has higher
SRvalues and/orSRvalues changed during microbial degra-dation processes of CDOM. In our dark microbial incuba-tion experiments, decreases inSRdue to increase inS350−400 were evident, along with the degradation of bioavailable oceanic CDOM (Fig. 4). This result implies thatSRmight be useful as a tracer of microbial reworking history of oceanic CDOM. Helms et al. (2008), on the other hand, found the de-crease inSRdue to decrease in theS275−295and increase in theS350−400 for degradation of terrigenous DOM. Zhang et al. (2009a) reported the increase, and then, decrease trend
of SR during lake phytoplankton degradation experiment. Such different trends ofSRduring DOM degradation might be results of differences in sources, i.e., terrigenous or au-tochthonous. Further study is needed for evaluating theSRas well asS350−400as a tracer of photochemical and/or micro-bial reworking history in relation to sources of CDOM.
5 Conclusions and perspectives
This study demonstrated that photobleaching is a primary factor controlling theS275−295in surface waters of the west-ern North Pacific. The results are consistent with previous studies conducted in terrestrial aquatic and coastal environ-ments (Helmes et al., 2008; Fichot and Benner, 2012) as well as recent photo-irradiation experiments using deep ocean wa-ter (Stubbins et al., 2012; Helms et al., 2013). Thus, as with terrestrial and coastal environments, S275−295 can be used as a possible tracer for photochemical history of CDOM in the open ocean. Helms et al. (2008, 2013) pointed out that
S275−295may be used for tracing subducted, photobleached surface water. In this study, we discussed the possible contri-bution of the same water mass into the lower water column at 3 stations in the subtropical region from the distributional pattern ofS275−295. The subsurface and intermediate waters, such as mode waters, have intrinsic formation regions (e.g. Suga et al., 2004) where photochemical histories of CDOM are possibly different. Thus,S275−295can be used for evaluat-ing the distribution of mode waters. In addition,S275−295can also be used for tracing episodic upwelling, caused by events such as tropical cyclones. The vertical transport of photo-labile CDOM from subsurface into surface waters might af-fect the primary and microbial production because photo-degradation of CDOM gives rise the microbiologically la-bile low molecular weight compounds (Mopper and Kieber, 2002). To clarify this issue, effects of photo-degradation of CDOM with changes inS275−295on the biological produc-tion should be evaluated. Measurement of CDOM optical properties has often been focused on the visible region, be-cause it is a well-recognized interfering factor for satellite remote sensing of chlorophylla. Recently, CDOM has also been determined with satellite remote sensing (e.g. Sasaki et al., 2004; Matsuoka et al., 2007). SinceS275−295can be mea-sured with high precision and give rise useful information for marine biogeochemistry, inclusion of this analysis in future optical studies in the open ocean is highly expected.
Acknowledgements. We are grateful to K. Sugie, and captains and
crews of the R/V Wakataka-maru, the R/V Tansei Maru, the R/V
Hakuho Maru for their assistance with sample collection. This
research was supported by grants-in-aid from JSPS (No. 22840002, 23651003, and 24681002 to Y. Yamashita; 24121003 to H. Saito.)
References
Biers, E. J., Zepp, R. G., and Moran, M. A.: The role of nitrogen in chromophoric and fluorescent dissolved organic matter forma-tion, Mar. Chem., 103, 46–60, 2007.
Blough, N. L. and Del Vecchio, R.: Chromophoric DOM in the coastal environment, in: Biogeochemistry of Marine Dissolved Organic Matter, edited by: Carlson, C. and Hansell, D., Aca-demic Press, 509–546, 2002.
Bricaud, A., Ciotti, A. M., and Gentili, B.: Spatial-temporal vari-ations in phytoplankton size and colored detrital matter ab-sorption at global and regional scales, as derived from twelve years of SeaWiFS data (1998–2009), Glob. Biogeochem. Cy., 26, GB1010, doi:10.1029/2010GB003952, 2012.
Carder, K. L., Steward, R. G., Harvey, G. R., and Ortner, P. B.: Ma-rine humic and fulvic acids: Their effects on remote sensing of ocean chlorophyll, Limnol. Oceanogr., 34, 68–81, 1989. Del Vecchio, R. and Blough, N. V.: Photobleaching of
chro-mophoric dissolved organic matter in natural waters: kinetics and modeling, Mar. Chem., 78, 231–253, 2002.
Endo, H., Yoshimura, T., Kataoka, T., and Suzuki, K.: Effects of CO2and iron availability on phytoplankton and eubacterial
com-munity compositions in the northwest subarctic Pacific, J. Exp. Mar. Biol. Ecol., 439, 160–175, 2013.
Fichot, C. G., Sathyendranath, S., and Miller, W. L.: SeaUV and SeaUVC: Algorithms for the retrieval of UV/Visible diffuse at-tenuation coefficients from ocean color, Remote Sens. Environ., 112, 1584–1602, 2008.
Fichot, C. G. and Benner, R.: A novel method to esti-mate DOC concentrations from CDOM absorption coeffi-cients in coastal waters, Geophys. Res. Lett., 38, L03610, doi:10.1029/2010GL046152, 2011.
Fichot, C. G. and Benner, R.: The spectral slope coefficient of chro-mophoric dissolved organic matter (S275−295) as a tracer of
ter-rigenous dissolved organic carbon in river-influenced ocean mar-gins, Limnol. Oceanogr., 57, 1453–1466, 2012.
Fichot, C. G., Kaiser, K., Hooker, S. B., Amon, R. M. W., Babin, M., Bélanger, S., Walker, S. A., and Benner, R.: Pan-Arctic dis-tributions of continental runoff in the Arctic Ocean, Sci. Rep., 3, 1053, doi:10.1038/srep01053 2013.
Granskog, M. A.: Changes in spectral slopes of colored dissolved organic matter absorption with mixing and removal in a terres-trially dominated marine system (Hudson Bay, Canada), Mar. Chem., 134, 10–17, 2012.
Green, S. A. and Blough, N. V.: Optical absorption and fluorescence properties of chromophoric dissolved organic matter in natural waters, Limnol. Oceanogr., 39, 1903–1916, 1994.
Guéguen, C., Granskog, M. A., McCullough, G., and Barber, D. G.: Characterisation of colored dissolved organic matter in Hud-son Bay and HudHud-son Strait using parallel factor analysis, J. Mar. Syst., 88, 423–433, 2011.
Häder, D.-P., Kumar, H. D., Smith, R. C., and Worrest, R. C.: Effects on aquatic ecosystems, J. Photochem. Photobiol. B-Biol., 46, 53– 68, 1998.
Hasegawa, T., Kasai, H., Ono, T., Tsuda, A., and Ogawa, H.: Dy-namics of dissolved and particulate organic matter during the spring bloom in the Oyashio region of the western subarctic Pa-cific Ocean, Aquat. Microb. Ecol., 60, 127–138, .2010.
Helms, J. R., Stubbins, A., Ritchie, J. D., Minor, E. C., Kieber, D. J., and Mopper, K.: Absorption spectral slopes and slope ratios
as indicators of molecular weight, source, and photobleaching of chromophoric dissolved organic matter, Limnol. Oceanogr., 53, 955–969, 2008.
Helms, J. R., Stubbins, A., Perdue, E. M., Green, N. W., Chen, H., and Mopper, K.: Photochemical bleaching of oceanic dissolved organic matter and its effect on absorption spectral slope and flu-orescence, Mar. Chem., 155, 81–91, 2013.
Herndl G. J., Muller-Niklas, G., and Frick, J.: Major role of ultraviolet-B in controlling bacterioplankton growth in the sur-face layer of the ocean, Nature, 361, 717–719, 1993.
Kawai, H.: Hydrography of the Kuroshio Extention, in: Kuroshio, edited by: Stommel H., Yoshida K., University of Tokyo Press, 235–352, 1972.
Kitidis, V., Stubbins, A. P., Uher, G., Goddard, R. C. U., Law, C. S., and Woodward, E. M. S.: Variability of chromophoric organic matter in surface waters of the Atlantic Ocean, Deep-Sea Res. Pt. II, 53, 1666–1684, 2006.
Kobari, T., Mitsui, K., Ota, T., Ichinomiya, M., and Gomi, Y.: Response of heterotrophic bacteria to the spring phytoplankton bloom in the Oyashio region, Deep-Sea Res. Pt. II, 57, 1671– 1678, 2010.
Kudo, I., Noiri, Y., Cochlan, W. P., Suzuki, K., Aramaki, T., Ono, T., and Nojiri, Y.: Primary productivity, bacterial productivity and nitrogen uptake in response to iron enrichment during the SEEDS II, Deep-Sea Res. Pt. II, 56, 2755–2766, 2009.
Matsuoka, A., Huot, Y., Shimada, K., Saitoh, S., and Babin, M.: Bio-optical characteristics of the western Arctic Ocean: impli-cations for ocean color algorithms, Can. J. Remote Sens., 33, 503–518, 2007.
Mladenov, N., Sommaruga, R., Morales-Baquero, R., Laurion, I., Camarero, L., Diéguez, M. C., Camacho, A., Delgado, A., Tor-res, O., Chen, Z., Felip, M., and Reche, I.: Dust inputs and bacte-ria influence dissolved organic matter in clear alpine lakes, Nat. Commun., 2, 405, doi:10.1038/ncomms1411, 2011.
Mopper, K. and Kieber, D. J.: Photochemistry and the cycling of carbon, sulfer, nitrogen and phosphorus, in: Biogeochemistry of Marine Dissolved Organic Matter, edited by: Carlson, C. and Hansell, D., Academic Press, 455–508, 2002.
Nelson, N. B. and Siegel, D. A.: Chromophoric DOM in the open ocean, in: Biogeochemistry of Marine Dissolved Organic Matter, edited by: Carlson, C. and Hansell, D., Academic Press, 547– 578, 2002.
Nelson, N. B. and Siegel, D. A.: The global distribution and dynam-ics of chromophoric dissolved organic matter, Annu. Rev. Mar. Sci., 5, 447–476, 2013.
Nelson, N. B., Siegel, D. A., and Michaels, A. F.: Seasonal dynam-ics of colored dissolved material in the Sargasso Sea, Deep-Sea Res. Pt.I, 45, 931–957, 2002.
Nelson, N. B., Carlson, C. A., and Steinberg, D. K.: Production of chromophoric dissolved organic matter by Sargasso Sea mi-crobes, Mar. Chem., 89, 273–287, 2004.
Nelson, N. B., Siegel, D. A., Carlson, C. A., Swan, C., Smethie, Jr., W. M., and Khatiwala, S.: Hydrography of chromophoric dis-solved organic matter in the North Atlantic, Deep-Sea Res. Pt. I, 54, 710–731, 2007.
Omori, Y., Hama, T., Ishii, M., and Saito, S.: Relationship between the seasonal change in fluorescent dissolved organic matter and mixed layer depth in the subtropical western North Pacific, J. Geophys. Res., 115, C06001, doi:10.1029/2009JC005526, 2010. Omori, Y., Hama, T., Ishii, M., and Saito, S.: Vertical change in the composition of marine humic-like fluorescent dissolved organic matter in the subtropical western North Pacific and its relation to photoreactivity, Mar. Chem., 124, 38–47, 2011.
Ortega-Retuerta, E., Frazer, T. K., Duarte, C. M., Ruiz-Halpern, S., Tovar-Sánchez, A., Arrieta, J. M., and Reche, I.: Biogeneration of chromophoric dissolved organic matter by bacteria and krill in the Southern Ocean, Limnol, Oceanogr., 54, 1941–1950, 2009. Ortega-Retuerta, E., Reche, I., Pulido-Villena, E., Agustí, S., and
Duarte, C. M.: Distribution and photoreactivity of chromophoric dissolved organic matter in the Antarctic Peninsula (Southern Ocean), Mar. Chem., 118, 129–139, 2010.
Osburn, C. L., Wigdahl, C. R., Fritz, S. C., and Saros, J. E.: Dis-solved organic matter composition and photoreactivity in prairie lakes of the US Great Plains, Limnol. Oceanogr., 56, 2371–2390, 2011.
Romera-Castillo, C., Álvarez-Salgado, X., Galí, M., Gasol, J. M., and Marrasé, C.: Combined effect of light exposure and mi-crobial activity on distinct dissolved organic matter pools. A seasonal field study in an oligotrophic coastal system (Blanes Bay,NW Mediterranean), Mar. Chem., 148, 44–51, 2013. Saito, H., Tsuda, A., and Kasai, H.: Nutrient and plankton dynamics
in the Oyashio region of the western subarctic Pacific Ocean, Deep-Sea Res. Pt. II, 49, 5463–5486, 2002.
Sasaki, H, Siswanto, E., Nishiuchi, K., Tanaka, K., Hasegawa, T., and Ishizaka, J.: Mapping the low salinity Changjiang Diluted Water using satellite-retrieved colored dissolved organic matter (CDOM) in the East China Sea during high river flow season, Geophys. Res. Lett., 35, L04604, doi:10.1029/2007GL032637, 2004.
Shank, C. G., Lee, R., Vähätalo, A., Zepp, R. G., and Bartels, E.: Production of chromophoric dissolved organic matter from man-grove leaf litter and floating Sargassum colonies, Mar. Chem., 119, 172–181, 2010.
Shank, C. G. and Evans, A.: Distribution and photoreactivity of chromophoric dissolved organic matter in northern Gulf of Mex-ico shelf waters, Cont. Shelf Res., 31, 1128–1139, 2011. Siegel, D. A., Maritorena, S., Nelson, N. B., Hansell, D. A., and
Lorenzi-Kayser, M.: Global distribution and dynamics of colored dissolved and detrital organic materials, J. Geophys. Res., 107, C123228, doi:10.1029/2001JC000965, 2002.
Smith, R. C., Prezelin, B. B., Baker, K. S., Bidigare, R. R., Boucher, N. P., Coley, T., Karentz, D., MacIntyre, S., Matlick, H. A., Men-zies, D., Ondrusek, M., Wan, Z., and Waters, K. J.: Ozone deple-tion: ultraviolet radiation and phytoplankton biology in Antarctic waters, Science, 255, 952–959, 1992.
Spencer, R. G. M., Butler, K. D., and Aiken, G. R.: Dissolved or-ganic carbon and chromophoric dissolved oror-ganic matter prop-erties of rivers in the USA, J. Geophys, Res., 117, G03001, doi:10.1029/2011JG001928, 2012.
Stedmon, C. A., Markager, S., and Kaas, H.: Optical Properties and signatures of chromophoric dissolved organic matter (CDOM) in Danish coastal waters, Estuar. Coast. Shelf Sci., 51, 267–278, 2000.
Steinberg, D. K., Nelson, N. B., Carlson, C. A., and Prusak, A. C.: Production of chromophoric dissolved organic matter (CDOM) in the open ocean by zooplankton and the colonial cyanobac-terium Trichodesmium spp, Mar. Ecol. Prog. Ser., 267, 45–56, 2004.
Stubbins, A., Niggemann, J., and Dittmar, T.: Photo-lability of deep ocean dissolved black carbon, Biogeosciences, 9, 1661–1670, doi:10.5194/bg-9-1661-2012, 2012.
Suga, T., Motoki, K., and Aoki, Y.: The North Pacific Climatology of Winter Mixed Layer and Mode Waters, J. Phys. Oceanogr., 34, 3–22, 2004.
Swan, C. M., Siegel, D. A., Nelson, N. B., Carlson, C. A., and Nasir, E.: Biogeochemical and hydrographic controls on chromophoric dissolved organic matter distribution in the Pacific Ocean, Deep-Sea Res. Pt. I, 56, 2175–2192, 2009.
Swan, C. M., Nelson, N. B., Siegel, D. A., and Kostadinov, T. S.: The effect of surface irradiance on the absorption spectrum of chromophoric dissolved organic matter in the global ocean, Deep-Sea Res. Pt. I, 63, 52–64, 2012.
Twardowski, M. S., Boss, E., Sullivan, J. M., and Donaghay, P. L.: Modeling the spectral shape of absorption by chromophoric dis-solved organic matter, Mar. Chem., 89, 69–88, 2004.
Vernet, M. and Whitehead, K.: Release of ultraviolet-absorbing compounds by the red-tide dinoflagellate Lingulodinium polye-dra, Mar. Biol., 127, 35–44, 1996.
Welschmeyer, N. A.: Fluorometric analysis of chlorophyll a in the presence of chlorophyll b and phaeopigments, Limnol. Oceanogr., 39, 1985–1992, 1994.
Yamashita, Y. and Tanoue, E.: In situ production of chromophoric dissolved organic matter in coastal environments, Geophys. Res. Lett., 31, L14302, doi:10.1029/2004GL019734, 2004.
Yamashita, Y. and Tanoue, E.: Production of bio-refractory fluores-cent dissolved organic matter in the ocean interior, Nat. Geosci., 1, 579–582, 2008.
Yamashita, Y. and Tanoue, E.: Basin scale distribution of chro-mophoric dissolved organic matter in the Pacific Ocean, Limnol. Oceanogr., 54, 598–609, 2009.
Yamashita, Y., Maie, N., Briceño, H., and Jaffé R.: Optical char-acterization of dissolved organic matter in tropical rivers of the Guayana Shield, Venezuela, J. Geophys. Res., 115, G00F10, doi:10.1029/2009JG000987, 2010a.
Yamashita, Y., Scinto, L., Maie, N., and Jaffé, R.: Dissolved organic matter characteristics across a subtropical wetland’s landscape: Application of optical properties in the assessment of environ-mental dynamics, Ecosystems, 13, 1006–1019, 2010b.
Ysuda, I.: North Pacific Intermediate Water: Progress in SAGE (SubArctic Gyre Experiment) and Related Projects, J. Oceanogr., 60, 385–395, 2004.
Zhang, Y., van Dijk, M. A., Liu, M., Zhu, G., and Qin, B.: The contribution of phytoplankton degradation to chromophoric dis-solved organic matter (CDOM) in eutrophic shallow lakes: Field and experimental evidence, Water Res., 43, 4685–4697, 2009a. Zhang,Y., Liu, M., Qin, B., and Feng, S.: Photochemical