Available Online at www.ijpret.com 73
INTERNATIONAL JOURNAL OF PURE AND
APPLIED RESEARCH IN ENGINEERING AND
TECHNOLOGY
A PATH FOR HORIZING YOUR INNOVATIVE WORKOPTIMIZATION OF MACHINING PARAMETER FOR TURNING USING TAGUCHI
APPROACH
GAJANAN A. DAVHALE1, PROF. H. M. DESHMUKH2
1. M.E. (PTM) Student, Department of Mechanical Engineering, Prof. Ram Meghe Institute of Technology & Research, Badnera-Amravati. 2. Associate Professor, Department of Mechanical Engineering, Prof. Ram Meghe Institute of Technology & Research, Badnera-Amravati.
Accepted Date: 14/06/2015; Published Date: 01/07/2015
\
Abstract: - In this paper an attempt is made to review the literature on optimization of cutting parameters in machining using Taguchi method. The settings of machining parameters were determined by using Taguchi’s experimental design method. Orthogonal arrays of Taguchi, the signal-to-noise (S/N) ratio, the analysis of variance (ANOVA) are employed to find the optimal levels and to analyze the effect of the cutting parameter.
Keywords: EN8, Taguchi method, Signal to noise ratio, ANOVA, optimization, cutting parameters
Corresponding Author: MR. GAJANAN A. DAVHALE
Access Online On:
www.ijpret.com
How to Cite This Article:
Gajanan A. Davhale, IJPRET, 2015; Volume 3 (11): 73-91
Available Online at www.ijpret.com 74
INTRODUCTION
The need for selecting and implementing optimal machining conditions and the most suitable cutting tool has been felt over the last few decades. In machining, the speed and motion of the cutting tool is specified through several parameters. These parameters are selected for each operation based upon the work piece material, tool material, tool size, and more. Machining parameters that can affect the processes are: a) Cutting speed - The speed of the work piece surface relative to the edge of the cutting tool during a cut, the cutting speed is measured in meter per minute, b) Feed rate - The speed of the cutting tool's movement relative to the work piece as the tool makes a cut. The feed rate is measured in mm per revolution. c) Depth of cut - The depth of the tool along the radius of the work piece as it makes a cut, as in a turning or boring operation. A large depth of cut will require a low feed rate, or else it will result in a high load on the tool and reduce the tool life. Therefore, a feature is often machined in several steps as the tool moves over at the depth of cut. The Taguchi method is a well-known technique that provides a systematic and efficient methodology for process optimization and this is a powerful tool for the design of high quality systems.
II. LITERATURE REVIEW
W. H. Yang et al. [1] have discussed an application of the Taguchi method for optimizing the cutting parameters in turning operations. The Taguchi method provides a systematic and efficient methodology for the design optimization of the cutting parameters with far less effect than would be required for most optimization techniques. It has been shown that tool life and surface roughness can be improved significantly for turning operations.
D. Philip Selvaraj et al. [2] have studied the Taguchi optimization method was applied to find the optimal process parameters, which minimizes the surface roughness during the dry turning of AISI 304 Austenitic Stainless Steel. A Taguchi orthogonal array, the signal to noise (S/N) ratio and the analysis of variance (ANOVA) were used for the optimization of cutting parameters. ANOVA results shows that feed rate, cutting speed and depth of cut affects the surface roughness by 51.84%, 41.99% and 1.66% respectively. A confirmation experiment was also conducted and verified the effectiveness of the Taguchi optimization method.
Available Online at www.ijpret.com 75
paper deals with machinability index, short machinability testing, conventional machinability testing, effect of tool life data analysis on tool life equation, ISO standards for tool life testing and
Computerized machinability data system developed according to the Integrated Machinability Testing Concept.
Sijo M. T. et al. [4] analyzed that for solving machining optimization problems, various conventional techniques had been used so far, but they are not robust and have problems when applied to the turning process, which involves a number of variables and constraints. To overcome the above problems, Taguchi method is used in this work. Since Taguchi method is experimental method it is realistic in nature. According to this study the prime factor affecting surface finish is feed rate.
Krishnakant et al. [5] analyzed that an optimization of turning process by the effects of machining parameters applying Taguchi methods to improve the quality of manufactured goods, and engineering development of designs for studying variation. EN24 steel is used as the work piece material for carrying out the experimentation to optimize the Material Removal Rate.
KompanChomsamutr et al. [6] objective of research is to compare the cutting parameters of turning operation the work pieces of medium carbon steel (AISI 1045) by finding the longest tool life by Taguchi methods and Response Surface Methodology: RSM. This research is to test the collecting data by Taguchi method. The analyses of the impact among the factors are the depth of cut, cutting speed and feed rate. This research found that the most suitable response value; and tool life methods give the same suitable values, i.e. feed rate at 0.10 mm/rev, cutting speed at 150 m/min, and depth of cut at 0.5 mm, which is the value of longest tool life at 670.170 min, while the average error is by RSM at the percentage of 0.07 as relative to the testing value.
Available Online at www.ijpret.com 76
product and service sectors. It thus is a powerful method as compared to the other intuitive and more cumbersome methods encompassing a large number of fields in terms of application.
Quazi T Z et al. [8] have made an attempt to review the literature on optimizing machining parameters in turning processes by Taguchi method. The settings of turning parameters were determined by using Taguchi’s experimental design method. Orthogonal arrays of Taguchi, the signal-to-noise (S/N) ratio, the analysis of variance (ANOVA) are employed to find the optimal levels and to analyze the effect of the turning parameters.
AtulKulkarni et al. [9] used Taguchi method to optimize cutting parameters during dry turning of AISI304 austenitic steel with AlTiCrN coated tool.
Vikas B. Magdum et al. [10] this study used for optimization and evaluation of machining parameters for turning on EN8 steel on Lathe machine. This study investigates the use of tool materials and process parameters for machining forces for selected parameter range and estimation of optimum performance characteristics. Develop a methodology for optimization of cutting forces and machining parameters.
An Nithyanandhan T. et al. [11] have investigated the effects of process parameters on surface finish and material removal rate (MRR) to obtain the optimal setting of process parameters. And the analysis of Variance (ANOVA) is also used to analyze the influence of cutting parameters during machining. In this work, AISI 304 stainless steel work pieces are turned on conventional lathe by using tungsten carbide tool. The results revealed that the feed and nose radius is the most significant process parameters on work piece surface roughness. However, the depth of cut and feed are the significant factors on MRR.
Available Online at www.ijpret.com 77
III EXPERIMENTAL WORKS
In this study, Taguchi method is used for single characteristics optimization has been used to establish correlation between the independent variables therefore; the experiments were performed according to a Taguchi design of experiments
3.1 Work material & cutting tool
The work material selected in this investigation was EN8. The chemical composition of the EN8 tool steel includes: 0.35-0.45 % C, 0.60-1.00%Mn, 0.060%S, 0.060%P, 0.05- 0.35%Si. Commercially available EN8 round bar of dia. 28 mm was used as work piece material and turned up to 24 mm diameter. A commercially available single point carbide cutting tool was used as cutting tool material.
3.2 Design of experiments
Experiments were designed using Taguchi method which uses an OA to study the entire parametric space with a limited number of experiments. In present research two parameter (factors) chosen such as speed and depth of cut. All of them were set at three different levels. (See table 1)
Table 1: Process variables and their limits
Process Variable
Values in coded form Spindle Speed (N)
(RPM)
Feed ( f ) (mm/rev)
Depth of cut (d )
(mm)
-1 250 0.2 0.75
0 390 0.1 1.0
+1 585 0.08 1.5
Selection of a particular OA is based on the number of levels of various factors. Here, 3 parameters each at 3 levels, therefore Degree of Freedom (DOF) can be calculated as,
(DOF)R = P (L – 1) (1)
P = number of factors, L = number of levels
Available Online at www.ijpret.com 78
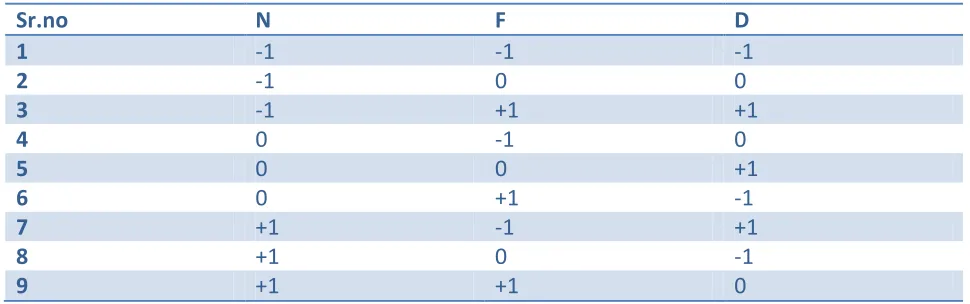
Total DOF of OA should be greater than or equal to the total DOF required for the experiment. [18],here 9 >6 hence L9 OA is selected (See Table 2). Each machining parameter is assigned to a column of OA and 9 machining parameter combinations are designed. The response variables chosen for the present investigation are: MRR, Ra and Flank wear. The “Larger-the-better” quality characteristic has been used for calculating the signal to noise (S/N) ratio of all quality characteristic.
Table 2 Taguchi L9 Orthogonal Array
Factorial Combination
Sr.no N F D
1 -1 -1 -1
2 -1 0 0
3 -1 +1 +1
4 0 -1 0
5 0 0 +1
6 0 +1 -1
7 +1 -1 +1
8 +1 0 -1
9 +1 +1 0
3.3 Experimental planning
Experiments were conducted using an Centre Lathe as per L9 OA combinations & each experiment were conduce done times for getting reliable database i.e.9*1total 9 experiments conducted. Figure 2 shows the experimental setup for present study. MRR calculated by using formula, Surface roughness was measured using Taylor Hobson surface finished tester and Flank wear was measured using Video Measuring Machines for all 9 specimens as shown in Fig.2 and 4.
IV. EXPERIMENTAL RESULTS AND DISCUSSION
4.1 Effect of process parameters on MRR
Regression Analysis: MRR versus Speed, Feed, D.O.C
The regression equation is
Available Online at www.ijpret.com 79
Predictor Coef SE Coef T P
Constant -13959 2533 -5.51 0.003
Speed 173.84 39.82 4.37 0.007
Feed 46912 9163 5.12 0.004
D.O.P 6312 1543 4.09 0.009
S = 1443.06 R-Sq = 92.5% R-Sq(adj) = 88.1%
Analysis of Variance
Source DF SS MS F P
Regression 3 129133053 43044351 20.67 0.003
Residual Error 5 10412086 2082417
Total 8 139545139
Source DF Seq SS
Speed 1 39694216
Feed 1 54577346
D.O.P 1 34861492
Unusual Observations
Obs Speed MRR Fit SE Fit Residual St Resid
7 51.5 15435 13835 1216 1600 2.06R
Available Online at www.ijpret.com 80
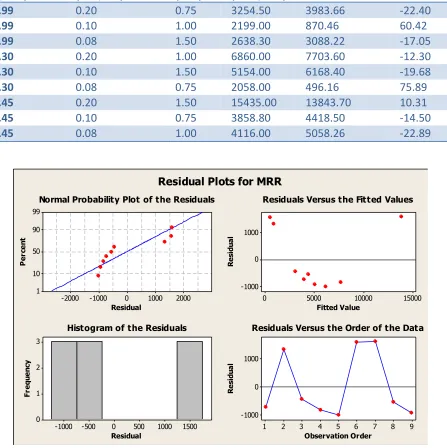
Table 3: Regression analysis MRR versus speed, feed, D.O.C
Speed (m/min) Feed (mm/rev) D.O.C (mm) MRR
(mm3/min)
MRR by reg. % Error
21.99 0.20 0.75 3254.50 3983.66 -22.40
21.99 0.10 1.00 2199.00 870.46 60.42
21.99 0.08 1.50 2638.30 3088.22 -17.05
34.30 0.20 1.00 6860.00 7703.60 -12.30
34.30 0.10 1.50 5154.00 6168.40 -19.68
34.30 0.08 0.75 2058.00 496.16 75.89
51.45 0.20 1.50 15435.00 13843.70 10.31
51.45 0.10 0.75 3858.80 4418.50 -14.50
51.45 0.08 1.00 4116.00 5058.26 -22.89
Residual P er ce nt 2000 1000 0 -1000 -2000 99 90 50 10 1 Fitted Value R es id ua l 15000 10000 5000 0 1000 0 -1000 Residual Fr eq ue nc y 1500 1000 500 0 -500 -1000 3 2 1 0 Observation Order R es id ua l 9 8 7 6 5 4 3 2 1 1000 0 -1000
Normal Probability Plot of the Residuals Residuals Versus the Fitted Values
Histogram of the Residuals Residuals Versus the Order of the Data
Available Online at www.ijpret.com 81
Response Table for Signal to Noise Ratios -: Larger is better
Level Speed Feed D.O.C
1 68.51 68.99 69.42
2 72.41 70.94 71.95
3 75.93 76.92 75.48
M
e
a
n
o
f
M
R
R
51.45 34.30
21.99 10000
8000
6000
4000
2000
0.20 0.10
0.08
1.50 1.00
0.75 10000
8000
6000
4000
2000
SPEED FEED
D.O.C
Main Effects Plot (data means) for MRR
0.00 2000.00 4000.00 6000.00 8000.00 10000.00 12000.00 14000.00 16000.00 18000.00
1 2 3 4 5 6 7 8 9
MRR
Available Online at www.ijpret.com 82
Delta 7.42 7.92 6.06
Rank 2 1 3
Optimal setting of various process parameters by Taguchi technique for turned parts to yields optimal to maximum MRR is: cutting speed=390RPM; feed rate =0.2mm/rev; depth of cut=1.5mm
4.2 Effect of process parameters on surface roughness
Regression Analysis: Ra versus Speed, Feed, D.O.C
The regression equation is
Ra = 0.41 + 0.0139 Speed + 10.1 Feed + 0.733 D.O.C
Predictor CoefSE Coef T P
Constant 0.412 1.320 0.31 0.768
Speed 0.01387 0.02074 0.67 0.533
Feed 10.054 4.774 2.11 0.089
D.O.P 0.7333 0.8036 0.91 0.403
M
ea
n
of
S
N
ra
tio
s
51.45 34.30
21.99 80
75
70
0.20 0.10
0.08
1.50 1.00
0.75 80
75
70
SPEED FEED
D.O.C
Main Effects Plot (data means) for SN ratios
Available Online at www.ijpret.com 83
S = 0.751737 R-Sq = 53.3% R-Sq(adj) = 25.3%
Analysis of Variance
Source DF SS MS F P
Regression 3 3.2300 1.0767 1.91 0.247
Residual Error 5 2.8255 0.5651
Total 8 6.0556
Source DF Seq SS
Speed 1 0.2527
Feed 1 2.5067
D.O.P 1 0.4706
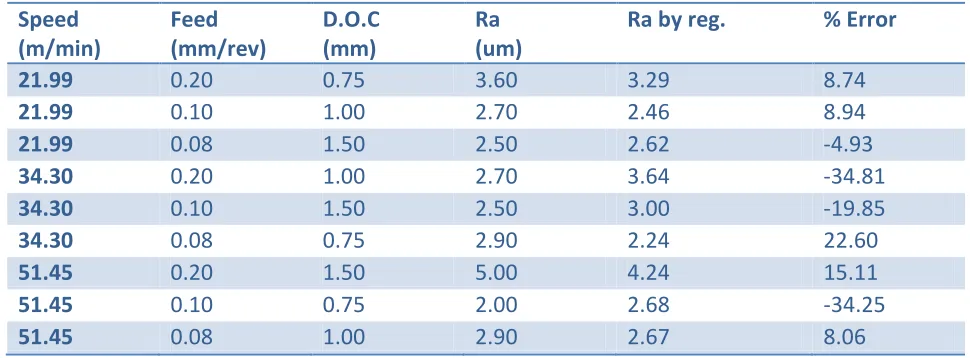
Table 4 Regression analysis Ra versus speed, feed, D.O.C
Speed (m/min)
Feed (mm/rev)
D.O.C (mm)
Ra (um)
Ra by reg. % Error
21.99 0.20 0.75 3.60 3.29 8.74
21.99 0.10 1.00 2.70 2.46 8.94
21.99 0.08 1.50 2.50 2.62 -4.93
34.30 0.20 1.00 2.70 3.64 -34.81
34.30 0.10 1.50 2.50 3.00 -19.85
34.30 0.08 0.75 2.90 2.24 22.60
51.45 0.20 1.50 5.00 4.24 15.11
51.45 0.10 0.75 2.00 2.68 -34.25
Available Online at www.ijpret.com 84
Fig.1: Set-up for Surface roughness (Ra) value measurement
Residual P er ce nt 1 0 -1 99 90 50 10 1 Fitted Value R es id ua l 4.0 3.5 3.0 2.5 2.0 1.0 0.5 0.0 -0.5 -1.0 Residual Fr eq ue nc y 0.75 0.50 0.25 0.00 -0.25 -0.50 -0.75 -1.00 3 2 1 0 Observation Order R es id ua l 9 8 7 6 5 4 3 2 1 1.0 0.5 0.0 -0.5 -1.0
Normal Probability Plot of the Residuals Residuals Versus the Fitted Values
Histogram of the Residuals Residuals Versus the Order of the Data
Available Online at www.ijpret.com 85 Response Table for Signal to Noise Ratios
Larger is better
Level Speed Feed D.O.C.
1 9.237 8.818 8.798
2 8.611 7.536 8.834
3 9.749 11.244 9.996
Delta 1.138 3.709 1.167
Rank 2 3 1
Optimal setting of various process parameters by Taguchi technique for turned parts to yields optimal to maximum Ra is: cutting speed=390RPM; feed rate =0.08 mm/rev; depth of cut=0.75 mm
4.3 Effect of process parameters on flank wear
Regression Analysis: FW versus Speed, Feed, D.O.C
The regression equation is
M
ea
n
of
S
N
ra
tio
s
51.45 34.30
21.99 11
10 9 8 7
0.20 0.10
0.08
1.50 1.00
0.75 11
10 9 8 7
Speed Feed
D.O.C
Main Effects Plot (data means) for SN ratios
Available Online at www.ijpret.com 86
FW = 0.587 + 0.0185 Speed - 0.790 Feed + 0.397 D.O.C
Predictor CoefSE Coef T P
Constant 0.5866 0.2128 2.76 0.040
Speed 0.018468 0.003346 5.52 0.003
Feed -0.7903 0.7700 -1.03 0.352
D.O.P 0.3971 0.1296 3.06 0.028
S = 0.121252 R-Sq = 89.1% R-Sq(adj) = 82.6%
Analysis of Variance
Source DF SS MS F P
Regression 3 0.60149 0.20050 13.64 0.008
Residual Error 5 0.07351 0.01470
Total 8 0.67500
Source DF Seq SS
Speed 1 0.44799
Feed 1 0.01549
D.O.P 1 0.13801
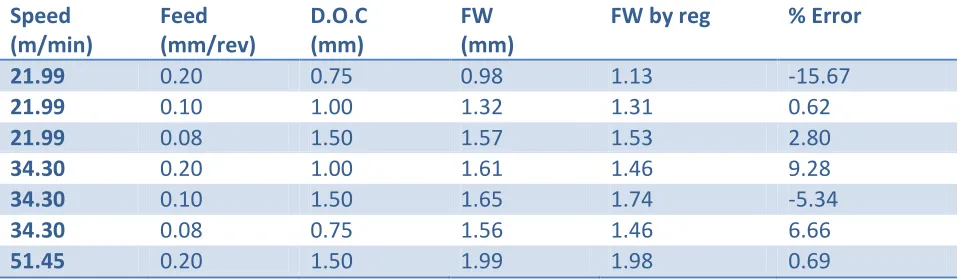
Table 5 Regression Analysis For FW versus Speed, Feed, D.O.C
Speed (m/min)
Feed (mm/rev)
D.O.C (mm)
FW (mm)
FW by reg % Error
21.99 0.20 0.75 0.98 1.13 -15.67
21.99 0.10 1.00 1.32 1.31 0.62
21.99 0.08 1.50 1.57 1.53 2.80
34.30 0.20 1.00 1.61 1.46 9.28
34.30 0.10 1.50 1.65 1.74 -5.34
34.30 0.08 0.75 1.56 1.46 6.66
Available Online at www.ijpret.com 87
51.45 0.10 0.75 1.75 1.76 -0.43
51.45 0.08 1.00 1.79 1.87 -4.62
Fig.2: Set-up for Flank wear value measurement
Residual Pe rc en t 0.2 0.1 0.0 -0.1 -0.2 99 90 50 10 1 Fitted Value Re sid ua l 2.0 1.8 1.6 1.4 1.2 0.1 0.0 -0.1 Residual Fr eq ue nc y 0.15 0.10 0.05 0.00 -0.05 -0.10 -0.15 3 2 1 0 Observation Order Re sid ua l 9 8 7 6 5 4 3 2 1 0.1 0.0 -0.1
Normal Probability Plot of the Residuals Residuals Versus the Fitted Values
Histogram of the Residuals Residuals Versus the Order of the Data
Available Online at www.ijpret.com 88
Response Table for Signal to Noise Ratios
Larger is better
Level Speed Feed D.O.C
1 2.051 4.279 2.849
2 4.116 3.874 3.868
3 5.298 3.313 4.748
Delta 3.247 0.966 1.899
Rank 1 3 2
Optimal setting of various process parameter by Taguchi technique for turned parts to yields optimal to maximum FW are: cutting speed=250 RPM; feed rate =0.08 mm/rev; depth of cut=1.0 mm
M
ea
n
of
S
N
ra
tio
s
51.45 34.30
21.99 5
4
3
2
0.20 0.10
0.08
1.50 1.00
0.75 5
4
3
2
Speed Feed
D.O.C
Main Effects Plot (data means) for SN ratios
Available Online at www.ijpret.com 89
V Conclusions
Taguchi method stresses the importance of studying the response variation using the signal–to– noise (S/N) ratio, resulting in minimization of quality characteristic variation due to uncontrollable parameter. The metal removal rate was considered as the quality characteristic with the concept of "the larger-the-better".
The S/N ratio for “the larger-the-better" is
S/N = -10 Log10
𝟏
𝒏∑
𝟏 𝒚𝟐
Where n is the number of measurements in a trial/row,
In this case, n=1 and y is the measured value in a run/row. The S/N ratio values are calculated by taking into consideration Eqn. with the help of software Minitab 15
Spindle Speed:-The effect of parameters spindle speed on the MRR, Ra.& FW values is shown above figure for S/N ratio. Its effect is increasing with increase in spindle speed. So the optimum spindle speed is level 2, level 2, level 1 i.e.390 rpm
Feed Rate:-The effect of parameters feed rate on the MRR, Ra.& FW values is shown above figure S/N ratio. Its effect is increasing with increase in feed rate. So the optimum feed rate is level1, level 3, level 3 i.e. 0.2 mm/rev. respectively
Depth of Cut:-The effect of parameters depth of cut on the MRR, Ra.& FW values is shown above figure for S/N ratio. Its effect is increasing with increase in depth of cut. So the optimum depth of cut is level 3,level 1, level 2 i.e. 1.5mm
REFERENCES
1. W. H. Yang et al “Design optimization of cutting parameters for turning operations based on Taguchi method”, Journal of materials processing technology 84(1998), page 122-129
Available Online at www.ijpret.com 90
3. ElsoKuljanic et al “Machinability of difficult machining materials”, 14th International Research/Expert Conference “Trends in the Development of Machinery and Associated Technology” TMT 2010, Mediterranean Cruise, 11-18 September 2010, page I-1 to I-14
4. Sijo M. T. et al “Taguchi Method for Optimization of Cutting Parameters in Turning Operations”, AMAE Int. J. on Manufacturing and Material Science, Vol. 01, No. 01, May 2011, page 44-46
5. Krishankant et al “Application of Taguchi Method for Optimizing Turning Process by the effects of Machining Parameters”, International Journal of Engineering and Advanced Technology (IJEAT) ISSN: 2249 – 8958, Volume-2, Issue-1, October 2012,page 263-274
6. Kompan Chomasmutr et al “Optimization Parameters of tool life Model Using the Taguchi Approach and Response Surface Methodology”, International Journal of Computer Science Issues, Vol. 9, Issue 1, No 3, January 2012, page 120-125
7. Samrudhi Rao et al “An Overview of Taguchi Method: Evolution, Concept and Interdisciplinary Applications”, International Journal of Scientific & Engineering Research, Volume 4, Issue 10, October-2013, page 621-626
8. Quazi T Z et al “a case study of Taguchi method in the optimization of turning parameters”, International Journal of Emerging Technology and Advanced Engineering Website: www.ijetae.com (ISSN 2250-2459, ISO 9001:2008 Certified Journal, Volume 3, Issue 2, February 2013), page 616-626
9. Atul Kulkarni et al “Design optimization of cutting parameters for turning of AISI 304 austenic stainless steel using Taguchi method”, Indian Journal of engineering & material sciences, vol. 20, August 2013, page 252-258
10.Vikas B. Magdum et al “Evaluation and Optimization of Machining Parameter for turning of EN 8 steel”, International Journal of Engineering Trends and Technology (IJETT) - Volume4 Issue5- May 2013, page 1564-1568
11.Nithyanandhan T. et al “Optimization of Cutting Forces, Tool Wear and Surface Finish in Machining of AISI 304 Stainless Steel Material Using Taguchi’s Method”, International Journal of Innovative Science, Engineering & Technology, Vol. 1 Issue 4, June 2014, page 488-493
Available Online at www.ijpret.com 91
Journal of Research in Engineering and Technology eISSN: 2319-1163 |pISSN: 2321-7308, page 449-456
13.Sunil Kumar Sharma et al “Optimization of Process Parameters in Turning of AISI 8620 Steel Using Taguchi and Grey Taguchi Analysis”, Int. Journal of Engineering Research and Applications www.ijera.com ISSN : 2248-9622, Vol. 4, Issue 3( Version 6), March 2014, page 51-57