Determination of Flow Curves by Stack Compression
Tests of 22MnB5 Sheets
Rosiak A.1, Costa L. L.2,*, Brito A. M. G.3, Schaeffer L.4
1Engineer, Master Student at LdTM/UFRGS, Av Bento Gonçalves, Porto Alegre, Brazil 2M.Sc. Engineer, PhD Student at LdTM/UFRGS, Av Bento Gonçalves, Porto Alegre, Brazil
3PhD. Engineer, Researcher at LdTM/UFRGS, Av Bento Gonçalves, Porto Alegre, Brazil 4Prof. Dr. at Metal Forming Laboratory - LdTM, UFRGS, Av Bento Gonçalves, Porto Alegre, Brazil
Abstract
The flow curve of a material is indispensable in determining the working conditions in metal forming processes. It can be determined from several technological tests under different processing conditions depending on the application of the material. The aim of this study is to provide flow curves for 22MnB5 using stack compression tests for temperatures of 650, 750 and 850°C. Firstly, to validate the stack compression tests, the flow curve obtained from a conventional compression test using a solid cylindrical sample of steel AISI 1045 is compared to the curves acquired by the method of stacked compression using samples with a disc geometry. Considering the 20 mm height of the samples, 2, 4, 8 and 16 discs were used, respectively. The tests are performed inside a tooling heated to the same temperature as the sample. Thus, the test can be considered quasi-isothermal. The working temperature is 850°C. The results validate the disc stacking method by the conventional compression method in all studied conditions. Once the method was validated, flow curves for the 22MnB5 steel were obtained for temperatures of 650, 750 and 850°C from the compression of 16 stacked discs each with a height of 1.35 mm. The flow curves obtained are analogous to those reported in the literature by other test methods.Keywords
Flow curves, Stack compression tests, AISI 1045, 22MnB51. Introduction
In the field of metal forming processes, the flow curve of a material is indispensable in the determination of the working conditions and quantifying the main characteristics of the processes [1]. The compression test performed on solid cylinder samples is one of the most widespread mechanical testing methods for determining the flow curve in this area [2]. Tensile tests are the most common method to determine the flow curves for sheet metals [3]. However, the compression test capability of evaluating material response to much larger strains than in tensile tests, due to the absence of necking, in conjunction with the aptitude to better simulate the operative conditions of real forming processes, which are carried out under high compressive loads, are seen as the main reasons for its extensive utilization [4]. In this context, to test the determination of the flow curves of materials supplied in the form of sheets and plates to the compression test, the stack compression test is an alternative experimental procedure. The test makes use of circular discs
* Corresponding author: [email protected] (Costa L. L.)
Published online at http://journal.sapub.org/materials
Copyright©2019The Author(s).PublishedbyScientific&AcademicPublishing This work is licensed under the Creative Commons Attribution International License (CC BY). http://creativecommons.org/licenses/by/4.0/
that are cut out of the blanks and stacked to form a cylindrical sample with an aspect ratio in the range of solid cylinders currently employed in the conventional compression test. In contrast to other mechanical testing methods, the stack compression test is not standardized and has so far received little attention in the literature [5]. The few works in the literature that do discuss this method are listed in the references [5-8].
In current industrial production, the 22MnB5 boron steel is supplied in the form of sheets. Hot stamped boron steels are applied in the automotive industry to increase vehicle safety. These steels constitute the only steel grade capable of forming a fully martensitic microstructure during or after hot stamping when a refrigerated tool is used [9]. Accordingly, the resistance of the stamped part can reach 1500MPa while maintaining acceptable ductility [10].
In the present paper a detailed description of the experimental procedure and the evaluation methodology are presented for the stack compression test. The special focus of this work was to increase the knowledge on the stack compression test and to obtain the flow curves of the sheets of 22MnB5 for large deformations.
2. Experimental
It was necessary to validate the disc stack compression tests using AISI1045 because the 22MnB5 steel is not available in bars (not produced industrially), which does not allow comparison with conventional compression tests using a solid cylindrical sample. The samples were manufactured by commercially available AISI1045 and 22MnB5 steels. A H13 tool steel was used, which is widely applied in industry. The chemical composition of the H13 tool steel, AISI1045
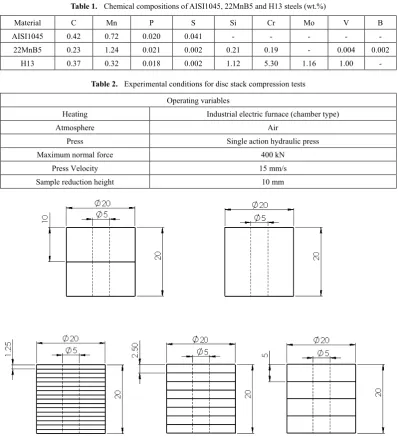
and 22MnB5 are shown in Table 1, whilst the experimental conditions are shown in Table 2. The samples of AISI1045 were fabricated in solid cylindrical shapes with 2, 4, 8 and 16 discs, as shown in Fig. 1. In addition, the samples of 22MnB5 were manufactured by cutting from a sheet metal of 45×45mm in 16 discs, each with a 1.25mm thickness. The dimensions of the samples and experimental workplan are shown in Table 3.
The samples of AISI 1045 were varied in terms of the number of discs. The strain rate used in the stack compression tests was ~1 s-1 defined using the theoretical method [11]. It was chosen to use the average strain rate of the process because the test was realized using a hydraulic press. This kind of press has a constant speed, which is impossible to maintain the strain rate constant during the tests.
Table 1. Chemical compositions of AISI1045, 22MnB5 and H13 steels (wt.%)
Material C Mn P S Si Cr Mo V B
AISI1045 0.42 0.72 0.020 0.041 - - - - - 22MnB5 0.23 1.24 0.021 0.002 0.21 0.19 - 0.004 0.002
H13 0.37 0.32 0.018 0.002 1.12 5.30 1.16 1.00 -
Table 2. Experimental conditions for disc stack compression tests Operating variables
Heating Industrial electric furnace (chamber type)
Atmosphere Air
Press Single action hydraulic press Maximum normal force 400 kN
Press Velocity 15 mm/s
Sample reduction height 10 mm
Table 3. Experimental workplan
Sample Material Discs Disc thickness (mm) height (mm) Total h0/d0
1 AISI1045 16 1.25 20 1
2 AISI1045 8 2.5 20 1
3 AISI1045 4 5 20 1
4 AISI1045 2 10 20 1
5 AISI1045 Solid cylinder 20 20 1
6 22MnB5 16 1.3 20.8 1.04
7 22MnB5 16 1.3 20.8 1.04
8 22MnB5 16 1.3 20.8 1.04
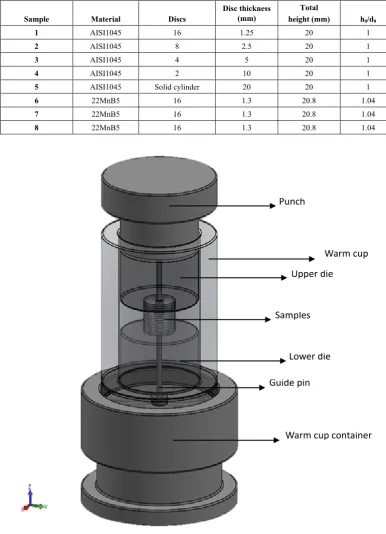
Figure 2. Schematic representation of the warm cup tool
The contact interfaces between the stacked discs samples and the dies were lubricated in the same manner as in the conventional compression test in order to ensure that the samples keep their cylindrical shape during axial compressive loading.
The stacked disc compression test is a non-standard test. Thus, the dimensions of the sample were defined in order to guarantee homogeneous flow conditions during the test. To
this end, two important concepts reported in the literature [6] were considered:
1) The samples shall not exceed a value of 1.5 when the initial height is divided by the diameter (h0/d0 ratio). This maintains the stabilization of the disc stack during the test.
2) The ratio (h0/d0) should not be too small. The sensitivity to friction with the compression dies would be significantly increased, with significant accumulation of
Warm cup
Upper die
Lower die Samples
Guide pin Punch
tension, which may cause the lubricant collapse and inhomogeneous flow of the material.
In order to obtain an optimal balance between the height and the diameter of the final test sample, the h0/d0 ratio was defined as equal to 1.
It was designed using a tool called a warm cup, as shown in Figure 2. This tool has the function of maintaining the temperature of the samples during the stack test. The warm cup is a closed cylindrical structure manufactured by H13 tool steel, where the samples are positioned within the tool between the upper and lower dies. The position of the discs that constitute the sample was warranted using a central guide pin. The literature shows that use of a guide pin has no influence on the deformation process [12]. In order to determine the temperature, 0.5-mm diameter holes were drilled in the middle of the warm cup to insert a thermocouple (K-type). It was observed a temperature stabilization for 8s, all tests were performed in less time.
3. Results
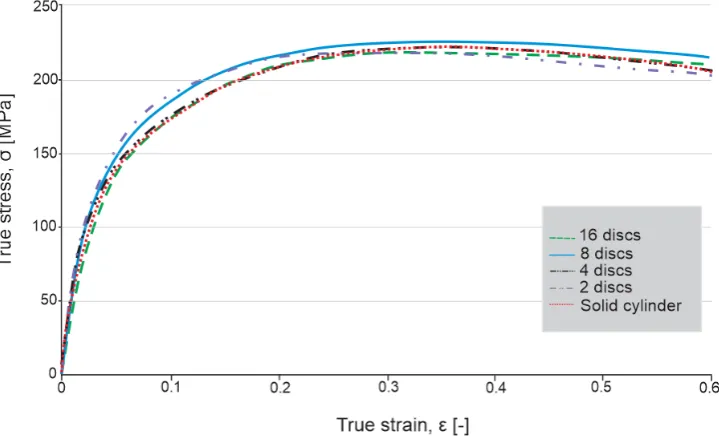
The experimental results of the validation tests using AISI1045 samples for a strain rate of 1 s-1 at 850°C with a solid cylindrical shape and 2, 4, 8 and 16 discs are shown in Figure 3. For each test configuration, the curves of the experiments are displayed. The oscillations within the individual flow curve are mainly due to fluctuation of the temperature during the compression of the samples [13].
As shown in Figure 3, the behavior of flow curves obtained by stacked discs is the same as that observed in the flow curve obtained by the compression test of the cylindrical sample. The differences are less than 10% and can be attributed to the arrangement of the discs during the
process. These results show that in the hot stacked disk compression test, the number of stacked discs does not significantly influence the flow curves. This means that the test can be implemented for discs of different thicknesses up to the limit of 16 discs.
Figure 4 shows the samples before (a) and after (b) the stack compression test at 850°C. No significant slip between adjacent discs is observed. For the test at 650°C (c), sliding of the discs is possibly observed. This demonstrates the tendency of the discs to create a union between the adjacent interfaces, which generates a greater geometric stability during the test with increasing temperature.
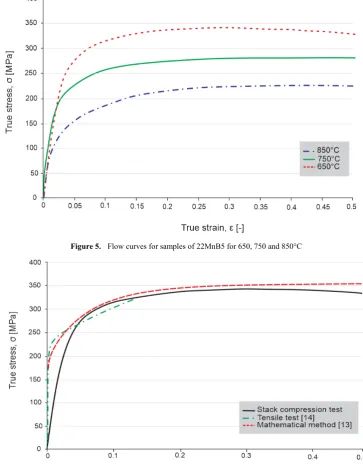
The experimental flow curves results for the samples of 22MnB5 using 16 discs for a strain rate of 1 s-1 for 650, 750 and 850°C are shown in Figure 5.
Figure 5 shows the tensions required to achieve the same degree of deformation decrease with the increase of temperature. It can be clearly observed in the curves profile format.
The 22MnB5 experimental flow curves are compared to those presented in the literature [13, 14] in Figures 6–8. When compared to the flow curves obtained by the tensile test obtained by Rohithuppaluri [14], the curves performed in this work present a small behavioral difference for small deformations. This is mainly due to the arrangement of the discs in the initial stage of the stack compression test. However, for higher deformations, the curves converge with the intersection occurring at ~0.05 at temperatures of 650 and 750°C and 0.10 for 850°C. From these points, the behavior of the curves is identical to the results obtained in the tensile test for the temperatures of 750 and 850°C, while for 650°C, the curves present a small discrepancy for the deformation of 0.12.
Figure 4. Samples used in stack compression test: (a) 16 discs stacked before compression test; (b) sample after test at 850 °C and (c) sample after test at 650°C
Figure 5. Flow curves for samples of 22MnB5 for 650, 750 and 850°C
Figure 6. Flow curves of 22MnB5 steel at 650°C. Experimental and literature parallel
Figure 7. Flow curves of 22MnB5 steel at 750°C. Experimental and literature parallel
Figure 8. Flow curves of 22MnB5 steel at 850°C. Experimental and literature parallel
When comparing the experimental curves with the curves obtained from the mathematical method by Hochholdinger [13], it is possible to observe the difference between them to small deformations. The curve obtained from the literature was modeled by a mathematical method to higher levels of deformation than those obtained by the tensile test from Rohithuppaluri [14]. Thus, it is observed that for higher values of deformation, the curves converge and present equivalent behavior. However, a small difference is also observed, which is also attributed to the accommodation of the discs in the initial stage of the compression test.
4. Conclusions
• The stack compression test was effective in all studied conditions.
• The number of discs had no influence on the flow curve results.
• The designed warm cup tool was effective for temperature stabilization during the tests.
• The flow curves obtained to 22MnB5 are analogous to those reported in the literature by other test methods.
ACKNOWLEDGEMENTS
The authors thank the IBF – RWTH Aachen University (Germany) for the technical partnership in the project BRAGECRIM; CNPq (National Council for Scientific and Technological Development) and Capes (Coordination for the Improvement of Higher Education Personnel) for financial support.
REFERENCES
[1] FERESHTEH-SANIEE F., An investigation on determination of flow curves at room temperature and under forming conditions, Journal of Materials Processing Technology, Volume 177, pages 478–482, 2006.
[2] PARTEDER E., Determination of flow curves by means of a compression test under sticking friction conditions using an iterative finite-element procedure, Journal of Materials Processing Technology, Volume 74, pages 227–233, 1998. [3] ALTAN T., Sheet Metal Forming FUNDAMENTALS, page
6, 2012.
[4] HOSFORD W. F., METAL FORMING Mechanics and Metallurgy, 2007.
[5] MERKLEIN M., A METHOD FOR THE LAYER COMPRESSION TEST CONSIDERING THE
ANISOTROPIC MATERIAL BEHAVIOR, Int J Mater Form Vol. 2, pages 483–486, 2009.
[6] ALVES L. M., Revisiting the Fundamentals and Capabilities of the Stack Compression Test.
[7] PAWELSKI, O., Über das Stauchen von Holzylindern und seine Eignung zur Bestimmung der Formänderungsfestigkeit dünner Bleche. Archiv für Eisenhüttenwesen, 38:437–442, 1967.
[8] MARTÍNEZ, A., Determining stress distribution by tension and by compression applied to steel: Special analysis for TRIP steel sheets - Materials & Design Volume 125, pages 11–25, 2017.
[9] UPPALURI R., Thermomechanical characterization of 22MnB5 steels with special emphasis on stress relaxation and creep behavior, Materials Science and Engineering: A, Volume 658, Pages 301–308, 2016.
[10] MORI, K., Hot stamping of ultra-high strength steel parts, CIRP Annals, Volume 66, pages 755–777, 2017.
[11] FINER, S., Mech. Work Technol., 12, pages 269–277, 1985. [12] SEIBEL, E. Pomp, A. Die Ermittlung der
Formanderungsfestigkeit von Mettallen durch den Stauchversuch, mitteilung d. Kaiser-Wilhelm-Instituts f. Eisenforschung, Volume 9, pages 157–171, 1927.
[13] HOCHHOLDINGER B., Grass H., Lipp, A. P., Determination of Flow Curves by Stack Compression Tests, 7th European LS-DYNA Conference, 2009.