Organized by C.O.E.T, Akola, ISTE, New Delhi & IWWA. Available Online at www.ijpret.com1
INTERNATIONAL JOURNAL OF PURE AND
APPLIED RESEARCH IN ENGINEERING AND
TECHNOLOGY
A PATH FOR HORIZING YOUR INNOVATIVE WORK
ENERGY AND STRUCTURE
DR. S. K. DESHMUKH1, DR. ABHINANDAN R. GUPTA2
1. Ph.D , M.E- Struct. Engg) Principal, C.O.E.T, Akola. 2. Ph.D, M.E, M.B.A, M in ACM)Faculty Civil Engg.
Accepted Date: 07/09/2016; Published Date: 24/09/2016
Abstract:It is indeed the fact that each specific geometry gains its own energy properties. With the change in shape of structure or body the change in energy content and its behavior with external environment changes. And thus, give reasons for having specific shapes at public assembly or gathering locations that includes temples, mosque, churches, pyramids etc. The implementation of shapes and its appropriate usage in day to day life is inspired from nature. The basic properties of various shapes, when studied empirically shows interesting finding like the volumetric content of 3-D body sphere is maximum out of all shapes but its surface area is minimum. Whereas, the surface area of 2-D body circle is maximum for minimum perimeter. The further study shows that surface area to volume ratio of tetrahedron is maximum that is 7.21 whereas of sphere is minimum that is 4.836 being length as a constant parameter. The biological science even reveals that the animals have capability to adopt as per climatic condition and thus at polar region the animals are having smaller surface area to volume ratio. The concepts of thermodynamics says that keeping all other parameters constant , more the surface area more will be heat loss. All this facts and observations, made from empirical study develop curiosity to find reason behind selection of specific shapes like pyramids, domes, shikharas in construction. The study done in this paper is related to such shapes and energy contents in it. The structures are modeled, simulated and energy calculations are done. On basis of empirical study and simulations the conclusion on energy and its relation with various shapes is drawn.
Keywords: Empirical, Volume, Surface area, Energy content.
Corresponding Author: DR. S. K. DESHMUKH
Co Author: - DR. ABHINANDAN R. GUPTA
Access Online On:
www.ijpret.com
How to Cite This Article:
S. K. Deshmukh, IJPRET, 2016; Volume 5 (2): 1-8 PAPER-QR CODE
SPECIAL ISSUE FOR
INTERNATIONAL CONFERENCE ON
“INNOVATIONS IN SCIENCE & TECHNOLOGY:
Organized by C.O.E.T, Akola, ISTE, New Delhi & IWWA. Available Online at www.ijpret.com2
INTRODUCTION
The learning’s from nature creates base for applications in technological and engineering development. Either the shape of air craft’s, motor vehicles or shape of structures all are inspired from creatures. Each of such implementation has some specific reason to accept and adopt in concern filed. Depending upon the actions (Forces) the corresponding displacement takes place and thus to make body stable, it is the way of modeling to dissolve and disperse forces acting on it. The resistive behavior of body changes with change in geometry. Which indicates proper selection of dimensions is major part of structural designing. The shape governs the behavior of body and many more of its properties. One such important property is thermo conductivity or inversely thermo resistivity. It defines the behavior of body with change in temperature or effect of temperature on various shapes if materials and external factors kept constant.
When the study of shapes and its corresponding mathematical calculations related to surface area, volume, perimeter / circumference is done, shows interesting facts related to energy content within body and bodies behavior with outer environment.
In the lack of literatures, for finding the reasons related to selections of specific shapes like pyramids, domes, stumbh, in construction for social gathering locations like in temples, mosque, churches etc., from centuries, it becomes part of curiosity to find reasons for selections of specific shapes. The absence of electricity for illumination and cooling, need of comfort zones, avoidance for sick environment and load transfer path gives some probable reason for selections but shape, energy and its effect on habitants is major part of study over here.
LITERATURE REVIEW:
Organized by C.O.E.T, Akola, ISTE, New Delhi & IWWA. Available Online at www.ijpret.com3 in terms of load bearing capacity and load transfer path ,but in lack of study of shapes of structures and its relation with energy content , further empirical and simulations work is done.
Philosophy and findings:
In this part, the comparison of various geometrical shapes and mathematical ratios is made so as to find base of selection for various structural shapes for further energy simulations process. The Philosophy of heat transfer says that larger the surface area more is amount of heat transfer if other parameters kept constant. Thus, the selection of shapes with different surface area is made over here. Some of the shapes used in public gathering areas along with regular geometrical shapes are used for finding ratios and its values.
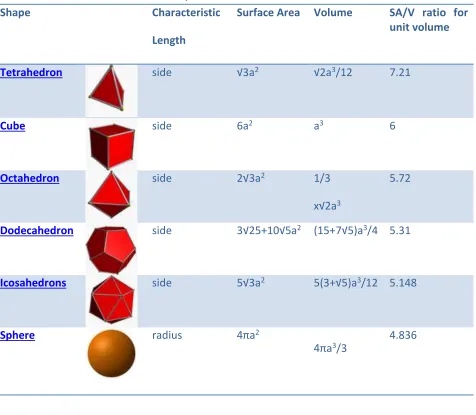
Table no 1: Geometrical shapes and its relation of surface area and volume.
Shape Characteristic
Length
Surface Area Volume SA/V ratio for
unit volume
Tetrahedron side √3a2 √2a3/12 7.21
Cube side 6a2 a3 6
Octahedron side 2√3a2 1/3
x√2a3
5.72
Dodecahedron side 3√25+10√5a2 (15+7√5)a3/4 5.31
Icosahedrons side 5√3a2 5(3+√5)a3/12 5.148
Sphere radius 4πa2
Organized by C.O.E.T, Akola, ISTE, New Delhi & IWWA. Available Online at www.ijpret.com4 It can be make out from the calculations made above , that the ratio of surface area to volume is minimum for sphere and maximum for tetrahedron. Also it is well known fact that thermal rate of heat transfer depends upon the surface area , thickness , thermal conductivity property of material and difference in temperature. Keeping all other parameters except surface area , thus there should be change in the heat exchange rate and heat content within the body.
dQ/ dt = K A Δt (1)
where, dQ is rate of heat loss per unit area dt is the thickness of element
K is the thermal conductivity of material A is surface area
Δt is the difference in temperature.
It can be seen that with increase in surface area A , the rate of heat loss will also increase if the thickness and type of material is kept constant. Thus , with change in surface area there will be change in total heat content of body and its corresponding effect on habitant. Further part is the simulations made for energy calculations for such various shapes .Initially the geometrical shape is changes but volume is kept constant later part is modified geometrical shapes that resembles the structural shapes in practice for public gathering area in various cultures and countries.
Simulations and Energy Calculations:
Organized by C.O.E.T, Akola, ISTE, New Delhi & IWWA. Available Online at www.ijpret.com5
Fig no. 1 : Regular shape models made in Sketchup for energy simulations
Results of Energy Calculations are tabulated below in table no. 2
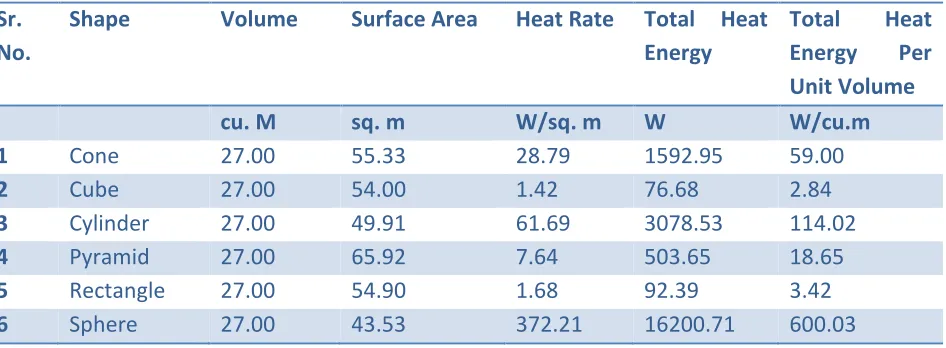
Table 2: shapes and energy contents post simulation results.
Sr. No.
Shape Volume Surface Area Heat Rate Total Heat
Energy
Total Heat
Energy Per
Unit Volume
cu. M sq. m W/sq. m W W/cu.m
1 Cone 27.00 55.33 28.79 1592.95 59.00
2 Cube 27.00 54.00 1.42 76.68 2.84
3 Cylinder 27.00 49.91 61.69 3078.53 114.02
4 Pyramid 27.00 65.92 7.64 503.65 18.65
5 Rectangle 27.00 54.90 1.68 92.39 3.42
Organized by C.O.E.T, Akola, ISTE, New Delhi & IWWA. Available Online at www.ijpret.com6
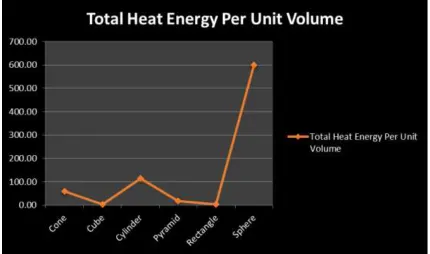
Fig. No. 2 : Line Curve Signifying Heat Gain Per unit Volume in Different Bodies With Change in Geometry
From the above table and chart, it can be seen that the geometrical element which is having higher surface area normally retains less heat energy, and thus for the various bodies with the same volumetric content, with change in shape energy gained changes. In the table above maximum energy of 600.03 W is gained by sphere which is having minimum surface area i.e., 43.53 Sq. m. The energy gained by rectangular and cubical shape is minimum. In the case of pyramid, surface area is maximum yet heat energy retained is more than rectangular or cubical element.
Second Stage Modeling & Simulation
Organized by C.O.E.T, Akola, ISTE, New Delhi & IWWA. Available Online at www.ijpret.com7
Case I Case II
Case III Case IV
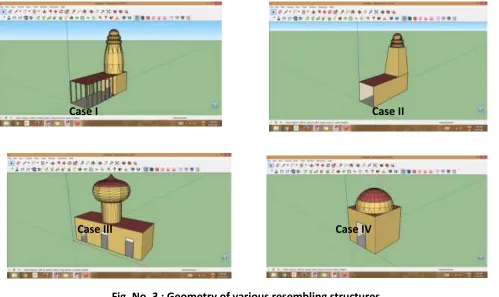
Fig. No. 3 : Geometry of various resembling structures Table No. 3 : Heat Energy Gained
Case No.
Shape Suface Area to
Volume Ratio
Heat Energy W per Sq. m
I Temple With Curved Kalash 0.500864 1594.64
II Temple With Trapezoidal Kalash 0.510405 1657.85
III Mosque 0.5227 1539.68
IV Cube With Hemisphere 1.792486 427.67
From the above simulation process, for the four structures its surface area to volume ratio is calculated from the values obtained from geometry and autocad application. The combination of fourth case is having maximum surface area to volume ratio i.e., 1.792486 and minimum
amount of energy gained i.e., 427.67 W/m2.
CONCLUSION
Organized by C.O.E.T, Akola, ISTE, New Delhi & IWWA. Available Online at www.ijpret.com8 of thermodynamics/heat transfer it has been found that more the availabilities of surface area more will be the heat transfer rate. The modeling and analysis done using Sketchup and EnergyPlus software's respectively shows expected results. Primarily, regular shapes when simulate for energy shows that maximum energy is gained by sphere followed by cylinder, cone, pyramid and minimum for rectangle and cube. To give the practical approach, new structures with combined geometry subjected to same conditions is again analyzed. Out of which it has been found that the geometry consists of cubical rectangular shape restrains less energy. Whereas the combination of domes, shikhras along with trapezoidal, cone base gains comparatively more energy. The results obtained over here are for geometry under consideration and the simulations carried out for Akola region. The results may vary with change in geometry, material consideration and geographical regions.
REFERENCES
1. Johan D. Spengler, 2000, ‘Indoor Air Quality Factors In Designing A Healthy Building’, Annual
Review Of Energy And The Environment, 25, pp 567-600.
2. D. Bansal, 2012, ‘Green Building Material –Quantification Of Embodied Energy Of Houses’,
Role Of Infrastructure For Sustainable Development, IIT Roorkee National Convention Proceedings, pp 230-236.
3. Himanshu Agrawal, 2010, ‘Building Envelops Insulation: A Key To Energy Saving And
Sustainable Development’, New Building Material & Construction World, pp 212-220.
4. Y. P. Kajale, 2012, ‘Prefab Building Technology For Sustainable Development: A Concrete
Approach In India’, Role Of Infrastructure For Sustainable Development, IIT Roorkee National Convention Proceedings, pp 94-109.
5. J. S. Chauhan, 2012, ‘Sustainable Development In Building Materials’, Role Of Infrastructure
For Sustainable Development, IIT Roorkee National Convention Proceedings, pp 161-168.
6. Alexander Kayne, 2012, ‘Computational Fluid Dynamics (CFD) Modeling Of Mixed Convection
Flows In Building Enclosures.’ Dissertation Report, Washington University.
7. Aditya Peri , Piam Mario Fernandes & Chandrashekar Vishwanadha, 2011, ‘Numerical
Simulation Of Air Flow In A General Wad Of A Hospital.’ International Journal Of Research And Science, Vol.8 Issue 3, pp 400-444.
8. Dr. B.M.Suman, Dr. Atul K. Agrawal, 1985, ‘Building Research Note: Data Bank On Thermal