6972
QUALITY BY DESIGN APPROACH TO ANALYTICAL RP-HPLC METHOD
DEVELOPMENT AND ITS VALIDATION
Khemeshwari L. Sarve1*, Atul T. Hemke1 ,Tanvi M. Anandpara2, Krishna R. Gupta3 Milind J. Umekar4
Smt. Kishoritai Bhoyar College of Pharmacy, New Kamptee, Nagpur, Maharashtra-441002(India)
*Corresponding author E-mail:
[email protected]
ARTICLE INFO ABSTRACT
Key Words
Quality by Design, HPLC, Mangiferin, Design approach
Mangiferin is an active constituent obtained from the dried parts such as leaves and barks of the mango tree (Mangifera indica L.) which belongs to the family Anacardiaceae. The present work is dealing with analytical RP-HPLC method development and validation for the determination of Mangiferin in Mangifera Indica. Quality by design (QbD) refers to the achievement of certain predictable quality with desired and predetermined specifications. A very useful component of the QbD is the understanding of factors and their interaction effects by a desired set of experiments. The proposed study describes the development of RP-HPLC method for the estimation of mangiferin using QbD approach and validation of proposed method as per ICH guidelines. An efficient experimental design based on systematic scouting of two key components of the RP-HPLC method (mobile phase and flow rate) is presented. The solution of mangiferin was made in methanol and absorption maximum was found to be 302nm. The chromatographic conditions were optimized with design expert
software 11.0 version, Agilent C18 column (250 × 4.6 mm, 5µm)used as stationary
phase, mobile phase comprisesof methanol and 0.1% OPA (53:47) and flow rate was 0.7 mL/min. The developed method was found linear (R2-0.998) within the range of 10-50 µg/mL concentrations. The precision, ruggedness and robustness values were also within the prescribed limits. The proposed method can be used for routine analysis of mangiferin in quality control laboratories.
INTRODUCTION
Mangiferin is
(1,3,6,7-tetrahydroxy2-[(2S,3R,4R,0-3,4,5 trihydroxy
(hydroxymethyl) oxane-2-yl]-xanthen-9-one
(Figure 1), widely distributed in higher plants such as Mangifera indica L. and Anemarrhena
Asphodeloides, showing antidiabetic,
antitumor, antiviral, antioxidant,
immunomodulatory and anti-inflammatory
activities.1 Quality by Design (QbD) is an
important process in pharmaceutical industry which is introduced by USFDA. It is modern, scientific methods that formalize product
design, automates manual testing and
2
According to the International Council for Harmonization (ICH),“Quality by Design is a systematic approach to drug development,
Which begins with predefined objectives, and uses science and risk management approaches to gain product and process understanding and
ultimately process control.’’3 streamline
troubleshooting.
Figure 1Structure of Mangiferin (MGN)
A Design of experiment (DOE) approach will used to identify the optimum conditions for analysis during method development. The iterative procedure used in the studies included
Journal of Global Trends in Pharmaceutical Sciences
6973 performing experiments in the region of the
best-known solution, fitting a response model to the experimental data and then optimizing
the estimated response model. The
conventional practice of modification of a single factor at a time may result in poor optimization as other factors are maintained at constant levels that do not depict the combined effect of all the factors involved in a separation. This approach is also time consuming and requires a vast number of experiments to establish optimum levels. These limitations can be eliminated by collectively optimizing all parameters using DOE.So the proposed work related to method development and its validation using QBD approach.4 The literature survey revealed that very few analytical methods were reported for estimation of Mangiferin in bulk and from
plant extract including RP-HPLC5-7 and
HPTLC8. The assay method based on QbD
approach was not located in literature. Hence
proposed work reprsents QbD based
development and validation of RP-HPLC menthod for estimation of Mangiferin.
MATERIAL AND METHOD Reagents and chemicals
Mangiferin API was purchased from Yucca Enterprises pvt. Ltd. Mumbai, methanol and acetonitrile were procured from LOBA Chemie and were HPLC grade. Ortho-Phosphoric acid, ethanol, Potassium dihydrgen orthophosphate and dimethyl formamide were used of GR grade.
Instruments and software
HPLC analysis was carried out usingShimadzu HPLC series 1100. The wavelength of maximum absorbance was detected by UV-Visible spectrometer(double beam), Shimadzu UV-1700 model and
wavelength scanning range was
200-400nmwas exercised using UV probe
software. For applying quality by design Design Expert® – Full Version 11.0software was used.
Preparation of solutions
Preparation of Diluent: It consists of mixture of Methanol: 0.1% OPA in ratio 50:50.
Preparation of 0.1% Ortho-phosphoric acid: A 1.0 mL of ortho-phosphoric acid (OPA) was transferred in 1000.0 mL volumetric flask, and volume was made upto the mark with double distill water, sonicated and filter through 0.45µm membrane filter paper.
Preparation of Mobile Phase:
50 mL of Methanol and 50 mL of 0.1% Ortho-phosphoric acid (pH 3.0) were mixed and sonicated for 15 min. to remove the air bubbles. The prepared mobile phase was
sonicated and filtered through 0.45µm
membrane filter.
Preparation of Standard Stock Solution: Weighed and transferred accurately about 10 mg of Mangiferin standard in a 10 mL volumetric flask, 5mL of diluent was added, sonicated to dissolve and diluted up to the mark with diluent. 0.1 mL portion of this solution was further diluted to 10 mL with diluent. (10 µL)
Selection of Wavelength:
Accurately weighed 10 mg of standard Mangiferin, dissolved in the 10 mL of diluent and mixed well. Transferred 0.2 mL of this solution into 10 mL volumetric flask and volume was made up to the mark. The final solution of Mangiferin standard was scanned in the range of 400-200 nm in 1.0 cm cell against blank and spectrum was recorded. The study of spectra shows that the peak maxima for Mangiferin was found to be at 302 nm and was selected for further studies. The Spectrum
was recorded is shown in Figure 2.
Figure 2 UV-Spectra of standard Mangiferin
Box-Behnken Design (BBD):9-12
BBD was chosen as a DOE tool for optimizing the method developed here, since it provides second-order equations to correlate the studied factors with the obtained responses. BBD is considered to be an alternative to the central composite design (CCD) that provides suitable mathematical models with a reduced number of experimental runs. BBD avoids the extreme experimental conditions that are usually employed in CCD, which could lead to unacceptable results. In this work, BBD was used to optimize the HPLC method and to find
Sample-1 Ab sor ban ce( Ab s) Wavelength(nm) - 1 0 1 2 3 4 5
200 250 300 350 400
6974
the effect of various dependent and
Independent Factors.
Analytical Target Profile (ATP):
ATP defines the analytical variables to be measured (i.e. level of a specified impurity), as well as performance characteristic to be obtained by this measurement (i.e. Accuracy, Precision and range). The ATP provides the link between the eventual analytical method and the chemical and formulation process. Design of Experiment (DoE):
Optimization was done by response surface methodology, applying a three level Box Behnken design with three centre points. Selection of Independent and Dependent Factors: Preliminary experiments were performed to identify the critical factors and to set their levels (maximum and minimum) for the experimental design. In this step the following parameters were investigated: The independent variables are and their Low, Medium and High levels are described in Table 1, 2 and 3. The evaluated responses (Dependent Variables) are Response Y1 (Theoretical plates), Response Y2 (Tailing Factor) and Response Y3 (Retention Time). Based on the results obtained during the preliminary studies, the method chosen for
assay method development with the shortest analysis time was threefactors, three-level BBD with three replicates at the centre point (middle level).
Optimization ofthe method: The method optimization was done by studying parameters such as system suitability test linearity of response and % estimation of drug.
Method validation:13
Precision: The intermediate precision of an analytical procedure expresses the closeness of agreement (Degree of Scatter) between a series of measurements obtained from multiple sampling of the same homogenous sample under the prescribed conditions. For Intraday and Interday variation, the sample was prepared as per the procedure described earlier, analysed at specified intervals and % Label Claim was calculated as shown in Table 4.
Recovery Study (Accuracy):
The Accuracy of an analytical procedure expresses the closeness of agreement between the value that is accepted either as a conventional true value or as an accepted reference value and the value found.
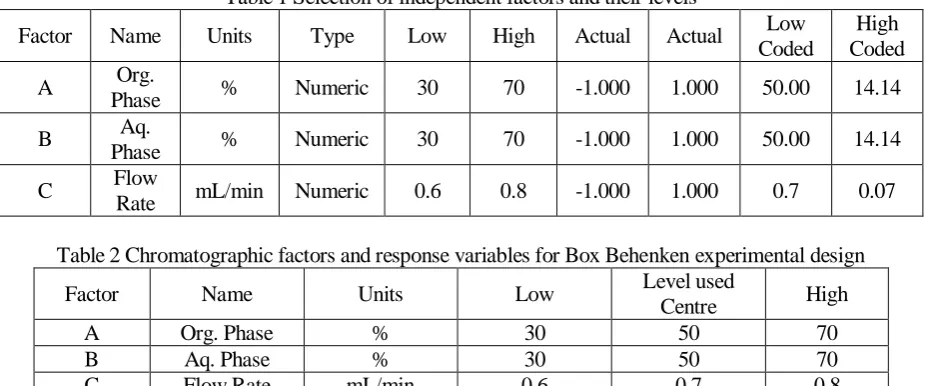
Table 1 Selection of independent factors and their levels
Factor Name Units Type Low High Actual Actual Low
Coded
High Coded
A Org.
Phase % Numeric 30 70 -1.000 1.000 50.00 14.14
B Aq.
Phase % Numeric 30 70 -1.000 1.000 50.00 14.14
C Flow
Rate mL/min Numeric 0.6 0.8 -1.000 1.000 0.7 0.07
Table 2 Chromatographic factors and response variables for Box Behenken experimental design
Factor Name Units Low Level used
Centre High
A Org. Phase % 30 50 70
B Aq. Phase % 30 50 70
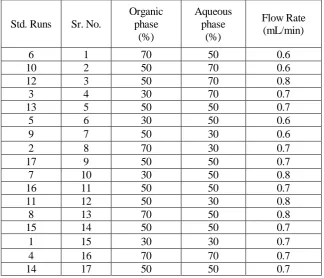
6975 Table 3 Box-Behnen design used in HPLC method optimization
Std. Runs Sr. No.
Organic phase
(%)
Aqueous phase
(%)
Flow Rate (mL/min)
6 1 70 50 0.6
10 2 50 70 0.6
12 3 50 70 0.8
3 4 30 70 0.7
13 5 50 50 0.7
5 6 30 50 0.6
9 7 50 30 0.6
2 8 70 30 0.7
17 9 50 50 0.7
7 10 30 50 0.8
16 11 50 50 0.7
11 12 50 30 0.8
8 13 70 50 0.8
15 14 50 50 0.7
1 15 30 30 0.7
4 16 70 70 0.7
14 17 50 50 0.7
Table 4 Observations and results of intermediate precision Sr.
No.
Time (Hrs)
AUC (mAU)
% Label
Claim Day
AUC (mAU)
% Label Claim
1. 0th 581.192 101.00 1st 596.011 100.80
2. 3rd 581.278 100.48 2nd 598.069 101.17
3. 5th 582.309 101.44 3rd 597.892 98.28
Mean 100.97 Mean 100.08
±SD 0.480 ±SD 1.572
%RSD 0.475 %RSD 1.57
Preparation of Sample: An accurately weighed quantity of preanalysed Mangiferin sample was transferred in a series of 10 mL volumetric flasks and Mangiferin standard drug was added at three different levels (80%, 100% and 120%), 5 mL of diluent was added and sonicated for 20 min. The volume was made up to the mark and filtered through 0.45µm membrane filter. A 0.1 mL portion was diluted to 10 mL with diluent. A 20µl volume of each final dilution were injected separately and chromatographed. The result was tabulated in Table 5.
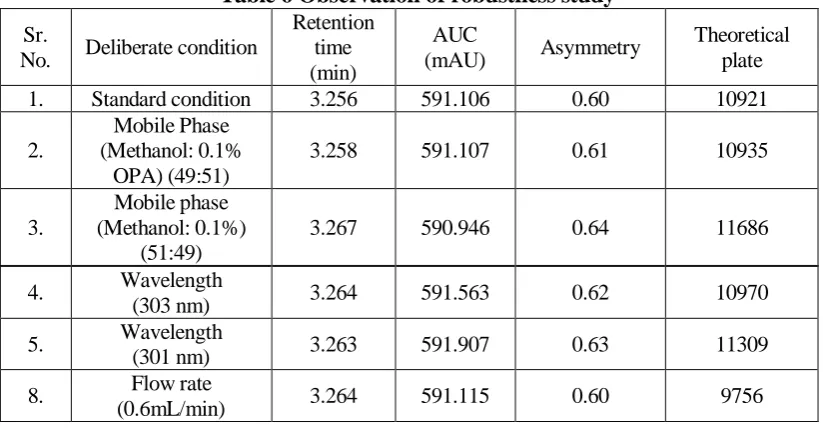
Robustness: Deliberate change was made in the optimized chromatographic parameter and robustness of the method was studied by evaluating system suitability parameter data after varying the mobile phase composition,
detection wavelength and flow rate. The observations recorded inTable 6.
Limit of Detection and Limit of Quantitation:
Limit of Detection (LOD): The detection limit of an individual analytical procedure is the lowest amount of analyte in the sample which can be detected but not necessarily quantified as an exact value.
6976 3.3 𝜎
Limit of Detection (LOD) = S Where,
𝜎 = the standard deviation of the response S = the slope of the calibration curve 10 𝜎 Limit of Quantitation (LOQ) = S RESULTS
Design Model Evaluation
The significance of model so obtained can be evaluated by ANOVA method.ANOVA is a statistical method based on F-test to estimate the significance of model. It involves sub-dividing total variation into variation due to Main effects and Interactions.
ANOVA Technique:
The ANOVA (One-way Analysis of Variance) is used to determine whether there are any significant differences between the means of three or more independent groups.
Theoretical Plates: The Model F-value of 3.19 implies the model is significant. There is only a 5.13% chance that a Model F-Value this large may be occurring due to noise.P-Values less than 0.0500 indicate model terms are
significant. Values greater than 0.1000 indicates the model terms are not significant.In this case, B and AB are significant model terms.
Tailing Factor: The Model F-value of 5.04 implies the model is significant. There is only a 2.23% chance that a Model F-Value this large may be occurring due to noise. P-Values less than 0.0500 indicate model terms are significant. Values greater than 0.1000 indicates the model terms are not significant.
In this case A, B and C2 are significant model
terms.
Retention Time: The Model F-value of 16.54 implies the model is significant. There is only a 0.06% chance that a Model F-Value this large may be occur due to noise.P-Values less than 0.0500 indicate model terms are significant. Values greater than 0.1000 indicates the model terms are not significant.In this case A, C, AC, B2, C2 are significant model terms.
Table 5 : Observation and results of recovery study
Accuracy Level (%)
Amount of Std. drug added (mg)
AUC of Sample (mV)
Amount of drug recovered (mg)
% Recovery*
80 8.05 257.66 7.92 98.38
100 9.98 284.49 9.86 98.95
120 12.05 313.26 11.98 99.25
Mean 98.86
±SD 1.61
%RSD 1.63
*Each observation is mean of three observations.
Table 6 Observation of robustness study
Sr.
No. Deliberate condition
Retention time (min)
AUC
(mAU) Asymmetry
Theoretical plate
1. Standard condition 3.256 591.106 0.60 10921
2.
Mobile Phase (Methanol: 0.1%
OPA) (49:51)
3.258 591.107 0.61 10935
3.
Mobile phase (Methanol: 0.1%)
(51:49)
3.267 590.946 0.64 11686
4. Wavelength
(303 nm) 3.264 591.563 0.62 10970
5. Wavelength
(301 nm) 3.263 591.907 0.63 11309
8. Flow rate
6977
9. Flow rate
(0.8mL/min) 2.866 580.126 0.64 9677
Mean 3.2054 589.695 0.62 10750.57
±SD 0.0719 5.2330 0.017 511.45
%RSD 1.67 1.28 1.97 1.84
Table7 Results for LOD and LOQ Mangiferin (mg/mL)
LOD 1.123
LOQ 3.404
Table 8(a) Model summary statistics for response Y1 (Theoretical plate) Sr.
No. Source Std. Dev. R-Squared
Adjusted R-Squared
Predicted
R-Squared PRESS
1 Linear 2997.72 0.3285 0.1736 -0.3783 2.398E+08
2 2FI 2443.98 0.6567 0.4507 -0.6504 2.871E+08
3 Quadratic 2684.93 0.7100 0.3370 -3.6407 8.074E+08
4 Cubic 0.0000 1.0000 1.0000
Table 8(b)Model Summary Statistics for response Y2 (Tailing Factor)
Sr.
No. Source Std. Dev. R-Squared
Adjusted R-Squared
Predicted
R-Squared PRESS
1 Linear 0.3359 0.5577 0.4557 0.1825 2.71
2 2FI 0.3739 0.5784 0.3254 -0.7159 5.69
3 Quadratic 0.2518 0.8662 0.6942 -1.1408 7.10
4 Cubic 0.0000 1.0000 1.0000
Table 8(c)Model Summary Statistics for response Y3 (Retention Time)
Sr.
No. Source Std. Dev. R-Squared
Adjusted R-Squared
Predicted
R-Squared PRESS
1 Linear 0.3142 0.5193 0.4084 0.1667 2.22
2 2FI 0.3279 0.5974 0.3558 -0.3497 3.60
3 Quadratic 0.1309 0.9551 0.8974 0.2815 1.92
4 Cubic 0.0000 1.0000 1.0000
Main Effects (Lack of Fit)
The Lack of Fit is one of the components of partition of the sum of squares in an ANOVA which can tell that proposed model is fit or not. Results are shown in Table 8(a) to 8(c). Interactions
It helps to determine the effects between various factors, also used to determine the quadratic equation.
Generalised 2FI equation for Response Y1 (Theoretical plates)
7609.41+A-B+C+AB-AC+BC
Generalised Quadratic equation for Response Y2(Tailing Factor)
6978 Generalised Quadratic equation for Response
Y3 (Retention Time)
3.29-A+B-C+AB+AC-BC+ A2+B2+C2
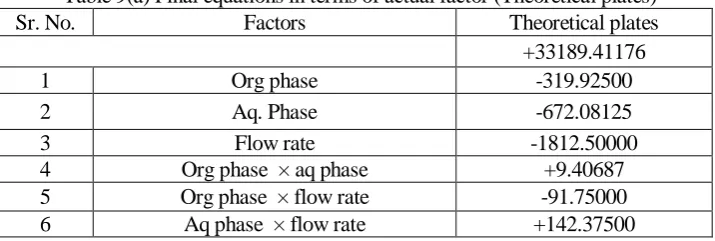
Table 9(a) to 9(c) represents the final equation in terms of Actual factors.
The observations of counter plots are shown in Figure 3(a)-3(c).
Figure 3(a)Counter plot for Y1 response for Theoretical Plates
Figure 3(b) Counter plot for Y2 response for Tailing Factor
Figure 3(c) Counter plot for Y3 response for Retention Time
Final predicted responses for Dependent Factors:
After performing the study software has predicted the values for our selected factors
(Table 10) based on above predicted
chromatographic conditions and expected response
System Suitability Test (SST):
The standard solution prepared above was used to study the system suitability test. After equilibrium of column with mobile phase, five replicate injections of 20µg/mL solution were injected through the manual injector and the recorded chromatogram is shown in the Figure 5 andthe peak area were measured. The
observations of SST are shown in Table
11.From the obtained chromatogram, Mangiferin have retention time 3.264min. The asymmetry of the peak was 0.57 and %RSD was found to be 0.44 indicating the system is suitable for analysis.
Linearity of Test Method:
The linearity of an analytical procedure is its ability (within a given range) to obtain a test results which are directly proportional to the concentration of analyte present in the sample. Procedure:
Accurately weighed quantity of about 10 mg Mangiferin API was transferred to a 10 mL volumetric flask, dissolved in sufficient quantity of diluent and diluted up to mark with diluent. From the standard stock solution, accurately pipette out 0.1 mL to 0.5 mL were transferred to a series of 10 mL volumetric flasks and diluted upto the mark with diluent to get the solution having the concentration of 10 µg/mL to50 µg/mL respectively. All the solutions prepared above were injected to the
HPLC system under optimized
chromatographic parameters.
The system was allowed to equilibrate by
passing the mobile phase through
chromatographic column. After equilibration, standard solutions having a volume of 20µL was injected in ascending order of different concentration levels for Mangiferin. Linearity of test response was established by plotting a graph between peak areas versus concentration of drug in µg/mL. The correlation coefficient for Mangiferin was found to be 0.998 indicates
proposed method is linear as shown in Figure
6.
Table 9(a) Final equations in terms of actual factor (Theoretical plates)
Sr. No. Factors Theoretical plates
+33189.41176
1 Org phase -319.92500
2 Aq. Phase -672.08125
3 Flow rate -1812.50000
4 Org phase × aq phase +9.40687
5 Org phase × flow rate -91.75000
6979 Table 9(b) Final equations in terms of actual factor (Tailing Factor)
Sr. No. Factors Tailing Factor
+22.88000
1 Aq phase -0.016875
2 Flow rate +0.024875
3 Org phase × aq phase -64.05000
4 Org phase × flow rate -0.000325
5 Aq phase × flow rate -2.40437E-16
6 Org phase² -0.007500
7 Aq phase² +0.000163
8 Flow rate² +0.000138
9 Org phase +46.00000
Table 9(c) Final equations in terms of actual factor (Retention Time)
Sr. No. Factors Retention Time
+32.29250
1. Aq phase -0.111625
2. Flow rate -0.053750
3. Org phase × aq phase -67.15000
4. Org phase × flow rate +0.000275
5. Aq phase × flow rate +0.100000
6. Org phase² -0.002500
7. Aq phase² +0.000144
8. Flow rate² +0.000444
9. Org phase +42.25000
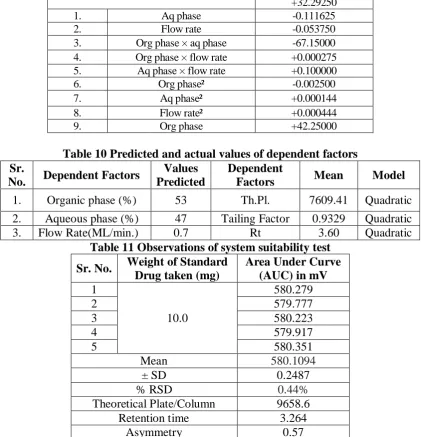
Table 10 Predicted and actual values of dependent factors
Sr.
No.
Dependent Factors
Values
Predicted
Dependent
Factors
Mean
Model
1.
Organic phase (%)
53
Th.Pl.
7609.41
Quadratic
2.
Aqueous phase (%)
47
Tailing Factor
0.9329
Quadratic
3.
Flow Rate(ML/min.)
0.7
Rt
3.60
Quadratic
Table 11 Observations of system suitability test
Sr. No.
Weight of Standard
Drug taken (mg)
Area Under Curve
(AUC) in mV
1
10.0
580.279
2
579.777
3
580.223
4
579.917
5
580.351
Mean
580.1094
± SD
0.2487
% RSD
0.44%
Theoretical Plate/Column
9658.6
Retention time
3.264
6980
4(a)Surface response curve for Y1 response (Theoretical plates)
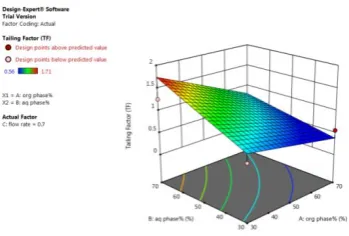
Figure 4(b)Surface response curve for Y2 response (Tailing factor)
Figure 4(c)Surface response curve for Y3 response (Retention Time)
Figure 5:Chromatogram of system suitability test (Std. MGN)
Figure 6: Plot of linearity curve for MGN
y = 14.079x + 4.765 R² = 0.998
0 200 400 600 800
0 20 40 60
AUC
6981
Percent estimation of MGN
An accurately weighed quantity of
previously
prepared
solid
dispersion
(Powder form) equivalent to 10 mg of
MGN was transferred to 10 mL of
volumetric flask, sonicated for 15 min with
sufficient quantity of diluent (mobile
phase) and volume was made up to mark
with diluent. The content of flask was
filtered through 0.45µm filter paper. A 1
mL portion of the filtered was further
diluted to 10 mL with diluent. Further 1
mL of solution was transferred in 10 mL
volumetric flaskand volume was made up
to the mark with mobile phase. After
equilibration of stationary phase, such five
sample solutions were prepared from same
working stock solution, injected separately
and chromatogram were recorded. A
chromatogram so obtained depicted in
Figure 7and 8.
The content of MGN in
each sample was calculated by comparing
the peak area of sample with that standard
using formula. The results are shown in
Table 12
represents proposed method was
found precise.
DISCUSSION:
There were few works
reported on implementation of quality by
design in analytical method development.
But the sequence of implementation has to
be considered as per FDA. Some articles
have reported a method based on stability
assay by considering resolution, as a
method response to support specificity in
robustness. However, method verification
in design space, method performance has
to be added. The knowledge based QTPP
for the product of Mangiferin was
constructed with the assessment of
criticality
for
its
critical
attribute.
Analytical target profile (ATP) was
derived based on QTPP profile and then
objective of this analytical QbD work was
considered as assay component of QTPP
of product specifications. To initiate the
QbD work, organic phase (X1), aqueous
phase (X2) and flow rate (X3)considered
as
independent
variables
whereas
theoretical plates (Y1), tailing factor (Y2)
and retention time (Y3) was selected as
dependent variables. BBD is considered to
an alternative to CCD. BBD avoid an
extreme experimental condition that are
usually employed in CCD and was used to
optimise the HPLC method. Agilent
C
18(250X4.6mm,
5µm)
column
was
chosen as stationary phase due to wide
acceptability of pharmaceuticals and high
reproducibility.
The
mobile
phase
composed of methanol and 0.1%
ortho-phosphoric acid (53: 47) and wavelength
selected for analysis was 302nm. The
obtained experimental results was
subjected to various statistical parameter
for better understanding and was found
nonlinear
relationship
between
input
variable and response. The prediction form
MODR has been verified by actual
experimental
results
indicating
its
robustness. Thus the method developed
based on AQbD is more precise, accurate,
and robust during method transfer and also
cost effective. This method satisfy the
design space concept for analytical method
(MODR) and suitable for regulatory
submission under regulatory flexibility.
Figure 7- Chromatogram of Standard MGN
6982
Table 12 Observations for estimation of MGN
Sr. No.
Wt. of Std. taken (mg)
Wt. of sample taken (mg)
AUC Sample (mAU)
Amt. of drug estimated
(mg)
% Label Claim
1.
10.0 20.28
581.125 10.11 99.79
2. 585.225 10.12 99.88
3. 588.477 10.15 99.95
4. 592.785 10.21 100.72
5. 598.211 10.18 100.08
Mean 100.09
±S.D. 0.383
%RSD 0.38
CONCLUSION
A novel simple, fast and robust RP-HPLC
analytical
method
of
MGN
was
successfully developed by employing QbD
approach and further validated according
to ICH guidelines. By the use of DOE
approach where box-behnken designs was
used to analyse the various analytical
target profile. The automated QbD method
development approach provide a better
performing and more robust method in less
time as compared to the manual method of
development.
Acknowledgement:
The authors are
thankful to the Principal, SKB College of
Pharmacy Kamptee, Dist Nagpur for
providing necessary facilities for research
work. We are also grateful to Yucca
Enterprises
Pvt.
Ltd.
Mumbai
for
providing gift samples of pure Mangiferin.
REFERENCES
1.
Chemistry
of
Mangiferin:
https://en.m.wikipedia.org/wiki/Mangif
erin. (Accessed on 12 July, 2018).
2.
Vogt F, Kord A. Development of
Quality by Deign analytical method.
Journal of Pharmaceutical Science.
2011; 100(3):797-800.
3.
Peraman R, Bhadrya K, Reddy Y.
Analytical Quality by design: A tool
for regulatory flexibility and Robust
Analytics. International Journal of
Analytical Chemistry. 2015;
6(2):101-116.
4.
Vinayak A, Lateef S. Automated QbD
based
Method
Development
and
Validation of Oxidative Degraded
Atorvastatin. Agilent Technologies.
2014; 5(20):1.12.
5.
Bossunia M, Urmi K, Shaha C.
Quality-by-Design
approach
to
stability
indicating
RP-HPLC
analytical method development for
estimation of Canagliflozin API and its
validation. Pharma Method. 2017;
8(2):92-101.
6.
Kammalla A, Ramasamy M, Agarwal
A, Dubey G. Development and
Validation of a RP-HPLC method for
the simultaneous determination of
Mangiferin,
Ellagic
acid
and
Hydroxycitric
acid
in
polyherbal
formulation. Pharmacognosy Journal.
2014; 6(3):23-28.
7.
Kumar P, Srivastava V, Kumar L.
Development of new reversed-phase
HPLC method for the determination of
Mangiferin
in
Mangifera
indica
Linn.Biosciences,
Biotechnology
Research Asia. 2008; 5(1):383-388.
8.
Padh H, Parmar S, Patel B. Stability
indicating
HPTLC
method
for
estimation of Mangiferin in bulk and
dosage form. International Journal of
Pharmacy and Biological Sciences.
2017; 7(3):71-77.
9.
Hemant B, Mulchand K, Saranjeet S,
Sarwar B, and Bhupinder S. QbD in
analytical sciences: An overview.
Pharma Times. 2014; 46 (8):71-75.
10.
Loyd D, Bergum J. Application of
Quality by Design (QbD) to the
6983