Available Online at www.ijpret.com 98
INTERNATIONAL JOURNAL OF PURE AND
APPLIED RESEARCH IN ENGINEERING AND
TECHNOLOGY
A PATH FOR HORIZING YOUR INNOVATIVE WORK
COMPARATIVE STUDY OF SEISMIC RESPONSE OF REGULAR AND
IRREGULAR BUILDING WITH SHEAR WALL
M. S. UCHIBAGLE, ROSHANI V. RAMTEKE Dept. of Civil Engineering, KITS, Ramtek, Nagpur
Accepted Date: 15/03/2016; Published Date: 01/05/2016
\
Abstract: This paper describes comparative study of seismic response of regular and irregular buildings with different positioning of shear wall by response spectrum method and time history analysis. Multistoried buildings are provided with shear wall at various positions. When walls are situated in advantageous positions in a building, they can be very efficient in resisting lateral loads originating from wind or earthquakes. Reinforced concrete framed buildings are adequate for resisting both vertical and horizontal loads acting on them. Extensive research has been done in the design and analysis of regular and irregular building. Present study includes seismic response of regular and irregular building with and without shear wall was carried out to understand the lateral loads, displacement and member end forces. An earthquake load is calculated by seismic coefficient method using IS 1893 (PART–I):2002. These analyses were performed using SAP 2000 15. Test results including base shear, displacement, and moment are presented and effect of seismic response by time history method and response spectrum method is studied.
Key words:RC Structure, SAP 2000 14, shear wall, seismic analysis, dynamic comparison
Corresponding Author: MS. M. S. UCHIBAGLE
Access Online On:
www.ijpret.com
How to Cite This Article:
M. S. Uchibagle, IJPRET, 2016; Volume 4 (9): 98-110
Available Online at www.ijpret.com 99 INTRODUCTION
The dynamic loadings to be discussed are in the response spectrum method and the linear time-history analysis. The first one is widely used as it applies to the major part of a seismic analysis necessary for design purpose. The second method provides more detailed information regarding the seismic behaviour of a structure and is therefore used for more specific earthquake analyses. Both methods assume linear behaviour of the structure, i.e. proportionality between forces and deformation. This paper introduces the seismic response of regular and irregular buildings with shear wall. Generally shear wall can be defined as structural vertical member that is able to resist combination of shear, moment and axial load induced by lateral load and gravity load transfer to the wall from other structural member. Reinforced concrete walls, which include shear walls, are the usual requirements of Multi Storey Buildings. An introduction of shear wall represents a structurally efficient solution to stiffen a building structural system because the main function of a shear wall is to increase the rigidity for lateral load resistance. Now the dynamic loading on building is considered as El Centro ground motion, the north-south component of the recorded at a site, California during the Imperial Valley earthquake of May 18, 1940.
Literature
A study by Le Yee Mon (2014); In this paper present a fourteen storied Y-shaped high rise reinforced concrete building in seismic zone 4 is done by ETABS v 9.7.1 software using response spectrum analysis which is analyzed by changing various location of shear wall and found that When core shear wall placed at stair case & lift of building and planar shear walls placed at outer corner symmetrically X and Y direction gives better performance among the other models.
A study by R.Chittiprolu, R. Pradeep Kumar (2014) examines the significance of dynamic linear analysis using response spectrum method is performed and lateral load analysis is done for structure without shear wall and structure with shear wall. It is also observed that lateral forces are reducing when the shear walls are added at the appropriate locations of frames having minimum lateral forces.
Available Online at www.ijpret.com 100
A study by P.S. Kumbhare (2012) was conducted to investigate the effectiveness of shear wall in a residential medium rise building considering frame system and duel system and found that frame type structural system becomes economical as compared to the dual type structural system and it can be used for medium rise residential buildings situated in high seismic zone.
Problem Statement
A residential building of G+10 regular structure having the base dimension of plan 16 m x 16 m with typical floor of height 3m is considered for the analysis. Spacing of frame is 4m.The structure is planned to be reinforced concrete with cement/fly ash brick infill wall. The structure is modeled using standard software SAP 2000 14. Geometry of the building for the column and beam has been considered as 350mm x 600mm. Material grades of M25 & Fe415 were used for the design
Structural properties of RC Building
Shear wall thickness =0.2 m, Total depth of slab=0.12 m, External wall thickness= 0.25 m, Internal wall thickness=0.15 m, Size of external column= 0.35 x 0.6 m, Size of internal column= 0.4 x 0.4 m, Size of beam in longitudinal and Transverse direction =0.35 x 0.6 m.
Following figures shows the plan of different models of regular and irregular building.
Available Online at www.ijpret.com 101 Fig. 2 MR TYPE 1 (Model of Building with Shear Wall type1 at corner)
Fig. 3 MR TYPE 2 (Model of Building with Shear Wall type2 at middle)
Fig. 4 MR TYPE 3 (Model of Building with Shear Wall type3 at centre)
Available Online at www.ijpret.com 102 Fig. 6 MIR TYPE 5 (Model of Irregular Building with Shear Wall present irregularly)
Fig. 7 MIR TYPE 6 (Model of Irregular Building with Shear Wall present irregularly)
RESULT SUMMERY
Asana Analysing the building of Regular and irregular model structure by using SAAP 2000 15
software, got the following result by response spectrum method and time history method, and compare the results of both the method
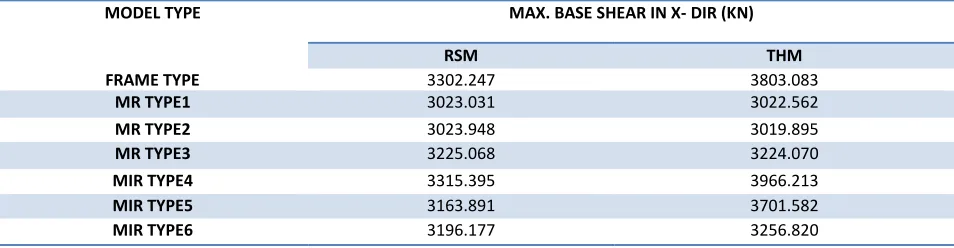
Table 1: Comparison of Max. base Shear in x dir. by RSM and THM of various model
MODEL TYPE MAX. BASE SHEAR IN X- DIR (KN)
RSM THM
FRAME TYPE 3302.247 3803.083
MR TYPE1 3023.031 3022.562
MR TYPE2 3023.948 3019.895
MR TYPE3 3225.068 3224.070
MIR TYPE4 3315.395 3966.213
MIR TYPE5 3163.891 3701.582
MIR TYPE6 3196.177 3256.820
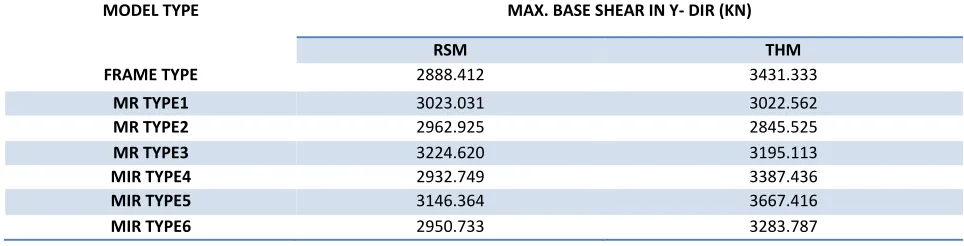
Available Online at www.ijpret.com 103 Table 2: Comparison of Max. Base Shear in y dir. by RSM and THM of various model
MODEL TYPE MAX. BASE SHEAR IN Y- DIR (KN)
RSM THM
FRAME TYPE 2888.412 3431.333
MR TYPE1 3023.031 3022.562
MR TYPE2 2962.925 2845.525
MR TYPE3 3224.620 3195.113
MIR TYPE4 2932.749 3387.436
MIR TYPE5 3146.364 3667.416
MIR TYPE6 2950.733 3283.787
Table 3: Comparison of Max. Moment by RSM and THM of various model
MODEL TYPE MAX. MOMENT (KN-m)
RSM THM
FRAME TYPE 26417.9827 30424.6685
MR TYPE1 24184.2513 23305.9861
MR TYPE2 24191.5884 24293.1734
MR TYPE3 25800.5424 25792.5708
MIR TYPE4 31603.0262 37680.4247
MIR TYPE5 43020.6358 50422.4873
MIR TYPE6 32997.9751 35556.1317
Fig 8: Comparison of Max. base shear in x (KN)
This graph shows maximum base shear in x- direction by RSM ahd THM, by comparing the maximum base shearin building is found in irregular type4. Hence the sesmics force at the base of building is maximum at MIR TYPE 4 comapre to all method
0 500 1000 1500 2000 2500 3000 3500 4000 4500
FRAME TYPE
MR TYPE1
MR TYPE2
MR TYPE3
MIR TYPE4
MIR TYPE5
MIR TYPE6
B
ASE
S
HE
AR
(
K
N)
MAX. BASE SHEAR IN X-DIR
MAX. SHEAR IN X- DIR (KN) RSM
Available Online at www.ijpret.com 104 Fig 9: Comparison of Max. base Shear in y (KN)
This graph shows maximum base shear in y- direction by RSM ahd THM, observed that the base shear in y-direction is maximum in MIR TYPE 5 compare to all by time history method.
The maximum reducing moment is found in building MR TYPe 1 compare to all ,and reducion in boththe method is 5 to 15%
Fig 10: Comparison of Max. Moment (KN-m)
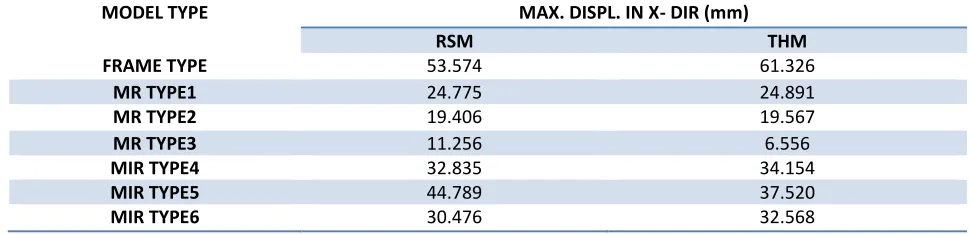
Table 4: Comparison of max. Displacement in x direction by RSM and THM
MODEL TYPE MAX. DISPL. IN X- DIR (mm)
RSM THM
FRAME TYPE 53.574 61.326
MR TYPE1 24.775 24.891
MR TYPE2 19.406 19.567
MR TYPE3 11.256 6.556
MIR TYPE4 32.835 34.154
MIR TYPE5 44.789 37.520
MIR TYPE6 30.476 32.568
0 500 1000 1500 2000 2500 3000 3500 4000 FRAME TYPE MR TYPE1 MR TYPE2 MR TYPE3 MIR TYPE4 MIR TYPE5 MIR TYPE6 B ASE S HE AR (K N)
MAX.BASE SHEAR IN Y -DIR
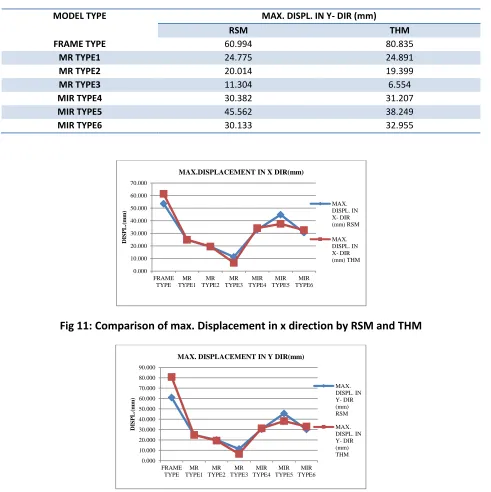
Available Online at www.ijpret.com 105 Table 5: Comparison of max. Displacement in y direction by RSM and THM
MODEL TYPE MAX. DISPL. IN Y- DIR (mm)
RSM THM
FRAME TYPE 60.994 80.835
MR TYPE1 24.775 24.891
MR TYPE2 20.014 19.399
MR TYPE3 11.304 6.554
MIR TYPE4 30.382 31.207
MIR TYPE5 45.562 38.249
MIR TYPE6 30.133 32.955
Fig 11: Comparison of max. Displacement in x direction by RSM and THM
Fig 12: Comparison of max. Displacement in y direction by RSM and THM
Maximum displacement is minimum in MR TYPE 3 both in x and y direction. Comparison between all type of building observed that the MRTYPE 3 gives the better displacement than the others. This is the safe and effective.
0.000 10.000 20.000 30.000 40.000 50.000 60.000 70.000 FRAME TYPE MR TYPE1 MR TYPE2 MR TYPE3 MIR TYPE4 MIR TYPE5 MIR TYPE6 DI S P L .( m m )
MAX.DISPLACEMENT IN X DIR(mm)
MAX. DISPL. IN X- DIR (mm) RSM MAX. DISPL. IN X- DIR (mm) THM 0.000 10.000 20.000 30.000 40.000 50.000 60.000 70.000 80.000 90.000 FRAME TYPE MR TYPE1 MR TYPE2 MR TYPE3 MIR TYPE4 MIR TYPE5 MIR TYPE6 DI S P L .( m m )
MAX. DISPLACEMENT IN Y DIR(mm)
Available Online at www.ijpret.com 106 Table 6: Comparison of max. Axial force in column by RSM and THM
MODEL TYPE MAX. AXIAL FORCE IN COLUMN (KN)
RSM THM
FRAME TYPE 4190.303 4483.671
MR TYPE1 2707.592 2717.592
MR TYPE2 2728.392 2756.24
MR TYPE3 271.99 171.36
MIR TYPE4 311.823 318.303
MIR TYPE5 788.81 804.145
MIR TYPE6 434.806 439.261
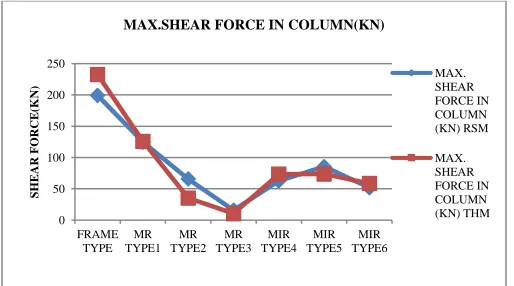
Table 7: Comparison of max. Shear force in column by RSM and THM
MODEL TYPE MAX. SHEAR FORCE IN COLUMN (KN)
RSM THM
FRAME TYPE 199.149 232.595
MR TYPE1 124.72 125.715
MR TYPE2 65.816 35.37
MR TYPE3 15.922 10.412
MIR TYPE4 62.716 73.398
MIR TYPE5 85.523 73.748
MIR TYPE6 51.818 58.519
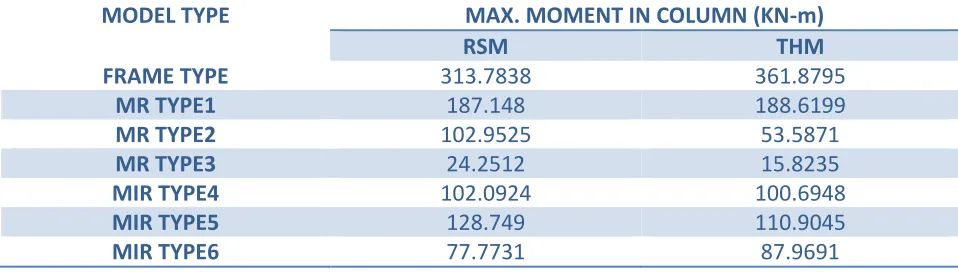
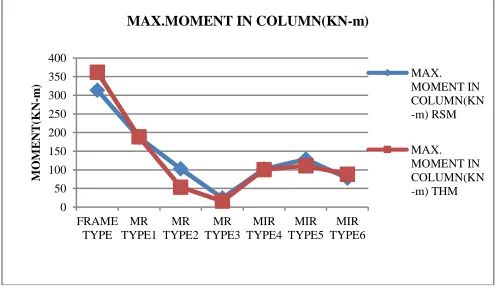
Table 8: Comparison of max. Moment in column by RSM and THM
MODEL TYPE MAX. MOMENT IN COLUMN (KN-m)
RSM THM
FRAME TYPE 313.7838 361.8795
MR TYPE1 187.148 188.6199
MR TYPE2 102.9525 53.5871
MR TYPE3 24.2512 15.8235
MIR TYPE4 102.0924 100.6948
MIR TYPE5 128.749 110.9045
Available Online at www.ijpret.com 107 Fig 13: Comparison of max. Axial force in column by RSM and THM
The above graph found that the results are nearly same by both the methods. The maximum asial force is in frame type building and minimum in MR TYPE 3 while compare to that frame type structure to all models the reduction is coming 30 to 50% .
Fig 14: Comparison of max. shear force in column by RSM and THM
The graph shows the comparision of maximum shear force and building types it observed that MR TYPE 3 building column gives minimum shear force as compare to others. And compare to that frame type structure the reduction is coming 40 to 50%.
0 500 1000 1500 2000 2500 3000 3500 4000 4500 5000 FRAME TYPE MR TYPE1 MR TYPE2 MR TYPE3 MIR TYPE4 MIR TYPE5 MIR TYPE6 AX IAL F ORCE (K N)
MAX.AXIAL FORCE IN COLUMN(KN)
MAX. AXIAL FORCE IN COLUMN (KN) RSM MAX. AXIAL FORCE IN COLUMN (KN) THM 0 50 100 150 200 250 FRAME TYPE MR TYPE1 MR TYPE2 MR TYPE3 MIR TYPE4 MIR TYPE5 MIR TYPE6 S HE AR F ORCE (K N)
MAX.SHEAR FORCE IN COLUMN(KN)
Available Online at www.ijpret.com 108 Fig 15: Comparison of max. Moment in column by RSM and THM
Above graph shows that moment is more effective in model of regular building type 3 in columns. Nd hence reduction observed by both the method is 10 to 20 %. Also observed that the result are found to be nearly same by both the methods.
CONCLUSION
In this study, the analysis of multistoried buildings was done by SAP 2000 14 software using response spectrum analysis and time history analysis. Based on the results of analysis , following conclusions were inferred.
A. By comparing the two methods, the displacement of the building has been reduce due to the presence of shear wall placed at the centre (MR TYPE 3) in x, y direction compare to all models
B. In THM, the maximum base shear observed in irregular model type 4 as compare to other models in x direction.
C. In y direction, the base shear is more in irregular model type 5 compare to other by THM.
D. The moment is minimum at regular model type 1 as compare to other models.
E. Different location of shear wall effect on axial load on the column. In absence of shear wall axial load and moments are maximum on column.
F. In the column, the axial force is found to be minimum in regular model type 3 as compare to other models.
G. The shear force in the column is observed minimum in regular model type 3 compare to other models by THM.
0 50 100 150 200 250 300 350 400
FRAME TYPE
MR TYPE1
MR TYPE2
MR TYPE3
MIR TYPE4
MIR TYPE5
MIR TYPE6
M
OM
E
NT
(K
N
-m)
MAX.MOMENT IN COLUMN(KN-m)
MAX. MOMENT IN COLUMN(KN -m) RSM
Available Online at www.ijpret.com 109
H. By the effect of dynamic loading, the maximum bending moment in column is minimum in regular model type 3 as compare to other models.
I. In Time History method, the maximum base shear is in shear wall type 3 as compare to others.
J. Comparing the all models, the base shear is near about same by both the methods in x, y direction.
K. In case of regular building, based on positioning of shear wall, no torsional effect on regular building is observed. But in case of irregular building, based on irregularly positioning of shear wall and the result analysis, the lateral forces on the building will create torsion effect around centre of rigidity of the building due to that eccentricity.
Hence, it can be said that the MR TYPE 3 regular buildings gives a better result as compare to others building models. So this building is more stable by applying dynamic loading where the shear wall placed at the centre. And the reduction between Response Spectrum Method and Time History Method is 5 to 10% is observed.
REFERENCES
1. Agarwal. P., and Shrikhande. M., (2011), “Earthquake resistant design of structures,” PHI learning private limited, New Delhi.
2. Anshuman,S., and Bhunia,B.,(2011),“Solution of shear wall location in multistory building,” International journal of civil and structural engineering.
3. Bahador,B., and Firoozabad,B., (2012), “Comparative Study of the Static and Dynamic Analysis of Multi-Storey Irregular Building,” World Academy of Science, Engineering and Technology Vol:6 2012-11-27.
4. Chopra.A., (2014), “Dynamic of structure Theory and applications to earthquake engineering,” University of California at Berkeley.
5. Divyashree, M., Bhavyashree, B., and Siddappa,G., ( 2014), “Comparison of Bracings and Shear walls as Seismic Strengthening Methods to Buildings with plan irregularities,” International Journal of Research in Engineering and Technology.
Available Online at www.ijpret.com 110
7. IS 1893: 2002, “Criteria for Earthquake Resistant Design of Structures,” 5th revision, Bureau
of Indian Standard, New Delhi.
8. Kumbhare,P., and Saoji,A., (2012),“Effectiveness of reinforced concrete shear wall for multi-storyed building,” International Journal of Engineering Research & Technology, Vol. 1, Issue 4.
9. Landingin, J., and Rodrigues, H., (2013), “Comparative Analysis of RC Irregular Buildings Designed According to Different Seismic Design Codes,” The Open Construction and Building Technology Journal, pg 221-229.