R E S E A R C H
Open Access
The occurrence of potato common scab
correlates with the community composition
and function of the geocaulosphere soil
microbiome
Wencong Shi
1,2, Mingcong Li
1,2, Guangshan Wei
3,4, Renmao Tian
5, Cuiping Li
1,2, Bing Wang
2,6, Rongshan Lin
2,6,
Chunyu Shi
1,7, Xiuli Chi
8, Bo Zhou
2,6*and Zheng Gao
1,2,5*Abstract
Background:Soil microorganisms can mediate the occurrence of plant diseases. Potato common scab (CS) is a
refractory disease caused by pathogenicStreptomycesthat occurs worldwide, but little is known about the interactions between CS and the soil microbiome. In this study, four soil-root system compartments
(geocaulosphere soil (GS), rhizosphere soil (RS), root-zone soil (ZS), and furrow soil (FS)) were analyzed for potato plants with naturally high (H) and low (L) scab severity levels. We aimed to determine the composition and putative function of the soil microbiome associated with potato CS.
Results:The copy numbers of the scab phytotoxin biosynthetic genetxtABand the bacterial 16S rRNA gene as
well as the diversity and composition of each of the four soil-root system compartments were examined; GS was the only compartment that exhibited significant differences between the H and L groups. Compared to the H group, the L group exhibited a lowertxtABgene copy number, lower bacterial 16S copy number, higher diversity, higher co-occurrence network complexity, and higher community function similarity within the GS microbiome. The community composition and function of the GS samples were further revealed by shotgun metagenomic sequencing.Variovorax,Stenotrophomonas, andAgrobacteriumwere the most abundant genera that were significantly and positively correlated with the scab severity level, estimated absolute abundance (EAA) of pathogenicStreptomyces, andtxtABgene copy number. In contrast,Geobacillus,Curtobacterium, and unclassified
Geodermatophilaceaewere significantly negatively correlated with these three parameters. Compared to the
function profiles in the L group, several genes involved in“ABC transporters,”the“bacterial secretion system,”
“quorum sensing (QS),” “nitrogen metabolism,”and some metabolism by cytochrome P450 were enriched in the H group. In contrast, some antibiotic biosynthesis pathways were enriched in the L group. Based on the differences in community composition and function, a simple model was proposed to explain the putative relationships between the soil microbiome and CS occurrence.
(Continued on next page)
* Correspondence:[email protected];[email protected]
1
State Key Laboratory of Crop Biology, Shandong Agricultural University,
Tai’an 271018, China
2College of Life Sciences, Shandong Agricultural University, Tai’an 271018,
China
Full list of author information is available at the end of the article
(Continued from previous page)
Conclusions:The GS microbiome was closely associated with CS severity in the soil-root system, and the
occurrence of CS was accompanied by changes in community composition and function. The differential functions provide new clues to elucidate the mechanism underlying the interaction between CS occurrence and the soil microbiome, and varying community compositions provide novel insights into CS occurrence.
Keywords:Soil microbiome, Common scab, Geocaulosphere soil, Metagenome, Microbial community composition
and function
Background
Soil microorganisms, which closely interact with plants, are an important factor affecting plant health [1–3]. The emergence and propagation of plant pathogens cause plant diseases, and in turn, soil microorganisms can pre-vent plant diseases and inhibit pathogens to maintain plant health [4,5]. Using microorganisms to control plant diseases has been successful in many ways, and biocontrol is considered a desirable approach for controlling soil-borne diseases [6–9]. Many biocontrol agents for plant pathogens have been developed and applied, but due to the complexity of the soil environment and of soil mi-crobial interactions, the effectiveness of biocontrol agents often differs under laboratory and natural environment conditions. To ensure that the biocontrol of plant disease is more stable and more effective in the natural environ-ment, a clear understanding of how pathogens, biocontrol strains, and soil microorganisms interact is necessary. Therefore, it is of great significance to study the soil mi-crobial community to control plant diseases.
In the last decade, an increasing number of studies have focused on the role of the soil microbial commu-nity in the field of plant disease prevention and treat-ment [3, 10–12]. Disease occurrence is often accompanied by changes in the microbial community, such as altered microbial abundance, composition, and function [13,14], so additional efforts to rehabilitate the microbial community may be more effective at curing plant diseases than simply controlling pathogen popula-tions. Research indicates that the diversity of soil micro-bial communities is closely related to plant disease resistance, and high microbial diversity provides plants with greater protection from invasion by pathogens [15– 17]. The increased pathogen invasion resistance of soil with high microbial diversity is likely related to the com-plexity of the microbial interaction network in the soil [18–20]. Complex microbial community interactions can regulate community stability [20–22], thereby control-ling pathogen propagation. Therefore, studying the inter-action between plant pathogens and the soil microbiome is necessary for more effective disease prevention.
Potato common scab (CS) is an economically import-ant disease that occurs worldwide and alone was
estimated to have caused approximately 15.3–17.3 mil-lion Canadian dollars in economic losses in Canada in 2002 [23]. Previous studies have suggested that CS is in-dependently caused by several different Streptomyces
species, includingS. scabies [24], S. acidiscabies [25],S.
turgidiscabies[26],S.europaeiscabiei[27],S.stelliscabiei
[27], and S. bottropensis [28]. Pathogenic Streptomyces
spp. live not only on the skin of potato tubers as a para-site but also in the soil as a saprophyte. This pathogen produces a family of phytotoxins called thaxtomins that are cyclic dipeptides (2,5-diketopiperazines) containing 4-nitrotryptophan and phenylalanine residues [29, 30], and thaxtomin A (ThxA), the most prominent member of the family, has been confirmed to be associated with
Streptomyces pathogenicity [31–33]. ThxA biosynthetic genes reside on a mobile pathogenicity island (PAI) in pathogenic Streptomyces genomes [34–36]. The biosyn-thetic pathway of ThxA involves two nonribosomal pep-tide synthetases (NRPS) encoded by txtA and txtB
genes, a P450 monooxygenase (TxtC), a nitric oxide synthase (TxtD), and a novel cytochrome P450 (TxtE) [30,37–40]. ThxA on plant cells has been shown to in-hibit cellulose biosynthesis, promote plant cell hyper-trophy, and cause programmed cell death [41–43].
How to control CS has long been a thorny problem and has attracted global attention. To date, many practices have been used to control CS that are often not effective [44–46]. Many studies have focused on the treatment of CS through biocontrol agents, and some microorganisms, such as some strains ofBacillus[47,48] andPseudomonas
sequencing, were implemented to explore the micro-biomes of all soil samples, and additional shotgun metage-nomic sequencing was applied to GS to explore microbial function. We specifically sought to (i) determine the range of the soil that its microbial community characteristics are closely associated with CS, (ii) clarify the composition and functional profiles of the soil microbiome in L plants, and (iii) explain the interactions between the soil microbial community and CS occurrence.
Materials and methods
Field experiment
The field experiment was conducted in 2015. All potatoes were planted in Anjiatun Village (34.248727° N, 119.816724° E, 22.9 m a.s.l.) of Jiaozhou City in Shandong Province, China on August 15th. The field was approxi-mately 50-m long and 7-m wide and had nine ridges par-allel to the long side (Additional file 1: Figure S1) that were 20–30 cm high, and two adjacent ridges were spaced 70–80 cm apart. The potatoes were planted on the ridges in a single row with a spacing of approximately 20–25 cm between plants. Favorita 15, the potato cultivar studied here, is susceptible to CS. The sampled field had a potato planting history of many years, and CS had occurred dur-ing the last plantdur-ing.
Sampling
Samples were collected on November 3, 2015 (80 days after planting), and the four soil-root system compart-ments of each plant including GS, RS, ZS, and FS were selected to fully explore the relationship between the soil microbiome and CS severity in the soil-root system. Plant population density, appearance, growth rate, and growth period were considered in our analysis; plants with an unusual size, pests, or mechanical damage as well as those impacted by marginal effects were ex-cluded. The tubers and roots were carefully collected with an aseptic stainless-steel shovel, and the soil that was loosely attached to the tubers and roots was gently removed. CS severity was evaluated using a scale of 1 to 9 based on the percentage of the surface covered by le-sions: 1: no scab; 2: 0.1–0.8%; 3: 0.9–2.8%; 4: 2.9–7.9%; 5: 8.0–18.0%; 6: 18.1–34.0%; 7: 34.1–55.0%; 8: 55.1– 77.0%; and 9: 77.1–100% [54]; the coverage range was evaluated based on simple measurements with a grid ruler. A total of ten plants were selected according to scab severity. Plants No. 1 to 5 were grouped and identi-fied as H (scab severity rank≥4 for each tuber), and No. 6 to 10 were grouped and identified as L (scab severity rank 1–2 for each tuber). To accurately measure the re-lationship between the soil microbiome and scab sever-ity, one tuber per plant was chosen, and GS and RS were collected as the soil tightly attached to the tuber and root surfaces, respectively, as follows [55]. Briefly, the
tuber or root was stirred vigorously in a sterile phosphate-buffered saline (PBS) solution to wash all the soil from the surface, and the soil was then collected by high-speed centrifugation. ZS was collected from the re-gion of root growth under the plant, and FS was col-lected at a depth of 5–10 cm from the furrow next to the plant (FS1 was missing). All samples were stored at low temperature in ice bags (~ 4 °C) and transported to the laboratory within 12 h. After homogenization, a por-tion of each sample was stored at−80 °C until DNA ex-traction, and the remainder of the sample was immediately processed for physicochemical analysis.
Isolation and identification ofStreptomycesstrains
A pure culture experiment was performed to isolate
Streptomyces strains from potato lesions using the en-richment culture law and dilution on agar-medium plates. The lesions were homogenized, combined with 9 mL sterile water, incubated at room temperature for 30 min, diluted 10 times and 100 times with sterile water, and then coated on oatmeal agar plates (OMA; 10 g oatmeal, 18 g Bacto agar, and nutrients: 1 g MgSO4·7H2O, 1.5 g KH2PO4, and 1 g NaNO3per liter)
for culture at 28 °C for 3–7 days. Single colony-forming units were selected and sub-cultured three times on OMA plates, and the 16S rRNA genes of the isolated strains were amplified with the bacterial universal primers 27F (5′-GAGAGTTTGATCCTGGCTCAG-3′) and 1492R (5′-ACGGATACCTTGTTACGACT-3′). PCR amplicons were verified on a 1% agarose gel, and the reaction products were purified and sequenced on an ABI 3730XL DNA Analyzer (Applied Biosystems, USA). The 16S sequences were aligned with an NCBI 16S ribosomal RNA sequences (Bacteria and Archaea) database by Nucleotide BLAST (https://blast.ncbi.nlm. nih.gov/Blast.cgi) to determine the approximate phylo-genetic affiliation of the strains. Taxonomy was con-firmed if the maximum identity of the sequence reported by NCBI BLAST was > 97% and was the great-est of all listed matches. A phylogenetic tree was con-structed to visualize the phylogenetic relationships using the neighbor-joining method by MEGA7 software.
Physicochemical analysis
The physicochemical characteristics of ZS and FS were assayed in three technical replicates to evaluate the soil conditions in the study field. Soil pH was measured using a mixture of soil and deionized water free of CO2at a ratio
of 1:2.5 (w/v). Soil total carbon (TC), organic matter (OM), total nitrogen (TN), ammonium (NH4+-N), nitrate
(NO3−-N), available phosphorus (AP), available potassium
DNA extraction
GS, RS, ZS, and FS DNA were extracted using the E.N.Z.A.™Soil DNA Kit (Omega, USA) according to the manufacturer’s instructions, and DNA quantity and quality were determined using a NanoDrop 2000 spec-trophotometer (Thermo Scientific, USA). DNA was stored at−80 °C until further analysis.
Quantitative PCR
The bacterial 16S rRNA gene and thaxtomin biosyn-thetic genetxtABcopy numbers were detected by qPCR in thre technical replicates. The primers 515F (5′-GGAC TACVSGGGTATCTAAT-3′) and 806R (5′-GTGC CAGCMGCCGCGGTAA-3′) were used to amplify a 292-bp fragment of the 16S rRNA gene from bacteria [58], and the primers StrepF (5′-GCAGGACGCTCACC AGGTAGT-3′) and StrepR (5′-ACTTCGACACCGTT GTCCTCAA-3′) were used to amplify a 72-bp fragment of the thaxtomin biosynthetic gene txtAB from scab-pathogenic Streptomyces [59]. The analyses were performed on a CFX96™ real-time system (Bio-Rad, USA) using 96-well plates. Amplifications were per-formed in a final volume of 20 μL containing 10 μL of SYBR® Premix Ex Taq™ (Tli RNaseH Plus; Takara, China), 5μL of DNA, 0.2μL of each 10-μM primer, and 4.6 μL of ultra-pure water. Plasmids containing either the 16S rRNA gene fragment or txtAB gene fragment were constructed to prepare the respective standard curves, and the plasmid copy numbers were automatic-ally calculated using an online calculator (cels.uri.edu/ gsc/cndna.html) based on the concentration, size, and average weight of a base pair. Standard curve equations that showed the relationship between gene copy num-bers and Ct values were generated with serial dilutions of the above plasmids with known copy numbers after real-time fluorescence qPCR. After the same PCR runs, the copy numbers of samples were calculated based on the standard curve equations and their own Ct values. No-template controls as well as positive controls with known Ct values were included in every PCR. The ther-mocycling conditions for amplification of both the bac-terial 16S and txtAB genes were 95 °C for 5 min; 40 cycles of 95 °C for 10 s, 55 °C for 10 s, and 72 °C for 20 s; and a final melting cycle to produce a melting curve for quality control. All runs had standard effi-ciency curves ofr2> 0.99 and efficiencies of 90–110%.
Illumina MiSeq sequencing and analysis
The primers 341F (5′-CCTACGGGNGGCWGCAG-3′) and 805R (5′-GACTACHVGGGTATCTAATCC-3′) were used to amplify the V3-V4 hypervariable region of the 16S rRNA gene. Amplicon libraries were constructed using the NEB Next® Ultra™ DNA Library Prep Kit for Illumina (NEB, USA) following the manufacturer’s
recommendations, and index codes were added. The amplicon libraries were sequenced on a MiSeq PE250 sequencer (Illumina, USA), and 250-bp paired-end reads were generated. Approximately, 2.2 GB raw reads were generated after Illumina sequencing, and the resulting paired sequence reads were then merged, trimmed, fil-tered, aligned, and clustered by operational taxonomic unit (OTU) using USEARCH v. 9.2 software [60]. Once the paired sequence reads were merged, a total of 1,878,784 merged sequences were generated, with an average of 48,174 sequences for each soil sample (minimum = 43,903; maximum = 51,875). Sequences with≥97% similarity were assigned to the same OTU by the UPARSE-OTU algorithm in USEARCH, and chi-meras were filtered during OTU clustering using the cluster_otus command. Sequences of plastids and mito-chondria and those not classified in the domain Bacteria were discarded as were OTUs with a sequence number of 1 in all samples. Taxonomy assignment was performed using the USEARCH-recommended database: the RDP training set for 16S. Alpha- and beta-diversity indices were calculated based on the rarefied OTU table at a depth of 29,718 sequences per sample. Alpha-diversity indices, in-cluding the ACE, Chao1, coverage, Shannon, and Simpson indices, were calculated with Mothur v. 1.34.4 [61]. Com-mand lines for the above data processing are available in Additional file2.
Shotgun metagenomic sequencing and analysis
Based on the results of the above 16S amplicon sequen-cing, GS DNA was selected for shotgun metagenomic se-quencing to evaluate the microbial community composition and function with higher resolution. Metage-nomic libraries were constructed using a TruSeq™ DNA PCR-free Sample Prep Kit (Illumina, USA) according to the manufacturer’s instructions. The metagenomic librar-ies were sequenced on a HiSeq 2500 sequencer (Illumina, USA), and 150-bp paired-end reads were generated. Approximately 244.4 GB raw reads were generated after Illumina sequencing, with a total of 727,482,738 resulting paired sequence reads for all 10 GS samples.
open reading frames (ORFs) using MetaGene (http:// metagene.cb.k.u-tokyo.ac.jp/), and 1,731,093 ORFs were obtained. All predicted genes were aligned pairwise using CD-HIT (http://www.bioinformatics.org/cd-hit/), and those for which more than 90% of their length could be aligned to another gene with more than 95% identity (no gaps allowed) were removed as redundancies excepted for the longest gene, resulting in a non-redundant gene catalog comprised of 1,205,798 genes with an average length of 579.02 bp.
Computation of gene relative abundance
The high-quality reads from each sample were aligned against the gene catalog by SOAPaligner (http://soap. genomics.org.cn/) using the criterion“identity > 95%.”In each sample, the mapped reads of each gene were counted as the number of gene-mapped reads, and the gene relative abundance was calculated following a pre-vious study [62].
ai¼ bi
P
jbj¼ xi Li
P
j xj Lj
ai: The relative abundance of geneiin sampleS.
Li: The length of genei.
xi: The times at which gene i could be detected in sampleS(the number of mapped reads).
bi: The copy number of genei in the sequenced data from sampleS.
Functional annotation
We aligned putative amino acid sequences, which were translated from the gene catalog, against the proteins/ domains in KEGG databases (Release 79.0) using BLASTP (BLAST v. 2.2.28+, http://blast.ncbi.nlm.nih. gov/Blast.cgi) (e value ≤1e-5). A total of 776,122 genes were hit in the KEGG databases and were assigned to 3328 KEGG orthology (KO) functional categories and 365 KEGG pathways.
Taxonomic assignment of genes
We aligned putative amino acid sequences translated from the gene catalog against the proteins/domains in the NCBI-NR database (downloaded 01/2017) using BLASTP (BLAST v. 2.2.28+, http://blast.ncbi.nlm.nih. gov/Blast.cgi) (evalue≤1e-5). Genes were taxonomically annotated using corresponding taxonomic information from the NR database. In each sample, the mapped reads of each taxon were counted as the number of taxon-mapped reads.
Taxonomic profiling and abundance statistics
We profiled the composition of microbial communities (Bacteria, Archaea, Eukaryotes and Viruses) from raw shotgun metagenomic sequencing reads using MetaPhlAn v. 2.0 [63], and the bacterial taxonomic profiling was sub-sequently separated from the microbial taxonomic profil-ing. The relative abundances of microbial taxonomic profiling were quantified by unique clade-specific marker genes of the MetaPhlAn v. 2.0 reference database and then normalized to values in proportion. The estimated abso-lute abundance (EAA) of bacterial taxa was calculated using the method described by Zhang [64].
EAAi=ai×qs.
EAAi: The estimated absolute abundance of bacterial taxoniin sampleS.
ai: The relative abundance of bacterial taxon i in sampleS.
qs: The copy number of bacteria from sample S
detected by qPCR.
Statistical analysis
The two-tailed Wilcoxon rank-sum test was performed using the base R package “stats” (v. 3.4.1) wilcox.test function. Spearman’s correlation coefficient and signifi-cance were calculated using the rcorr function in the R package “Hmisc” (v. 4.0-3). The Bray-Curtis metric was calculated using the vegdist function from the R package “vegan” (v. 2.4-4). Principal coordinates analysis (PCoA) was performed using the prcomp function from the R package “stats” with the Bray-Curtis metric. Analysis of similarities (ANOSIM) was performed with the anosim function from the R package “vegan” with the Bray-Curtis metric. KEGG pathway enrichment analysis was performed using the function phyper from the R package “stats”. The linear discriminant analysis (LDA) effect size (LEfSe) statistical analysis was performed on the online interface Galaxy (http://huttenhower.sph.har vard.edu/lefse/) with an alpha value < 0.05 and an LDA score > 2. The correlation network was visualized using Cytoscape v. 3.6.0.
Results
The low scab severity group was characterized by a GS
microbiome with lowtxtABgene abundance, low
bacterial abundance, and high diversity
concentration of ammonium (NH4+-N) in ZS was
sig-nificantly different (two-tailed Wilcoxon test, P= 0.03) between the H and L groups, but there was no signifi-cant difference in all observed physicochemical charac-teristics in FS. In addition to ammonium (two-tailed Wilcoxon test, P= 0.01), the concentrations of soil TC (two-tailed Wilcoxon test, P= 0.02) and OM (two-tailed Wilcoxon test, P= 0.01) were also significantly different between the H and L groups when combining ZS and FS.
TxtAB is the key gene for the biosynthesis of scab phytotoxin ThxA and enables the accurate quantification of pathogenic Streptomyces strains [65]. To determine scab pathogen abundance, all soil samples were used to detect the copy numbers of the thaxtomin biosynthetic gene txtAB, but only GS produced clear fluorescent sig-nals in the real-time PCR system (Fig. 1a), indicating that GS contained a high abundance of the scab patho-gen while the other samples contained little or no scab pathogen. Furthermore, the genetxtABcopy numbers of the scab pathogen were significantly (two-tailed Wil-coxon rank-sum test, P= 0.008) different between GSH and GSL and were significantly positively correlated with scab severity level (Spearman,ρ= 0.97,P= 5.55 × 10⁻⁶).
The bacterial 16S rRNA gene copy numbers were de-tected by qPCR to reveal the distribution of bacterial
abundance in all soil samples. The highest bacterial copy numbers were detected in RS (compared to GS; two-tailed Wilcoxon test, P= 0.004), ranging from 1.55 × 10¹⁰± 8.06 × 10⁸ to 6.82 × 10¹¹± 3.10 × 10¹⁰ cop-ies/g soil, followed by GS, ranging from 1.29 × 10⁹± 9.62 × 10⁷ to 1.08 × 10¹¹± 5.17 × 10⁹; interestingly, only GS had significantly (two-tailed Wilcoxon test, P= 0.02) different bacterial copy numbers between GSH and GSL (Fig. 1b). The mean bacterial copy number in GSH was 4.33 × 10¹⁰, and the mean in GSL was 7.84 × 10⁹. The copy numbers for GS were significantly positively correlated with scab severity level (Spearman,ρ= 0.80,P= 0.005), in-dicating that increased bacterial abundance in GS may sig-nal the occurrence of CS.
The 16S rRNA genes of all soil samples were sequenced on a MiSeq PE250 sequencer, and all statistical calcula-tions were performed based on rarefied OTU profiling at a depth of 29,718 sequences per sample (Additional file3). A total of 2700 OTUs were yielded from the bacterial community. The number of OTUs in each soil com-partment is shown in Fig. 1c for comparison be-tween the H and L groups, but the statistical significance (P value < 0.05) was not evaluated in any soil compartment by two-tailed Wilcoxon test (GS: P= 0.06; RS: P= 0.69; ZS: P= 0.75; FS: P= 0.41).
A
D
B
E
F
G
H
C
Fig. 1CS separated the bacterial community of GS but not that of RS, ZS, or FS.aThe copy number of the thaxtomin biosynthetic gene,txtAB,
was significantly higher for GS in the H group than in the L group. Differences between high and low scab severity levels were observed in
Compared with the other compartments, the differ-ence in GS was nearly statistically significant, with a
P value = 0.06, and showed a slightly lower OTU number in GSH than in GSL (Fig. 1c). Notably, a left-tailed Wilcoxon test showed a significant differ-ence (P= 0.03) between GSH and GSL. Significant differences were also evaluated by t test (two-tailed t
test, P= 0.03; left-tailed ttest,P= 0.02), but none of the other soil compartments were tested for significant differ-ences using the same methods (two-tailedttest, left-tailed Wilcoxon test, left-tailed t test, P> 0.05). The bacterial OTU numbers of GS were significantly negatively correlated with scab severity level (Spearman, ρ=−0.83,
P= 0.003). Furthermore, alpha-diversity indices (Additional file1: Table S2) were calculated with Mothur v. 1.34.4 [61], and the results showed that the Chao1 index (two-tailed Wilcoxon test, P= 0.03; left-tailed Wilcoxon test, P= 0.02; left-tailed t test, P= 0.01) and Shannon index (two-tailed Wilcoxon test, P= 0.15; left-tailed Wil-coxon test,P= 0.08; left-tailedttest,P= 0.03) approached marginally significant differences between GSH and GSL.
Significant differences in bacterial community
composition were observed in GS between high and low scab severity levels
To visualize the similarity and dissimilarity in bacterial communities among soil samples, PCoA was performed based on bacterial OTUs of 16S rRNA gene amplicon sequencing using the Bray-Curtis metric. All samples were primarily clustered by soil compartment type (ANOSIM, r= 0.5461,P= 0.001) rather than by scab se-verity (ANOSIM, r= 0.009, P= 0.26) (Fig. 1d). Within the same soil-root system compartment, bacterial com-munities in GS could be distinguished based on CS (Fig. 1e; ANOSIM, r= 0.60, P= 0.02), but this was not the case for RS (Fig. 1f; ANOSIM, r=−0.02, P= 0.47), ZS (Fig.1g; ANOSIM,r=−0.03,P= 0.66), or FS (Fig.1h; ANOSIM, r=−0.13, P= 0.75). This finding indicates that there were significant differences in the GSH and GSL bacterial community compositions. ZS and FS highly overlapped, indicating that the bacterial commu-nities of these two soil compartments were generally similar, but they still had a few different characteristics (ZS vs. FS; ANOSIM,r= 0.24,P= 0.003).
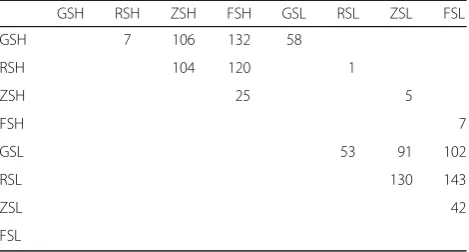
The two-tailed Wilcoxon rank-sum test was used to evaluate differences in bacterial relative abundance at the genus level among groups (Table1). Consistent with the PCoA results, the largest number of differentiated (P< 0.05) genera existed between different soil compart-ments. A total of 143 differentiated bacterial genera were found between RSL and FSL, and 132 were found be-tween GSH and FSH. Notably, 53 differentiated bacterial genera were found between GSL and RSL, while only 7 differentiated bacterial genera were found between GSH
and RSH, indicating that H might reduce the community differences between GS and RS. Of the four soil-root system compartments, GS contained 58 differentiated (P< 0.05) bacterial genera between H and L, which was far greater than the 1, 5, and 7 identified in RS, ZS, and FS, respectively. This finding further demonstrates that the bacterial community composition of GS was related to CS severity.
The LEfSe method was applied to identify differences in taxonomic abundance between GSH and GSL (Additional file1: Figure S2 and S3). The taxa enriched in GSH were mainly found inProteobacteriaandBacteroidetes, and the taxa enriched in GSL mainly belonged to Acidobacteria,
Actinobacteria, andFirmicutes. At the genus level, 67 gen-era were found to be significantly (P< 0.05) different be-tween GSH and GSL, of which 12 genera were enriched in GSH and 55 were enriched in GSL. All differentiated gen-era identified by the Wilcoxon test and LEfSe analysis are depicted in Additional file 1: Figure S3. Among them,
Sphingomonas (significantly enriched in GSL; Wilcoxon and LEfSe; P< 0.05), Stenotrophomonas (significantly enriched in GSH; LEfSe; P< 0.05), Variovorax (signifi-cantly enriched in GSH; Wilcoxon and LEfSe; P< 0.05),
Arthrobacter(significantly enriched in GSL; Wilcoxon and LEfSe; P< 0.05), andSphingobium (significantly enriched in GSH; Wilcoxon and LEfSe; P< 0.05) were abundant genera. Unexpectedly, the genus Streptomyces did not show a significant difference between GSH and GSL (two-tailed Wilcoxon test,P= 0.83).
The low scab severity group was characterized by the GS
microbiome with low pathogenicStreptomycesabundance
To obtain more information about the pathogens and microbial community function, GS DNA was selected for shotgun metagenomic sequencing via a HiSeq 2500 sequencer, after which a total of 657,254,147 high-quality sequence reads were obtained with approxi-mately 52.4–80.5 million clean reads per sample. From those sequencing reads, a non-redundant gene catalog
Table 1Numbers of significantly (P< 0.05) differentiated bacterial genera between groups evaluated by two-tailed Wilcoxon test
GSH RSH ZSH FSH GSL RSL ZSL FSL
GSH 7 106 132 58
RSH 104 120 1
ZSH 25 5
FSH 7
GSL 53 91 102
RSL 130 143
ZSL 42
was obtained comprising 1,205,798 genes, of which 223,997 (45,621,568 clean reads) were taxonomically an-notated by aligning them against the NR database (downloaded 01/2017). The sequence reads assigned to Bacteria (ca. 98.03%) occupied the dominant position, and a small proportion of sequence reads were assigned to Archaea (ca. 0.07%), Eukaryotes (ca. 1.44%), and Vi-ruses (ca. 0.41%). According to the NR alignment results, 614,988 sequence reads belonged to the genus Strepto-myces, and of these reads, 18Streptomycesspecies repre-sented by 243,560 sequence reads (0.53% of all reads, 39.60% ofStreptomycesreads) were possible scab patho-gens (Additional file1: Table S4). Among these species,
S. acidiscabieswas dominant followed byS. niveiscabiei,
S.turgidiscabies, andS.scabiei.
Relative abundances within the microbial community were quantified by MetaPhlAn v. 2.0 software (Additional file4). Similar to the NR alignment results, the microbial community was composed of Bacteria (ca. 99.10%), Eukary-otes (ca. 0.02%), and Viruses (ca. 0.88%). As the main com-ponent of the microbial community, the bacteria were separated (Additional file5), and twoStreptomycesspecies in the metagenomic bacterial community, S. acidiscabies
and S. turgidiscabies, were possible scab pathogens (Table2). Similar to the NR alignment results,S. acidisca-bieswas the dominant scab pathogen analyzed by MetaPh-lAn2 in our samples. In our culture experiment, 11 isolated strains had the highest phylogenetic similarity with the S.
acidiscabiesstrain, and 1 had the highest similarity with the
S. turgidiscabiesstrain (Additional file1: Table S5; the se-quences are in Additional file 6) according to the NCBI BLAST results; a phylogenetic tree constructed by MEGA7 software was used to visualize the phylogenetic
relationships (Additional file1: Figure S4). The culture ex-periment further confirmed the existence of S.
acidis-cabies and S. turgidiscabies and identified S.
acidiscabies as the dominant pathogenic Streptomyces
species in this study.
The sum of the relative abundances ofS. acidiscabies
and S. turgidiscabies was defined as the relative abun-dance of pathogenic Streptomyces; other Streptomyces
species were non-pathogenic (Table 2). Consistent with the amplicon sequencing results (Additional file 1: Figure S3), the relative abundance of the entire Strepto-myces genus was not significantly (two-tailed Wilcoxon test, P= 0.056) different between GSH and GSL, but interestingly, the relative abundance of pathogenic
Streptomyceswas significantly (two-tailed Wilcoxon test,
P= 0.016) different. This result can be explained by the relative abundance of non-pathogenic Streptomyces be-ing significantly (two-tailed Wilcoxon test, P= 0.021) enriched in GSL, suggesting that the relative abundance of the entire Streptomyces might not accurately reflect the distribution of the pathogenic taxa. The EAA of bac-teria was calculated using the method described by Zhang [64], and that of pathogenicStreptomyceswas revealed to be significantly (two-tailed Wilcoxon test, P= 0.008) enriched in GSH compared with GSL. The EAA of patho-genic Streptomyces exhibited extremely significant and positive correlations with the txtAB gene copy number (Spearman, ρ= 0.88, P= 0.0008) and scab severity level (Spearman, ρ= 0.89, P= 0.0005), but there were only moderately significant positive relationships between the relative abundance of pathogenicStreptomyces andtxtAB
gene copy number (Spearman, ρ= 0.68, P= 0.029) and scab severity level (Spearman,ρ= 0.66,P= 0.036). Overall,
Table 2Relative abundance ofStreptomycesspecies in metagenomic bacterial taxonomic profiling (MetaPhlAn2)
Species GS1 GS2 GS3 GS4 GS5 GS6 GS7 GS8 GS9 GS10 Pct in Bac Pct in Strep
Streptomyces acidiscabies
4.82E-03 4.67E-03 2.32E-03 6.22E-03 1.44E-03 0.00E+ 00 4.09E-04 4.64E-04 1.71E-03 0.00E+00 0.2205% 69.18%
Streptomyces turgidiscabies
1.07E-03 1.01E-03 5.52E-04 1.32E-03 1.92E-04 4.80E-04 3.99E-04 0.00E+00 0.00E+00 0.00E+00 0.0502% 15.76%
Streptomyces chartreusis
0.00E+00 2.69E-04 5.85E-05 1.15E-04 0.00E+00 6.82E-04 1.03E-03 6.46E-04 5.52E-04 8.89E-05 0.0344% 10.81%
Streptomyces flavogriseus
0.00E+00 0.00E+00 4.65E-05 0.00E+00 0.00E+00 0.00E+00 9.57E-05 0.00E+00 7.24E-04 0.00E+00 0.0087% 2.72%
Streptomyces lividans
0.00E+00 0.00E+00 0.00E+00 0.00E+00 0.00E+00 0.00E+00 3.75E-04 0.00E+00 0.00E+00 7.23E-05 0.0045% 1.40%
Streptomyces coelicolor
0.00E+00 0.00E+00 0.00E+00 0.00E+00 0.00E+00 0.00E+00 4.30E-05 0.00E+00 0.00E+00 0.00E+00 0.0004% 0.14%
Sum 5.88E-03 5.95E-03 2.97E-03 7.65E-03 1.63E-03 1.16E-03 2.35E-03 1.11E-03 2.99E-03 1.61E-04 0.3187%
Pathogenic Streptomyces
5.88E-03 5.69E-03 2.87E-03 7.54E-03 1.63E-03 4.80E-04 8.08E-04 4.64E-04 1.71E-03 0.00E+00 0.2707% 84.94%
Non-pathogenic Streptomyces
0.00E+00 2.69E-04 1.05E-04 1.15E-04 0.00E+00 6.82E-04 1.55E-03 6.46E-04 1.28E-03 1.61E-04 0.0480% 15.06%
the abundance of pathogenicStreptomycescan reflect the scab severity level, and the EAA of pathogenic Streptomy-ces appears to be more suitable than relative abundance for reflecting txtABgene copy number and scab severity level patterns (Additional file1: Figure S5).
The community composition and function of the GS microbiome were correlated with CS
According to the metagenomic data, the bacterial commu-nity was composed of 116 genera (Additional files 5 and
7). To clarify CS-sensitive genera in GS, three parameters, including the scab severity level, EAA of pathogenic Strep-tomyces, andtxtABgene copy number, were selected and analyzed using Spearman’s correlation analysis with the EAA of bacterial genera (Fig. 2). These three parameters were demonstrated to be significantly positively correlated with each other. Twenty-eight genera were significantly correlated (Spearman, |ρ| > 0.6,P< 0.05) with scab sever-ity level, of which 17 were positive and 11 were negative. Sixteen genera were significantly correlated (Spearman, |ρ| > 0.6,P< 0.05) with the EAA of pathogenic Streptomy-ces, of which 13 were positive and 3 were negative. Twenty-seven genera were significantly correlated
(Spearman, |ρ| > 0.6,P< 0.05) withtxtABgene copy num-ber, of which 16 were positive and 11 were negative. Mi-croorganisms associated with multiple parameters were considered to be of the utmost concern, and a total of 13 genera were significantly positively correlated (Spearman, |ρ| > 0.6, P< 0.05) with all 3 parameters. Notably, Vario-vorax exhibited the highest EAA of all associated genera; four genera (Stenotrophomonas, Agrobacterium, Sphingo-bium, and Streptomyces) exhibited a strong correlation (Spearman,ρ> 0.8,P< 0.05) with these three parameters. The significant correlation and high EAA ratios (GSH vs. GSL) raised the possibility that these genera were associated with CS. In addition, three genera ( Geoba-cillus, Curtobacterium, and unclassified Geodermato-philaceae) were significantly negatively correlated (Spearman, −1≤ρ<−0.6, P< 0.05) with all three pa-rameters, and seven genera were significantly negatively correlated (Spearman, −1≤ρ<−0.6, P< 0.05) with the scab severity level and the txtAB gene copy number but not with the EAA of pathogenicStreptomyces.
The co-occurrence network (Additional file 1: Figure S6) of the metagenomic bacterial community was used to compare the co-occurrence relationship and
Fig. 2Interaction networks between the EAA of metagenomic bacteria (genus level) and scab severity level, the EAA of pathogenicStreptomyces,
community complexity between GSH and GSL. Both the average number of neighbors and network density were higher in GSL, revealing a more complex co-occurrence relationship among these bacteria in GSL than in GSH. The network centralization values were 0.084 and 0.122 in GSH and GSL, respectively, and these low values indi-cated that the power of each microorganism was decen-tralized so that it was difficult for one or a few microorganisms to dominate and control the entire community. The occurrence of a higher network centralization value in GSL may be due to the existence of several large clusters with a higher degree of nodes, resulting in greater network centralization than that in GSH. A greater percentage of negative correlations were observed in GSH (27.91%) than in GSL (5.46%), imply-ing that there may be greater antagonism among bac-teria in GSH. Taken together, these results reveal a more complex co-occurrence community relationship in GSL, which might cause the GSL communities to be more re-sistant to pathogen invasion [18,19].
The dissimilarity metrics based on Bray-Curtis ordin-ation were calculated to quantify the compositional dis-similarity of both metagenomic bacterial community composition and KO functional category (Fig. 3). Our metagenomic functional profiling yielded a total of 3328 KO functional categories (Additional file 8), and in both microbial community composition and function, the dis-similarity between GSH and GSL was greater than that within groups (Within vs. Between; two-tailed Wilcoxon test; community composition, P= 6.3 × 10⁻¹³; commu-nity function, P= 0.0005), indicating that both commu-nity composition and function differed between GSH
and GSL. The dissimilarity coefficient values for com-munity function were lower than those for comcom-munity composition (two-tailed Wilcoxon test, P< 2.2 × 10⁻¹⁶), demonstrating that the microbial function of GS was more similar than its community composition. In par-ticular, the community function of GSL exhibited a sig-nificantly (two-tailed Wilcoxon test, P= 0.003) lower dissimilarity than that of GSH, whereas the bacterial community composition of GSL showed a slightly higher (two-tailed Wilcoxon test, P= 0.53) dissimilarity. In other words, the microbial functional profiling of GSL was more similar than that of GSH, although the dis-similarity of its community composition was slightly higher. Overall, scab severity was more closely related to microbial function than to community composition within GS, and the functional similarity was higher in samples with L than in those with H.
We quantified and visualized the functional differences between GSH and GSL using a two-tailed Wilcoxon test, and a total of 240 and 561 significantly (two-tailed Wilcoxon test,P< 0.05) enriched KO functional categor-ies were discovered in GSH and GSL, respectively (Fig.4a). To clarify which KO functional categories were the most dominant among these differences, the differ-ential KO functional categories with a relative abun-dance greater than 0.03% are described in Fig. 4b. Through this filter, 98 differential KO functional categor-ies were retained, 16 of which were significantly enriched in GSH and 82 of which were significantly enriched in GSL. Notably, the relative abundance of K02035 (mean 00.19%) was the highest among all the differential KO functional categories, and K00799 was
A
B
Fig. 3The dissimilarity metrics ofathe EAA of metagenomic bacterial community composition (genus level) andbthe relative abundance of KO
the second highest; they were both enriched in GSH. K02035, a peptide/nickel transport system substrate-binding protein, is a member of the “QS” pathway, and K00799 (gst, glutathione S-transferase; mean 0.14%) is supposed to participate in the “glutathione metabolism”
and “xenobiotics biodegradation and metabolism” path-ways. In the differential KO functional categories enriched in GSL, K03046 (rpoC, DNA-directed RNA polymerase subunit beta; mean 0.11%) was the most abundant KO functional category followed by K03043
0.2% 0.1% 0.05% 0.025%
Relative Abundance
Genetic Information Processing
Environmental Information Processing
Cellular Processes Metabolism K02035 K00799 K00029 K02015 K02016 K02013 K03781 K02012 K03585 K00121 K09808K00981 K01126K15125 K10111 K00641 K03046 3 4 0 3 0 K K05349 K01915 K00382 K01681 K01895 K01955 K02274 K02337 K02335 K03657 K00164 K01870 K01869 K01256 K04043 K00384 K02111 K01338 K01187 K03695 K00239 K04077 K00036 K02067 K01872 K02275 K00962 K02066 K14266 K00134 K01868 K01937 K03587 K00764 K02314 K02313 K01972K00937 K01885 K01903K03217 K01953K02342 K01007K03628 K01190K01874 K03076K01939 K03526K12308 K01358K10119 K00928K01206K03703K01881
K03074 K02115K05515 K00845 K00252 01
7
1
0
K K03106 K02438 K01000 K01209 K01491 K07646K03040
K01875K02038K00133K00616 K00335K01866
K01867K03980
K10118
K03644
Translation
Metabolism of terpenoids and polyketides
Metabolism of cofactors and vitamins Metabolism of other amino acids Amino acid metabolism
Xenobiotics biodeg
radation and metabolism Biosynthesis of other seconda
ry metabolites Glycan biosynthesis and metabolism Lipid metabolism Energy metabolism Carboh ydrate metabolism Transcr iption
Replication and repair Folding, sor
ting and degr adation
Signal tr ansduction
Membrane tr ansport
Transport and catabolism Cellular comm
ryotes
Cell growth and death Nucleotide metabolism Ov erview GS10 GS9 GS8 GS7 GS6 GS5 GS4 GS3 GS2 GS1 GS1 GS2 GS3 GS4 GS5 GS6 GS7 GS8 GS9 GS10 8 6
4 2 0 20 15 10 5 0 86 42 0 2015 10 5 0 GSL GSH 1 1E+02 Relative Abundance
GSH vs. GSL R
a ti o GSH GSL Nosig Pathway Indentifiers
The Number of KOs
All Detected Enriched in GSH or GSL
Level 3 of KEGG Functional Category
Level 2 of KEGG Functional Category
Level 1 of KEGG Functional Category ko01200 ko00052 ko00010 ko00040 ko00500 ko00720 ko00680 ko00190 ko00910 ko00100 ko00600 ko00511 ko00550 ko00525 ko00524 ko00521 ko00365 ko00627 ko00982 ko00980 ko00440 ko00860 ko01053 ko01056 ko01057 ko00909 ko00253 ko00240 ko04540 ko04145 ko02010 ko03070 ko04150 ko04015 ko03050 ko04141 ko03018 ko03430 ko03420 ko00970 ko03010 ko03013 ko04978 Carbon metabolism Galactose metabolism Glycolysis / Gluconeogenesis Pentose and glucuronate interconversions Starch and sucrose metabolism Carbon fixation pathways in prokaryotes Methane metabolism Oxidative phosphorylation Nitrogen metabolism Steroid biosynthesis Sphingolipid metabolism Other glycan degradation Peptidoglycan biosynthesis Acarbose and validamycin biosynthesis Neomycin, kanamycin and gentamicin biosynthesis Streptomycin biosynthesis
Furfural degradation Aminobenzoate degradation Drug metabolism - cytochrome P450 Metabolism of xenobiotics by cytochrome P450 Phosphonate and phosphinate metabolism Porphyrin and chlorophyll metabolism Biosynthesis of siderophore group nonribosomal peptides Biosynthesis of type II polyketide backbone Biosynthesis of type II polyketide products Sesquiterpenoid and triterpenoid biosynthesis Tetracycline biosynthesis
Pyrimidine metabolism Gap junction Phagosome ABC transporters Bacterial secretion system mTOR signaling pathway Rap1 signaling pathway Proteasome
Protein processing in endoplasmic reticulum RNA degradation
Mismatch repair Nucleotide excision repair Aminoacyl-tRNA biosynthesis Ribosome RNA transport Mineral absorption 207 39 68 40 69 61 97 106 44 6 11 11 27 6 2 12 7 50 6 6 15 62 19 6 10 6 10 86 4 8 342 67 4 4 3 20 20 24 12 32 90 15 4 55 14 21 14 25 20 31 36 6 2 6 6 12 4 2 6 6 8 2 2 6 16 9 4 3 2 3 26 3 5 47 10 3 3 3 8 9 9 7 14 31 7 2
1 10 10010001 10 100
Transport and catabolism Cellular community - eukaryotes Nucleotide metabolism Overview
Carbohydrate metabolism
Energy metabolism
Lipid metabolism Glycan biosynthesis and metabolism
Biosynthesis of other secondary metabolites
Xenobiotics biodegradation and metabolism
Metabolism of other amino acids Metabolism of cofactors and vitamins
Metabolism of terpenoids and polyketides
Membrane transport
Folding, sorting and degradation
Replication and repair
Translation Signal transduction
Digestive system
Metabolism
Environmental Information Processing
Genetic Information Processing Cellular Processes
Organismal Systems
A
C
B
(rpoB, DNA-directed RNA polymerase subunit beta; mean 0.11%). These functional categories are mainly in-volved in“purine metabolism,” “pyrimidine metabolism,” and “RNA polymerase”pathways. Moreover, we counted the pathways in which the abundant differential KO functional categories (relative abundance > 0.03%) were involved (Fig. 4b). In both GSH and GSL, “metabolism” pathways were the main components, but there were multiple pathways that belonged to“genetic information processing”in GSL but no such pathway in GSH.
To further explore the pathways in which all differen-tial KO functional categories were involved, KO func-tional categories enriched in GSH or GSL were separately analyzed for KEGG pathway enrichment (Fig. 4c). The “nitrogen metabolism” pathway was sig-nificantly (P< 0.05) enriched in GSH. Concomitantly, ef-fector genes and enzymes, including nrtABC, nasDEF,
cynAB, napB, and formamidase, exhibited significantly increased relative abundance in the microbiome of GSH compared to that of GSL. These genes and enzymes are supposed to participate in the transport of nitrate and nitrite as well as the reduction of nitric oxide and the hydrolysis of formamide. The pathways involved in“drug metabolism—cytochrome P450” and the “metabolism of xenobiotics by cytochrome P450”were enriched in GSH and may play important roles in thaxtomin phytotoxin biosynthesis [38, 40]. The metabolism of some sub-stances, such as aminobenzoate, drugs, cofactors, vita-mins, terpenoids, and polyketides, was also enriched in GSH. Furthermore, the “steroid biosynthesis,” “ABC transporters,” and “bacterial secretion system” pathways were enriched in GSH. K03223, K03225, K03226, K03227, K03228, and K03229 are involved in the “ bac-terial secretion system” pathway and exhibited signifi-cantly increased relative abundances in GSH compared to GSL, and the genes that they matched, including
hrcQRSTU, sctLQRSTU, and yscLQRSTU, encode type III secretion proteins. In contrast, the“carbohydrate me-tabolism” and “energy metabolism” pathways were sig-nificantly reduced in GSH compared to those in GSL. The biosynthesis pathways of some glycans and antibi-otics, such as acarbose, streptomycin, validamycin, neo-mycin, kanamycin, and gentamicin, were also significantly depleted in GSH. Several pathways related to “genetic information processing,” such as “folding, sorting, and degradation”; “replication and repair”; and “translation”, were significantly depleted in GSH.
Discussion
Soil microorganisms play important roles in plant dis-ease occurrence and prevention [6–9], and microbial communities have been found to successfully suppress plant diseases in previous studies [10, 11]. Although some strains have been proven to reduce the incidence
and/or severity of CS in previous studies [47–53], there has yet been no systematic study of the interactions be-tween the soil microbiome and CS, so we systematically measured the relationships between soil microbiomes and CS using qPCR, bacterial 16S rRNA gene amplicon sequencing, and shotgun metagenomic sequencing.
Determining which soil-root system compartments are closely associated with CS is a matter of utmost import-ance, as it is related to the suitability of the surrounding soil for the continued planting of potatoes. Therefore, we investigated the relationships between CS and bacter-ial community composition in four soil-root system compartments, GS, RS, ZS, and FS, around potato plants. (i) HightxtABgene copy numbers were only de-tected in GS, while few or no txtAB gene copies were detected in the other compartments (Fig. 1a). (ii) The bacterial 16S rRNA gene copy numbers in GS were sig-nificantly different between H and L, while those in RS, ZS, and FS were not (Fig.1b). (iii) Amplicon sequencing and alpha-diversity analysis indicated that marginal sig-nificant differences only existed between the H and L groups in GS, and no significant differences were de-tected in the other soil compartments (Fig. 1c). (iv) PCoA revealed that GSH and GSL could be distin-guished according to scab severity, but there was no clear separation in RS, ZS, or FS (Fig. 1d–h). (v) The Wilcoxon test revealed 58 significantly differentiated genera in GS between H and L, far more than the 1 dif-ferentiated genus in RS, 5 difdif-ferentiated genera in ZS, and 7 differentiated genera in FS (Table1). In addition, a significant difference in the population levels of patho-genicStreptomycesbetween resistant and susceptible po-tato genotypes was found in the tubers but not in the roots or RS [66]. Similarly, no significant difference was found in the microbial community composition in soil within 10 cm of the central axis of the potato plant [67], which was equivalent to the ZS in the current study. Taken together, these results suggest that the studied GS bacterial community was closely associated with CS oc-currence, while those of RS, ZS, and FS were not.
related to the complexity of microbial interaction net-works [18,19]. High microbial diversity can improve com-munity stability [72,73], which may explain why the more complex co-occurrence network of the bacterial commu-nity was present in samples with L (Additional file 1: Figure S6). Microbial function is more closely linked to environmental factors than community composition, and in a similar environment, microbial composition may vary greatly while microbial function remains similar [74–76]. Similar findings were found in our study (Fig.3); the sig-nificant difference in microbial function similarity rather than composition similarity may indicate that scab severity was more closely related to microbial function than to community composition. Overall, the microbiome char-acteristics indicating soil health were high bacterial diversity and high co-occurrence network complexity. For CS, low thaxtomin biosynthetic gene txtAB abun-dance, low bacterial abunabun-dance, and high microbial function similarity in the GS microbiome could also be characteristics of soil health.
Plant pathogens have long been of concern because they can directly infect plants and cause diseases, but the role of the soil microbial community in disease de-velopment is of interest because it might directly or in-directly interact with plant pathogens and regulate disease occurrence [77–79]. The results of the correlation analysis revealed that some microorganisms are signifi-cantly associated with the scab severity level, EAA of pathogenic Streptomyces, and txtAB gene copy number (Fig. 2). Variovorax and Stenotrophomonas were signifi-cantly positively correlated with these three parameters and were the most abundant taxa in the bacterial commu-nity. Variovorax [80–82] and Stenotrophomonas [82, 83] have been reported to potentially hydrolyze cellulose, and cellobiose and cellotriose, the products of cellulose catab-olism, have been shown to stimulate thaxtomin produc-tion [84, 85]. However, S. scabies, S. acidiscabies, and S.
turgidiscabies did not show an ability to hydrolyze cellu-lose [84], so it was supposed thatVariovoraxand Stenotro-phomonas, which have the potential for cellulose hydrolysis, may be responsible for inducing CS by stimu-lating thaxtomin production. In addition, the presence of cellulose 1,4-beta-cellobiosidase (EC:3.2.1.91; CBH2; CBHA; K19668) in our metagenomic KO profiling (Additional file7) supported this hypothesis. The correl-ation analysis revealed thatBacilluswas significantly nega-tively correlated with scab severity level and txtAB gene copy number (Fig.2). Previous studies have reported that some microorganisms, such as Bacillus, Pseudomonas, non-pathogenicStreptomyces, and some fungi, can inhibit the growth or reduce the phytotoxicity of pathogenic
Streptomyces [47–49, 52,86].Bacillusis one of the most famous biocontrol bacteria and it is widely used not only in the prevention and treatment of CS but also in the
biological control of various plant diseases [87–89]. We also found that Pseudomonas was the most abundant genus with the highest relative abundance in GSL (Additional file 1: Table S3). Arseneault et al. demon-strated that a Pseudomonas strain, Pseudomonas fluores-cens LBUM223, could directly alter the transcriptional activity of the txtAB gene in pathogenic Streptomyces
under field conditions, contributing to disease control [49, 50]. Therefore, Bacillusand Pseudomonas may be two potential taxa functioning in the biocontrol of CS in our study. Overall, interaction networks may be formed between the microbial community and CS, and of the microorganisms that are significantly positively corre-lated with CS, some may act synergistically with pathogenic
Streptomyces to cause the disease. Some microorganisms that are significantly negatively correlated with CS may also act as biocontrol agents in the consortium.
Both microbial community composition and microbial function within GS were closely associated with CS (Figs. 3 and 4). QS was recognized due to its ability to coordinate the expression of specific genes of mul-tiple pathogens and to regulate pathogenic perform-ance [90, 91], and K02035, a member of the “QS” pathway, exhibited the highest relative abundance of all the differential KO functional categories and was enriched in GSH. The higher relative abundance in GSH implies that some microorganisms may induce pathogenic Streptomyces to cause CS. The “steroid biosynthesis,” “ABC transporters,” and “bacterial se-cretion system” pathways were also enriched in GSH. Steroids can act as signal molecules that mediate communication between microorganisms and hosts [92, 93], and the “ABC transporters” and “bacterial secretion system” pathways also mediated communi-cations between microorganisms and environments or other organisms [94–96]. Several genes involved in the “bacterial secretion system” pathway, such as
hrcQRSTU, sctLQRSTU, and yscLQRSTU, encode type III secretion proteins; type III secretion systems (T3SSs) are essential for the pathogenicity (the ability to infect) of many pathogenic bacteria [97, 98]. The increased relative abundance of these genes in GSH may indicate a heightened ability to infest microbial communities. Furthermore, the “nitrogen metabolism,” “drug metabolism—cytochrome P450,” and “ metabol-ism of xenobiotics by cytochrome P450” pathways were significantly enriched in GSH. Thaxtomins have been identified as having the basic structure
pathways of some antibiotics, such as streptomycin, validamycin, neomycin, kanamycin, and gentamicin, were significantly enriched in GSL; these antibiotics may play some role in controlling the biomass and compos-ition of the microbial community, which may be one of the reasons why the bacterial abundance in GSH was higher than that in GSL. In short, the occurrence of CS was accompanied by an increase in the relative abundance of multiple pathogenicity-related genes in the soil microbiome.
Both metagenomic sequencing and bacterial 16S amplicon sequencing were performed to explore the GS microbiome in the present study. Amplicon sequencing can reveal microbial community composition, while metagenomic sequencing can reveal microbial commu-nity composition as well as commucommu-nity function. For bacterial community composition at the genus level, similar amplicon and metagenomic sequencing cluster-ing patterns were described by PCoA (Additional file 1: Figure S7), demonstrating that the community similarity relationships identified by the two techniques were rela-tively consistent. While amplicon sequencing is unable to detect microbial community function, our metage-nomic data revealed some functions associated with scab severity (Fig. 4). Furthermore, due to sequencing tech-nology limitations, amplicon sequencing failed to iden-tify Streptomyces to the species level, but analyzing the taxonomic profile of our metagenomic data revealed some species of Streptomyces, two of which were pos-sible scab pathogens. Since metagenomic sequencing is relatively expensive, we first performed amplicon se-quencing for all samples and then selected prominent samples for metagenomic sequencing; this strategy has been adopted in many previous studies [100–102]. In addition, we estimated the absolute and relative abun-dance of microbial species in the GS metagenomic pro-files. Previous studies have mostly been based on the relative abundance of microbial profiles, but there are now ways to estimate absolute abundance from relative abundance [64, 103, 104]. We assessed the correlations between the entireStreptomycesgenus and the severity of CS, and the results indicated that the EAA of the entire
Streptomyces genus was significantly correlated with CS severity (Fig.2; Spearman,ρ= 0.89,P= 0.0005), while the relative abundance was not (Spearman,ρ= 0.54,P= 0.11). Consistently, the scab severity level was more related to the EAA of pathogenic Streptomyces (Spearman, ρ= 0.89, P= 0.0005) than to the relative abundance (Spearman, ρ= 0.66, P= 0.036). These results demon-strate that absolute abundance better reflects the CS severity than relative abundance.
As the important members of the soil-root system, plants, microorganisms, and the environment can interact with each other. We noticed differences in
the soil physicochemical characteristics (Additional file 1: Table S1) and spatial separation (Additional file 1: Figure S1) of the sample sites between the H and L groups, so it was necessary to verify whether the relationships between the soil microbiome and scab occurrence remain valid with interference from these spatial factors. Despite spatial separation and soil physicochemical differences, there were no signifi-cant differences in bacterial 16S copy numbers (Fig. 1b), diversity (Fig. 1c, Additional file 1: Table S2), and compositions (Fig. 1g, h) between the H and L groups in ZS and FS. Thus, the differences in the microbial community characteristics (16S copy num-ber, diversity, community composition, and function) of GS between H and L are more likely to be directly related to CS severity. The spatial effects and soil physicochemical characteristics are not the primary factors responsible for directly shaping the microbial community in this study.
Based on microbial composition and function pro-files, we proposed a hypothetical model of the effect of the soil microbiome on CS (Additional file 1: Figure S8). In addition to the direct effects of patho-genic Streptomyces on the occurrence of CS, some soil microorganisms may also directly or indirectly promote or suppress the occurrence of CS. Through the “ABC transporters,” “bacterial secretion system,” and “QS” pathways, some microorganisms can form an interacting consortium with pathogenic Streptomy-ces to promote the expression of thaxtomin biosyn-thetic genes and help pathogenic Streptomyces to infect their host. Cellulose-hydrolyzing strains, such as Variovorax and Stenotrophomonas, may induce CS by generating cellobiose and cellotriose to stimulate pathogenic Streptomyces to synthesize ThxA, and “ ni-trogen metabolism” and cytochrome P450 from some uncertain microorganisms may contribute to ThxA biosynthesis. In contrast, the biosynthesis of antibi-otics can control the biomass of the microbial com-munity and/or reduce the population of pathogenic
Streptomyces, thus indirectly and/or directly delaying the occurrence of CS. There were also some taxa, such as Bacillus and Pseudomonas, that could inhibit the biosynthesis of ThxA and/or reduce the popula-tion of pathogenic Streptomyces, and non-pathogenic
Streptomyces could also reduce the population of
Conclusions
This study aimed to address the interactions between the soil microbiome and CS, and it confirmed that the microbial community composition and function of GS are associated with CS severity. LowtxtABgene abundance, low bacterial abundance, high diversity, high co-occurrence network com-plexity, and high community function similarity in GS were indicators of low potato CS severity. The GS microbiome associated with potatoes with high scab severity contained pathogenicity-related gene profiles, and several genes in-volved in the “ABC transporters,” “bacterial secretion sys-tem,” “QS,” “nitrogen metabolism” pathways, and some metabolism by cytochrome P450 were significantly enriched in the H group. In contrast, the biosynthetic pathways of some antibiotics were significantly enriched in the L group. Our study broadens the understanding of the relationships between the occurrence of CS and the soil microbiome and provides novel insights into CS occurrence.
Additional files
Additional file 1:Figure S1.Summary of sampling in this study. The
sampling field (34.248727°N, 119.816724°E, 22.9 m a.s.l.) was located in Jiaozhou City in Shandong Province, China.Figure S2.Significantly (P< 0.05) differentiated bacterial taxa between GSH and GSL as evaluated by the linear discriminant analysis effect size (LEfSe) with LDA scores > 2.
Figure S3.Significantly (P< 0.05) differentiated bacterial genera between
GSH and GSL as evaluated using the linear discriminant analysis effect size (LEfSe) with LDA scores > 2 and a two-tailed Wilcoxon test.Figure S4.Phylogenetic tree for 16S rRNA gene sequences of the isolated strains using the neighbor-joining method.Figure S5.
The conversion of the EAA of pathogenicStreptomycesand the copy numbers of the thaxtomin biosynthetic genetxtAB.Figure S6.The co-occurrence network interactions of metagenomic bacterial communities.Figure S7.(A) 16S amplicon sequencing and (B) metagenomic sequencing exhibited similar bacterial community dissimilarity clustering patterns in GS.Figure S8.Hypothetical model of the effect of the soil microbiome on CS.Table S1.Soil physicochemical characteristics of ZS and FS.Table S2.Bacterial alpha-diversity indices of GS, RS, ZS and FS based on the rarefied OTUs at a depth of 29,718 sequences per sample.Table S3.The genera with the highest relative abundance (top 10) in the bacterial community (amplicon sequencing).Table S4.18Streptomycesspecies aligned against the NR database that were possible scab pathogens.
Table S5.Strains isolated from the culture experiment with the
phylogenetic similarity to pathogenicStreptomyces. (DOC 2829 kb)
Additional file 2:Command lines of bacterial 16S amplicon sequencing
analysis. (TXT 2 kb)
Additional file 3:Sequence read numbers of the bacterial OTUs
profiling (sequenced on a MiSeq PE250 sequencer at a depth of 29,718 sequences per sample). (XLS 882 kb)
Additional file 4: Relative abundance of the metagenomic microbial
taxonomic profiling (at genus level) (XLS 356 kb)
Additional file 5:Relative abundance of the metagenomic bacterial
taxonomic profiling (at genus level) (separated from the microbial taxonomic profiling) (XLS 355 kb)
Additional file 6:16S rRNA gene sequences of the 12 isolated
Streptomycesstains. (TXT 15 kb)
Additional file 7:Estimated absolute abundance (EAA) of the
metagenomic bacterial taxonomic profiling (at genus level) (XLS 354 kb)
Additional file 8:Relative abundance of the metagenomic microbial
function profiling (KEGG orthology function category) (XLS 928 kb)
Abbreviations
CS:Common scab; EAA: Estimated absolute abundance; FS: Furrow soil; GS: Geocaulosphere soil; H: (the group with) High common scab severity; KO: KEGG orthology; L: (the group with) Low common scab severity; RS: Rhizosphere soil; ThxA: Thaxtomin A; ZS: Root-zone soil
Acknowledgements
I sincerely thank all those who have assisted me with any part of this paper, but I would like to especially thank Dr. Ye Deng (Research Centre for Eco-Environmental Science, Chinese Academy of Sciences, Beijing, China), Dr. Yan He (Zhujiang Hospital, Southern Medical University, Guangzhou, China), Dr. Linwei Wu (Department of Microbiology and Plant Biology, University of Oklahoma, Norman, USA), and Dr. Sai Xu (Department of Environmental Engineering, Tsinghua University, Beijing, China), who have provided an abundance of helpful advice on my data analysis and writing and tried their best to improve my paper.
Funding
This work was supported by the Funds of the Shandong“Double Tops” Program to ZG, National Natural Science Foundation Project of China (41306150), China Scholarship Council (201708370022), National Key R&D Program of China (2017YFD0201100 and 2017YFD0800200), and the Potato Innovation Program for the Chief Expert of Shandong Province (SDAIT-16-01).
Availability of data and materials
The raw sequencing data (the 16S and shotgun metagenome fastq files) are publicly available in the NCBI Sequence Read Archive (SRA) under the Bioproject number PRJNA477767.
Authors’contributions
ZG and BZ conceived and supervised the project. WS, ZG, and BZ designed the experiment. WS, BZ, CS, and XC collected the samples. WS, ML, GW, and CL performed parts of the experiment. WS, ZG, ML, GW, and RT analyzed the data. WS, ZG, GW, ML, RT, BW, and RL edited the manuscript. All authors read and approved the final version of the manuscript.
Ethics approval and consent to participate
Not applicable.
Consent for publication
Not applicable.
Competing interests
The authors declare that they have no competing interests.
Publisher’s Note
Springer Nature remains neutral with regard to jurisdictional claims in published maps and institutional affiliations.
Author details
1State Key Laboratory of Crop Biology, Shandong Agricultural University,
Tai’an 271018, China.2College of Life Sciences, Shandong Agricultural
University, Tai’an 271018, China.3Key Laboratory of Marine Genetic
Resources, Third Institute of Oceanography, SOA, Xiamen 361005, China.
4South China Sea Resource Exploitation and Protection Collaborative
Innovation Center (SCS-REPIC), Sun Yat-Sen University, Guangzhou 510275,
China.5Department of Botany and Microbiology, Institute for Environmental
Genomics, University of Oklahoma, Norman, USA.6National Engineering
Laboratory for Efficient Utilization of Soil and Fertilizer Resources, Tai’an
271018, China.7College of Agronomy, Shandong Agricultural University,
Tai’an 271018, China.8Plant Protection Station, Jiaozhou Agricultural Bureau,
Qingdao 266300, China.
Received: 14 July 2018 Accepted: 17 January 2019
References