Towards the automation of early‑stage
human embryo development detection
Vidas Raudonis
1†, Agne Paulauskaite‑Taraseviciene
2†, Kristina Sutiene
3*†and Domas Jonaitis
1†Abstract
Background: Infertility and subfertility affect a significant proportion of humanity. Assisted reproductive technology has been proven capable of alleviating infertility issues. In vitro fertilisation is one such option whose success is highly dependent on the selection of a high‑quality embryo for transfer. This is typically done manually by analysing embryos under a microscope. However, evidence has shown that the suc‑ cess rate of manual selection remains low. The use of new incubators with integrated time‑lapse imaging system is providing new possibilities for embryo assessment. As such, we address this problem by proposing an approach based on deep learning for automated embryo quality evaluation through the analysis of time‑lapse images. Automatic embryo detection is complicated by the topological changes of a tracked object. Moreover, the algorithm should process a large number of image files of differ‑ ent qualities in a reasonable amount of time.
Methods: We propose an automated approach to detect human embryo development
stages during incubation and to highlight embryos with abnormal behaviour by focusing on five different stages. This method encompasses two major steps. First, the location of an embryo in the image is detected by employing a Haar feature‑based cascade classifier and leveraging the radiating lines. Then, a multi‑class prediction model is developed to identify a total cell number in the embryo using the technique of deep learning.
Results: The experimental results demonstrate that the proposed method achieves an
accuracy of at least 90% in the detection of embryo location. The implemented deep learning approach to identify the early stages of embryo development resulted in an overall accuracy of over 92% using the selected architectures of convolutional neural networks. The most problematic stage was the 3‑cell stage, presumably due to its short duration during development.
Conclusion: This research contributes to the field by proposing a model to automate
the monitoring of early‑stage human embryo development. Unlike in other imaging fields, only a few published attempts have involved leveraging deep learning in this field. Therefore, the approach presented in this study could be used in the creation of novel algorithms integrated into the assisted reproductive technology used by embryologists.
Keywords: Deep learning, Location detection, Embryo development, Image
recognition, Multi‑class prediction
Open Access
© The Author(s) 2019. This article is licensed under a Creative Commons Attribution 4.0 International License, which permits use, sharing, adaptation, distribution and reproduction in any medium or format, as long as you give appropriate credit to the original author(s) and the source, provide a link to the Creative Commons licence, and indicate if changes were made. The images or other third party material in this article are included in the article’s Creative Commons licence, unless indicated otherwise in a credit line to the material. If material is not included in the article’s Creative Commons licence and your intended use is not permitted by statutory regulation or exceeds the permitted use, you will need to obtain permission directly from the copyright holder. To view a copy of this licence, visit http://creat iveco mmons .org/ licen ses/by/4.0/. The Creative Commons Public Domain Dedication waiver (http://creat iveco mmons .org/publi cdoma in/zero/1.0/) applies to the data made available in this article, unless otherwise stated in a credit line to the data.
RESEARCH
*Correspondence: [email protected]
†Vidas Raudonis, Agne
Paulauskaite‑Taraseviciene, Kristina Sutiene and Domas Jonaitis contributed equally to this work
3 Department
of Mathematical Modelling, Kaunas University
of Technology, 51368 Kaunas, Lithuania
Background
Infertility is a growing problem worldwide. According to the World Health Organiza-tion, one in every six couples has issues leading to infertility problems. It has been noted that the global in vitro fertilisation (IVF) market is expected to grow at an
approximated 10% compound annual growth rate between 2018 and 2026 [1].
Geo-graphically, Europe dominates the market by capturing the largest share, which is driven by low fertility rates, government financial support for the adoption of IVF and other fertility treatments, and the increasing success rate of IVF methods. According
to the forecasts [2], the Asia-Pacific region is anticipated to demonstrate rapid growth
in the foreseeable future. Causes of infertility are numerous, potentially including factors such as anatomical or genetic problems, physiological dysfunction, sexu-ally transmitted diseases, endocrinological or immunological problems, and many more. Moreover, the rising trend towards delaying pregnancy due to career concerns, financial reasons or not finding the right partner has also increased the need for IVF services. The success of IVF procedures is closely linked to many biological and tech-nical issues. The fertilisation and in vitro culturing of embryos are dependent upon an environment that should be stable and correct with respect to temperature, air quality, light, media pH and osmolality. After fertilisation, an embryo that develops normally will continue to divide, growing to the blastocyst stage by the fifth or sixth
day; however, only one-third of all embryos are capable of reaching this stage [3]. The
success rate of IVF procedures resulting in a pregnancy varies between age group in
average it is less than 52% [4]. For this reason, more than one embryo is transferred,
which subsequently increases the risk of multiple pregnancies. In fact, more than 30% of IVF-induced pregnancies are multiple-infant births. For this reason, embryo viabil-ity is monitored by an embryologist during the IVF procedure. Nevertheless, embryo assessment is subjective and based on limited observations if it is performed visually by placing the fertilised embryo under a microscope once to a few times per day.
Time-lapse (TL) systems developed over recent years (with or without computer algorithms) provide a massive number of digital images of embryos at frequent time intervals, thus enabling embryologists to assess the quality of the embryos without
physically removing them from their culture environment [5]. Embryos can be
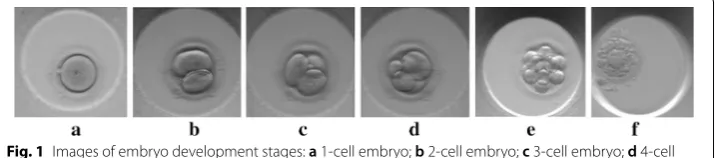
trans-ferred to the uterus at the cleavage stage (Day 2 or 3, Fig. 1b–e) or blastocyst stage
(Day 5, Fig. 1f). Transferring embryos at the blastocyst stage may increase the
likeli-hood of selectively transferring viable and genetically normal embryos [6]. The
cor-rect identification of cell number creates presumptions for determining the timing parameters from time-lapse imaging, such as the duration between different stages,
which was approved as being significant in the evaluation of embryo quality [7].
Despite all of the recent advances in computer vision research, the automatic detec-tion and tracking of cells remain challenging. This task is complicated by the topological changes of tracked objects (cell division) in addition to the possible presence of randomly appearing noise in the images. In comparison, many other medical imaging applications exist, where the variability of relevant data, such as target object, surrounding structures or image acquisition parameters, have a large impact on the decisions made by domain
experts. For example, a previous experiment [8] emphasised the need to study
longitudi-nal retilongitudi-nal nerve fibre layer (RNFL) thickness changes in patients with open-angle glau-coma, while the need to develop a single software package to automatically determine differences in aortic diameter from multiple scans of the same patient was presented
recently [9]. Moreover, the algorithm to be developed should process a large number of
image data files of different quality in a reasonable amount of time. Unlike in other fields of image recognition, far too little attention has been paid to the use of artificial intelli-gence in the detection of human embryo quality development.
Deep learning is now a state-of-the-art artificial intelligence model across a variety of domains and is seen as a key technique for future human-support technologies. As
indi-cated by previous studies [10, 11], deep learning methods—more specifically
convolu-tional neural networks (CNNs)—hold huge potential for medical imaging technology, medical diagnostics and healthcare in general. Unlike conventional machine-learning techniques, deep neural networks simplify the feature engineering process, provide abstract learning through a hierarchical representation of the data, efficiently deal with vast amounts of data and demonstrate their superiority in detecting abnormalities in medical images. Recently, an approach named STORK was developed that can be used
for unbiased and automated embryo assessment using TL images [12]. They formulated
a binary classification problem focusing on good- and poor-quality embryo assess-ment, which was tackled using deep neural networks, more specifically Inception-V1 architecture. In their research, authors used a large collection of human embryo time-lapse images (approximately 50,000 images) from a high-volume fertility centre in the US. The authors highlighted that STORK was able to predict blastocyst quality with an
area under curve (AUC) of >0.98 , which is a very promising result. In the same
man-ner, Iwata et al. [13] examined the use of deep learning on images of human embryos for
predicting good- and poor-quality embryos. They also referred to other studies [14–16]
that utilised artificial intelligence approaches for quality prediction or grade
classifica-tion with varying degrees of success. Comparatively, in another study [17], the authors
used a list of the main morphological features of a blastocyst with the aim of automating embryo grading using support vector machine (SVM) classifiers. They reported accu-racies ranging from 0.67 to 0.92 for embryo development classification. Overall, these studies represent attempts to develop reliable algorithms for the prediction of a two-class problem.
Notably, the application of artificial intelligence focusing on multi-class prediction remains scarce. The recent study proposed a standalone framework based on Inception-V3 CNNs as the core to classify individual TL images up to the 4-cell stage for mouse
and human embryos, respectively [18]. In their work, 31,120 images of 100 mouse
classification accuracy of 90% when the model was applied to predict individual images up to the 4-cell stage, while accuracy of 82% was achieved when it was applied to identify embryos up to the 8-cell stage. In this context, a three-level four-class embryo stage clas-sification method based on the Adaboost ensemble was proposed with the aim to iden-tify the number of cells at every time point of a TL microscopy video, which resulted in an average accuracy of 87.92% for human embryos, but exhibited only 20.86% accuracy
for 3-cell detection [19]. To the best of our knowledge, these are the few known works
that have addressed the identification of early-stage embryo development by formulat-ing a multi-class prediction problem.
In line with these findings, the present study contributes to this field by proposing a model to automate the monitoring of early-stage human embryo development by focus-ing on the prediction of the cell number durfocus-ing the division process for up to 5 days. This involves segmenting embryos from the image and then predicting defined number classes that relate to the embryo development stages (i.e. 1-cell, 2-cell, 3-cell, 4-cell and
> 4-cell; see Fig. 1) using CNNs. Whereas one of the key elements of the system is the
detection of embryo location in an image, the algorithm is proposed for this purpose. It first determines the rough embryo location using a Haar feature-based cascade classifier and then specifies its accurate location by means of the radiating lines. The use of this algorithm allowed us to achieve an accuracy of over 92% in predicting the early stages of embryo development.
Results
Images of early-stage embryo development were captured using a ESCO Miri TL incu-bator system with an integrated camera, which has a 2.35-megapixel image sensor that
provides a 1936 × 1216 pixels (px) resolution output (2.48 px = 1.00 µm). It captures the
embryo image in 7 different focal planes. The camera is capable of capturing 47 frames per second. However, recording of the development process is performed at 5-min inter-vals since embryo development is a relatively slow process. The experiment included 300 TL embryo development sequences for a total of 114,793 frames (18.73%, 25.45%, 9.35%, 20.65% and 25.82% of the data set for 1 to > 4-cell stages, respectively).
First, the automatic detection of embryo location in the image was performed using the cascade classifier. It was noted that mostly linear diagonal Haar-like features were
leveraged by the algorithm (see Fig. 2a). Unfortunately, the location of the entire embryo
was not always successfully detected, as illustrated in Fig. 2. For instance, (a) a wrong
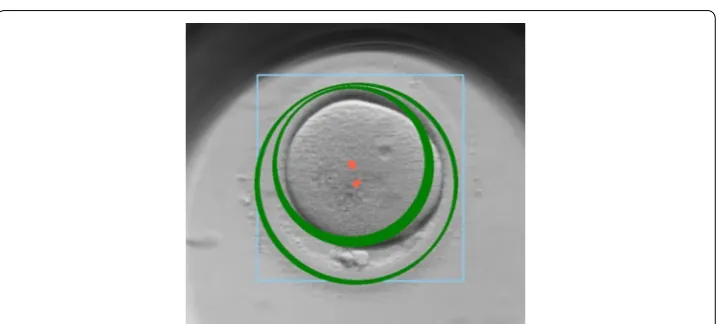
area of the entire embryo is determined; (b) the individual cells are detected but not the entire embryo; (c) the empty areas are determined; or (d) the objects of no interest are also detected. Therefore, the algorithm developed by the authors was used for embryo location detection. The proposed embryo location detection algorithm was considered successful for a problem if the entire embryo and its fused membrane were correctly identified in the image. The thickness of the membrane, its brightness and the number of granules are among the top criteria for assessing the quality of an embryo. That is why
their detection is a crucial step in the present research. In Fig. 3, a well-localised embryo
is highlighted by a green circle.
pixel values. Higher gradient values are obtained when the line is radiating over the embryo boundaries, where digital images have discontinuities. This allows us to indicate the physical limits (a boundary) of embryo.
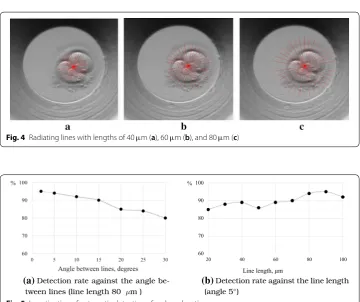
The length of the line and the angle between radiating lines are the main parameters to be considered. The change of line length affects the area of the image to be covered, while the change of angle between lines determines a different density to be explored in
the image. Figure 4 demonstrates the scattering of lines in the image for different lengths
of radiating lines, given in µm.
The ability of the proposed algorithm to correctly detect an entire embryo location
is demonstrated in Fig. 5, where different radiating line lengths and the angle between
them are investigated.
As illustrated in Fig. 5, the correct location detection rate for the entire embryo
is rather high. However, the algorithm is more sensitive to changes in angle size
between lines (see Fig. 5a). The increase of angle negatively impacts the detection
quality. On the other hand, the number of points to be processed increases rapidly if
the angle is decreased. Figure 5b shows that the detection rate is above 90% if the line
length is over 70 µ m when the angle is 5 ◦ . Typically, an embryo covers an area from
101 × 101 µ m up to 121 × 121 µm.
Fig. 2 Illustration of accurate localisation (black rectangle) and unsuccessful localisation (red rectangle) of early‑stage embryo including a a detection of wrong area; b a determination of individual cells; c a determination of empty areas; d a detection of not relevant objects
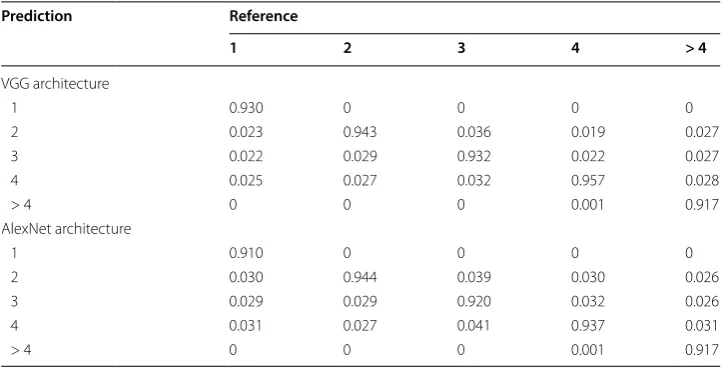
Next, the classification of embryo development stages is explored. In the present research, five classes were specified in order to represent each early stage of embryo development (i.e. 1-cell, 2-cell, 3-cell, 4-cell, > 4-cell). The obtained confusion matrix
for two CNNs architectures, such as AlexNet and VGG16, is presented in Table 1.
It can be seen that the classification performance is generally quite high. The com-parison of two classifiers was performed by computing the confusion matrix-based
performance measures [20, 21]. All experiments demonstrated in the paper have been
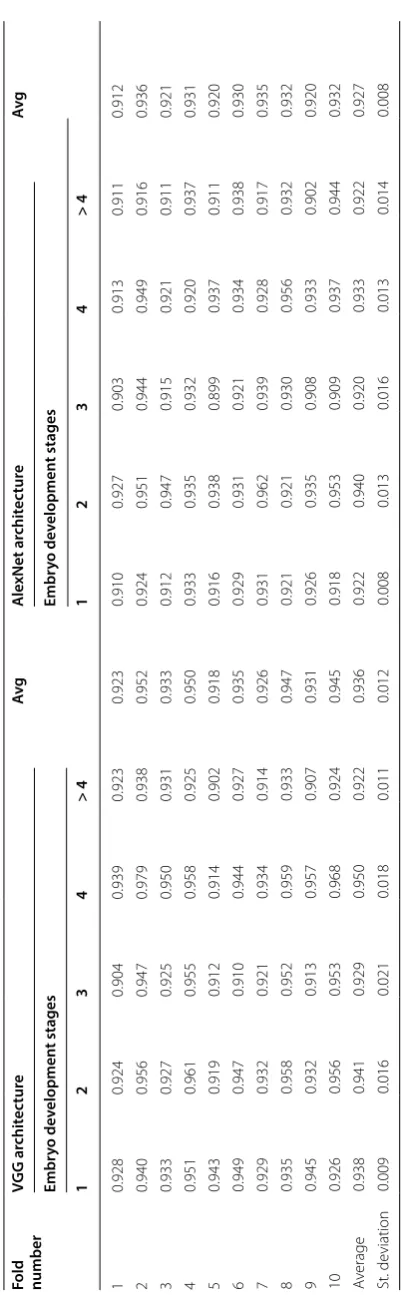
performed forming training and testing image data sets in a ratio of 70:30, respec-tively. The tenfold cross-validation has been performed in order to estimate the pre-diction accuracy of a classifier using CNNs. The stratified version of this method was selected so that the correct proportion of each of the class values would be assigned to each fold. The results of stratified cross-validation are provided in Appendix C, where
Table 4 reports the classification accuracy averaged over all tenfold achieved using the
selected CNN architectures. One can see that VGG model achieved average accuracy of 0.936 and its standard deviation of 1.2%. Comparatively, AlexNet model resulted in average classification accuracy of 0.927 and smaller standard deviation of 0.8%. Unsur-prisingly, the 3-cell stage was the most challenging since the lowest average accuracy accompanied with the largest deviation was achieved when either model was used. On the whole, cross-validation results give us assurance that the accuracy estimate is stable.
Table 2 highlights that the overall performance in terms of selected measures using
the AlexNet architecture is slightly worse when compared to results from using the VGG architecture. It is evident that no difference exists between micro-accuracy and
Fig. 4 Radiating lines with lengths of 40 µ m (a), 60 µ m (b), and 80 µ m (c)
(a) (b)
macro-accuracy. Compared to a macro-F1 score, micro-F1 obtains larger values for both CNNs architectures used in the experiment. Since F1 score is a balance between
precision and recall, Table 3 was created to reveal the classifier performance by class to
address these measures.
Table 3 shows that precision is rather low for the third class, which defines the embryo
stage as having three cells. Since micro-averaging favours classes with a larger number of instances, the final estimate was influenced by good performance for the classification of the other classes.
The training and testing data sets consist of images of different embryos (more than one patient). The quality of images is different, because of several reasons, such as the image is out of focus, the embryo is partly occluded with foreign objects, the embryo is
Table 1 Confusion matrices: each column shows the reference, while numbers running diagonally show the percentage of correct classification for every class considered in the experimental study
Prediction Reference
1 2 3 4 > 4
VGG architecture
1 0.930 0 0 0 0
2 0.023 0.943 0.036 0.019 0.027
3 0.022 0.029 0.932 0.022 0.027
4 0.025 0.027 0.032 0.957 0.028
> 4 0 0 0 0.001 0.917
AlexNet architecture
1 0.910 0 0 0 0
2 0.030 0.944 0.039 0.030 0.026
3 0.029 0.029 0.920 0.032 0.026
4 0.031 0.027 0.041 0.937 0.031
> 4 0 0 0 0.001 0.917
Table 2 Overall performance
VGG AlexNet
Macro‑accuracy 0.936 0.927
Micro‑accuracy 0.935 0.925
Macro‑F1 0.926 0.919
Micro‑F1 0.963 0.952
Table 3 Class-specific performance
VGG AlexNet
Precision Recall Precision Recall
1 1.000 0.930 1.000 0.910
2 0.927 0.943 0.915 0.944
3 0.790 0.932 0.767 0.920
4 0.901 0.957 0.888 0.937
captured outside of the image sensor, etc. The image data set was carefully examined and labelled by a skilled embryologist. Poor data such as low-resolution images, images with-out an embryo or images with an occluded embryo with a material that does not belong to the embryo were excluded. The duration of the 3-cell stage is approximately 8–10 times shorter than, for example, the 2-cell stage; as such, the number of samples of the 3-cell stage in the image data set is smaller. Therefore, the number of samples at other cell stages (1-cell, 2-cell, 4-cell, or higher) was limited to the number of 3-cell samples.
Discussion
The evaluation of early-stage embryo quality has been a matter of debate for many years. Using novel computer vision algorithms, various techniques have been developed to maximise the effectiveness of assisted reproductive technology. The use of TL imag-ing might increase the IVF success rate since this new approach allows the detection of abnormal behaviour in developing embryos.
TL imaging enhanced the selection criteria of the transferable embryo since the devel-opment of the embryos is observed to be more accurate. The quality of an embryo can
be described by the KIDScore grading method [22]. It demonstrates that the embryo
transition or cleavage from one stage to another has a certain optimal time. If an embryo cleaves from one cell to more cells too quickly or too slowly, then the embryo has a low probability for transfer. The authors of this paper aim to evaluate the embryo develop-ment with the use of deep learning techniques in order to automate the assessdevelop-ment of embryo quality at early development stages. The proposed method consists of two major steps: the embryo localisation into 2D image space and embryo stage classification.
The accurate localisation of the embryo into 2D image is very important task. It is done using the combination of Haar-like features and computation of the gradients on cell boundaries. Haar-like features are sensitive to the contrast of the image. These features provide more accurate output when captured embryo image has sharp edges. Lower accuracy is acquired, when image is out of focus and embryo boundaries are fuzzy. The appearance of foreign objects in the cultivating dish is not common thing. However, when foreign objects appear they can partly occlude an embryo or be next to it. Foreign objects can be mistaken as an embryo or can distort final classification result by occluding the embryo. The authors of the research work are proposing to use as many as possible Haar-like feature to lower risk of the false classification. More Haar-like fea-tures describe more embryo-specific characteristics in the image and it becomes separa-ble from foreign object. Notably, the proposed approach has certain limitations. A deep learning-based method is only as smart and accurate as the data provided in training. For this research, the model was trained using TL images from a private IVF clinic. The training database used to construct a decision-making core could be expanded by cap-turing more possible variations of different embryos. Synthetic images of human embryo cells could be generated using Generative Adversarial Networks (GANs) due to a lack of
real-world data [23], however the highest results of 96.2 % have been achieved for 1-cell
of objects are allowed [24]. The method has shown its superiority in generating data for medical imaging in solving unsupervised classification problem, which suffers from a small training set and includes only two classes of images (i.e. cancer or not cancer)
[25]. However, our research goal is to find embryos with the best quality among others
for human IVF while solving a multi-class prediction problem, therefore learning using only realistic images is reasonable. Therefore, it might be interesting to explore different algorithms for generating partial or hybrid data set, where original and synthetic data are used in learning. This could be the next step towards being able to build a fully auto-matic monitoring system for evaluating embryo quality.
Conclusion
The present study has reported the problems and suggested methods to automate early-stage human embryo detection. The proposed algorithm consists of two compo-nents, namely embryo localisation in the image and classification of embryo develop-ment stage. The detection of embryo location has been successful by using the improved object detection algorithm. First, the rough centre of the embryo is identified using Haar-like features. Then, a more accurate location of the embryo is computed by lev-eraging the radiating lines. The experimental investigation showed that detection
accu-racy of at least 90% was reached using radiating lines of length 80 µ m placed at every 5°.
It was also determined that 80 µ m is the optimal line length (radius detected from the
rough centre of an embryo), which is sufficient to wrap the entire embryo in the image. Embryo stage classification performance had an overall accuracy above 92%, which was achieved for both CNN architectures considered in the paper. The most problematic was the third class, which defines the 3-cell stage. This might have been caused by this stage usually being short compared to the other classes defined in the paper.
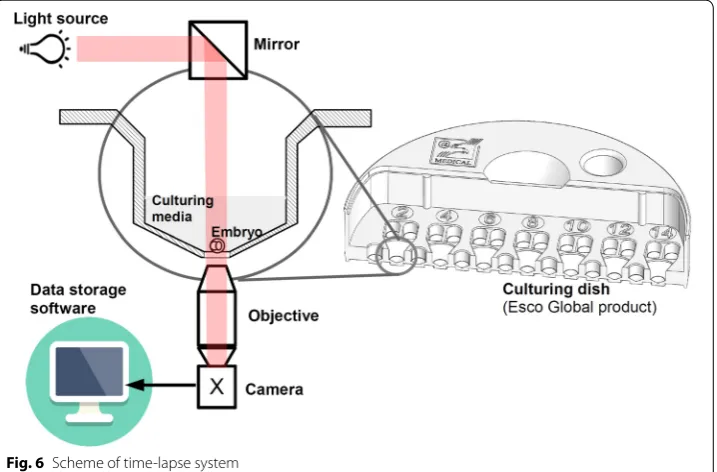
Methods Time‑lapse system
Time-lapse (TL) system is part of the IVF incubator, which is used to register embryo
development during its cultivation (see Fig. 6). It captures images of an embryo at
cer-tain time intervals (in our case, every 5 min) and stores the images. Typically, such a system consists of three main components: (1) a light source, (2) microscope optics and (3) a video camera. Usually, red light at 650 nm is used to illuminate an embryo, which is cultivated in a specially designed culturing dish, called a culture coin. Microscope optics magnify the embryo cells by 20 times. The TL system is equipped with a 2-megapixels
video camera that allows the capture of an embryo in a 121 × 121 μm area. The TL
sys-tem uses a special mirror (prism) that concentrates light and directs it to the embryo and camera sensor.
embryo at seven different focal planes for more information. Now, embryologists must evaluate each individual image in the sequence and decide which embryo is suitable for transfer. It is a complicated task not only because the embryo can behave unexpectedly during its development, but also because of the massive image data set that includes over 10,000 images per embryo, which must be manually assessed. A skilled embryol-ogist requires less than 2 min to annotate one embryo in the case where embryos do not have a high percentage of fragmentation. Usually, IVF patients have up to 5 or 10 embryos. Henceforth, the manual annotation of all embryos for one patient can take up to 20 min. The automated annotation system can do the same work 10 times faster and without human intervention.
Therefore, an automated detection system of embryo development is presented in the paper that consists of two main components: (1) the localisation of an embryo in an image and (2) the identification of embryo development stages with the aim to identify abnormal division patterns. Since the detection of an embryo localisation in an image is a crucial step, the algorithm is proposed that uses a Haar feature-based cascade classifier to determine the rough embryo location and specify the accurate location with the help of the radiating lines.
Automatic detection of embryo location
Cascade classifier
One of the main steps in this research is to automatically determine embryo location. IVF embryos usually have a round shape with brighter edges. A cascade classifier was trained on a sample containing images with the target object labelled as positives, with negative images containing none of these objects. After the classifier is trained, it can be applied to identify targets in the image. In order to investigate the entire frame, the search window is moved across the image. The search window of a classifier can be eas-ily changed when the size of the target object is unknown. In this case, the search should
be performed several times using all possible search window sizes, which are placed on
all possible locations in the image [26–28].
Cascading is a particular case of ensemble model that is built from several classifi-ers that are sequentially connected. Learning is a multi-stage process where an exten-sion of the original data by the insertion of new attributes is performed in each step. This process accelerates image processing multiple times, as there is no need to check
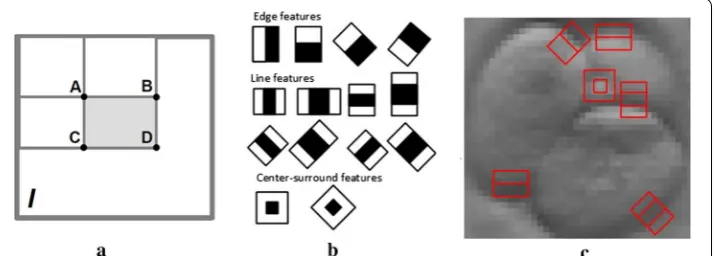
all of the features that are already learned. Haar-like features (see Fig. 7c) are usually
used as inputs to the basic classifiers.
As seen in Fig. 7, Haar-like features are extracted from adjacent rectangular regions
at a specific location in a search window. Then, the difference between the sums of the pixel intensities in each region is computed. The numerical value of one Haar-like feature is computed using integral images. The integral images are two-dimensional lookup tables in the form of matrix of the same size as the original image. Each element in the integral image is a sum of all pixels located on the up-left position of the original
image. The numerical value or the sum S of Haar-like feature is expressed using formula
where A, B, C and D are the points, which belong to the integral image I. The sum S
depends on the type of like feature to be selected. Usually, a large number of Haar-like features must be retrieved to describe the target object with sufficient accuracy. Therefore, these features are fed into a cascade classifier to construct a strong learner.
Proposed algorithm for the detection of embryo location
By default, a cascade classifier allows us quickly to determine the approximate loca-tion of an embryo; however, this is not sufficient for solving our problem. Therefore, the embryo location detection algorithm is developed (see Algorithm 1). Embryo detection consists of two main processing steps. The first step involves the application of a cascade classifier for the detection of rough location. A more accurate location of the embryo is then estimated in the next step using the radiating lines over the image
filtered by a Sobel filter. Two Sobel operators Gx and Gy are used in this work, which
are expressed as
S=I(C)+I(A)−I(B)−I(D),
where Gx is the image gradient in horizontal direction and Gy is the image gradient in
vertical direction. Absolute gradient value G is given by
The proposed algorithm uses a gray-scale image as an input. The rectangular region of interest (ROI) is returned after the execution of the algorithm. The input image is pro-cessed in different scales in order to locate an embryo of the correct size (steps 3–10). If all Haar-like features are applied to satisfy the condition in step 7, then the rough loca-tion of the embryo is detected (step 8). A more accurate localoca-tion (ROI*) of the embryo
is estimated in steps 11–15. Sobel filter [29] is used to find the approximate gradient
magnitude at each point in the gray-scale image at the ROI (step 11). The radiating lines at each point of the detected square are drawn based on the given parameters, such as line length and the angle between lines. For this purpose, Bresenham’s line-drawing
algorithm [30] is applied (step 13). Please refer to Appendix A, for a more detailed
expla-nation of this algorithm. The sum of gradient magnitude for each concentric circle is determined at each point located on the lines. The result of this step is a histogram of
obtained values (see Appendix B). The point estimate is computed by determining the
maximal value in the histogram and its distance from the centre (step 14). Gx=
−1 0 1
−2 0 2
−1 0 1
,
Gy=
1 2 1 0 0 0
−1 −2 −1
,
G
=
G2
The advantage of the proposed algorithm is the ability to strengthen edges at a sub-stantially equal distance from the central point. Although Sobolev gradient-based
opti-misers have been used in some previous studies [31–33], the method proposed in this
work efficiently uses the traditional optimiser. In addition, the proposed approach is suitable for detecting weak and round curves in a noisy background since it provides successful results without an extra step for noise reduction or intensity normalisation, as
seen in previous studies [34, 35]. In comparison, noise reduction is usually applied based
on the determined noise types or levels while using traditional methods [36, 37]. For the
further processing of images, it is important that the entire embryo is correctly cropped, which is the basis for the determining the cell size, monitoring embryo development stages and then classifying them into defined classes.
Alternatively, this task could be solved using object detection methods such as Local Binary Patterns (LBP) or Histogram of Oriented Gradients (HOG). Both methods were tested, but the cascade classifier was selected for further development. The HOG and LBP methods lack localisation accuracy because they require a high-contrast image, where the target object is captured with sharp edges. Moreover, these methods fail in detecting partially overlapped, noisy or blurred objects, as well as they are too sensitive
to object rotation and the location of a region of the target object [38–41]. An embryo
image captured using a time-lapse system is slightly blurry and the boundaries of the embryo are too fuzzy; therefore, methods that are able to generalise the results should be employed.
Identification of embryo development stage by developing a convolutional neural network‑based classification system
The identification of early-stage embryo development is formulated as a multi-class pre-diction problem with the aim to identify the cell number during the division process until day 5 of embryo development. The first attempt to solve the given problem incor-porated the use of principal component analysis (PCA) and SVM. A cascade classifier was used to detect the location of the embryo in the image. PCA was for the reduc-tion of data dimensionality and feature extracreduc-tion. SVM was trained to classify differ-ent cell stages based on PCA features. The combination of a cascade classifier, PCA and SVM gave approximately 85% classification accuracy. Therefore, we employed CNNs to construct an embryo cell classification system, since CNNs have become one of the most widely used models of deep learning and demonstrate high accuracy performance
results in various image recognition tasks [42, 43]. A general CNNs architecture
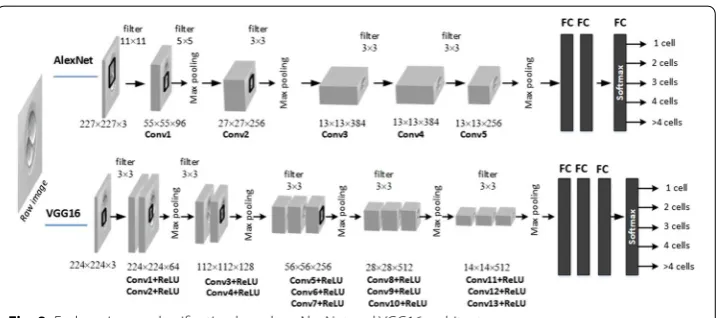
con-sists of several convolutions, pooling, and fully connected layers. A convolutional layer computes the output of neurons that are connected to the local regions in the input. A pooling layer reduces the spatial size of the representation in order to minimise the number of parameters and computations in the network. These layers are followed by fully connected layers leading to the Softmax layer, which is the final classifier. Two pop-ular architectures, AlexNet and VGG16, were selected for the present experiments (see
Fig. 8). Experimental investigations were executed on a Windows 10 machine with 16.0
AlexNet demonstrates high classification results in different types of applications
while retaining a simple and clear structure [44]. As a result, the network of this
architecture is easy to implement. The small number of parameters does not require large computational and memory resources. This architecture consists of five convo-lutional layers and three fully connected layers. AlexNet includes max pooling and makes use of a rectified linear unit (ReLU) nonlinearity which allows training of the network much faster compared to using a common activation function (e.g. tanh or sigmoid) together with data augmentation and dropout regularisation in order to avoid overfitting.
VGG16 network [45] is an improvement over AlexNet by providing the deeper
archi-tecture. A total of 16 layers exist in this architecture, including 13 convolutional layers and 3 fully connected (FC) layers followed by a Softmax classifier. In VGG16, large
ker-nel-sized filters in the first convolutional layers ( 11×11 , 5×5 ) are replaced with
multi-ple 3×3 filters that are used in all 13 convolutional layers. Max pooling layers use only a
2×2 px window with stride of 2. For all convolutional layers, the stride and padding are
set to 1 px.
Comparison of these two architectures reveals that VGG16 has twice as many
param-eters ( ∼527 MB of required memory) as AlexNet ( ∼232 MB of required memory), which
makes it more likely to observe VGG16 demonstrating ∼15% higher classification
accu-racy over AlexNet [46]. However, the computational complexity of VGG16 is very high,
being 10 times greater than that of AlexNet. Notably, AlexNet is one of a few CNNs models capable of achieving super real-time performance with very small batch sizes, thus allowing it to reduce the consumption of system memory (e.g. a batch size of 1 requires less than 1 GB memory). In this research, both architectures are used to explore and estimate their possibilities of achieving high accuracy results (more than 90%) in identifying a total cell number in images of an embryo.
The classification model has been implemented using MatConvNet [47], an
open-source implementation of CNNs in the MATLAB environment that can be easily extended in order to develop new CNNs architectures. Specific software and hardware requirements exist for deep learning model implementations, such as MATLAB 2016a
(or later version), a C\C++ compiler, and a computer with a CUDA-enabled NVIDIA
GPU supporting compute capability 2.0 or above.
In general, different types of measures are used to evaluate the performance of the selected classifiers. In the multi-class setting, the outcome is produced for many
pre-defined classes {C1,. . .,Ci,. . .,CK} , where K is the class cardinality [20, 21].
Accord-ingly, for an individual class Ci , the main counts are defined as true positives TPi ,
false positives FPi , false negatives FNi , and true negatives TNi . These are the main
entrances for the confusion matrix. A list of measures used to assess the performance of a multi-class predictor is richer compared to binary classification. The conven-tional performance measures are modified to consider the class distribution result-ing in macro-averagresult-ing or micro-averagresult-ing computation. A macro-average defines the performance treating all classes equally, whereas a micro-average considers the con-tributions of all classes to compute the selected measure. Obviously, in a multi-class setting, a micro-average is preferable if the class imbalance is prominent.
Abbreviations
CNNs: convolutional neural networks; FC: fully connected; IVF: in vitro fertilisation; PCA: principal component analysis; ReLU: rectified linear unit; ROI: rectangular region of interest; SVM: support vector machine; TL: time‑lapse.
Acknowledgements
Not applicable.
Authors’ contributions
Conceptualisation, VR and APT; methodology, VR and KS; software and data curation, VR and DJ; validation, APT and KS. All authors assisted in writing and improving the paper.
Funding
This research received no external funding.
Availability of data and materials
The image data set used to support the findings of this study has not been made publicly available because the images are owned by a private IVF laboratory (ESCO MEDICAL Ltd., company code 303705851, Draugystes str. 19, 51230 Kaunas, Lithuania) and are available by request only.
Ethics approval and consent to participate
The images were captured by a private IVF laboratory (ESCO MEDICAL Ltd., company code 303705851, Draugystes str. 19, 51230 Kaunas, Lithuania) and then shared with the research group "Smart Automatic Control Systems" led by prof. Vidas Raudonis for research purposes under Data Use Agreement established on 3rd of September, 2018.
Consent for publication
The images were used as anonymised data set for research purpose only.
Competing interests
The authors declare that they have no competing interests.
Appendix A
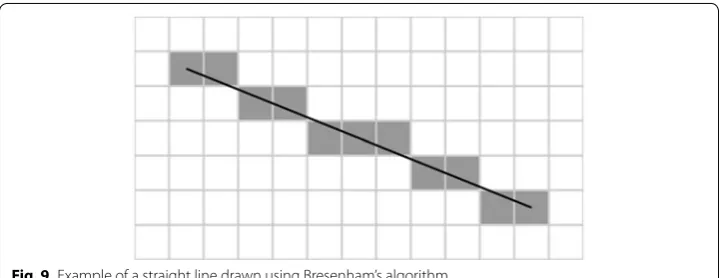
Bresenham’s line‑drawing algorithm
The line-drawing algorithm determines the pixels on 2D digital image that should be selected in order to get close approximation of a straight line between two points.
Line example is shown in Fig. 9.
The algorithm is based on incremental error computation. There exist two basic assumptions concerning the particular implementation of the algorithm. First, the beginning of coordinates is the top-left corner. The pixel coordinates increases in right and down directions. Second, the pixel centres have integer coordinates.
Line-drawing algorithm selects the integer y coordinate corresponding to the pixel, which
where x0 , y0 are the beginning coordinates of the straight line and x1 , y1 are the end
coordinates. The final value of coordinate y is estimated by rounding the quantity to the
nearest integer value. To clarify, the pseudo-code of the Bresenham’s line-drawing algo-rithm is given in Algoalgo-rithm 2.
Appendix B
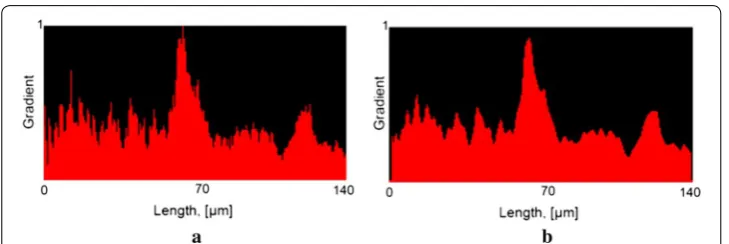
The histogram of gradients is estimated by aggregating the gradient values computed for each radiating line. The distance from the centre of the embryo to the end of the
radiating line is shown on the horizontal axis in µ m. The aggregated and normalised
gradient values are shown on the vertical axis (Fig. 10).
Filtered version of aggregated histogram of gradients is used in this work. The embryo boundaries (or edge) are determined based on the given histogram. The highest gradient values are acquired in the image areas where rapid changes in col-our intensities appear. These regions are usually the boundaries of the embryo cell. The distance from the beginning of the histogram to its peak determines what radius for embryo localisation should be selected in the analysis. The filtered histogram is
shown in Fig. 10b).
y−y0
y1−y0 =
x−x0
x1−x0,
Appendix C
See Table 4.
Results of tenfold stratified cross-validation.
Table 4 A ver age classific ation ac cur ac y
Fold number
Author details
1 Department of Automation, Kaunas University of Technology, 51367 Kaunas, Lithuania. 2 Department of Applied
Informatics, Kaunas University of Technology, 51368 Kaunas, Lithuania. 3 Department of Mathematical Modelling, Kaunas
University of Technology, 51368 Kaunas, Lithuania.
Received: 21 August 2019 Accepted: 30 November 2019
References
1. InkWood Research: Global in Vitro Fertilization Market Forecast 2018–2026. (2018). https ://www.inkwo odres earch .com/repor ts/in‑vitro ‑ferti lizat ion‑marke t. Accessed 01 Mar 2019.
2. Mordor Intelligence: Global in‑vitro fertilization market‑segmented by instruments, technology, end users, and geography—growth, trends, and forecast 2019–2024. 2019. https ://www.mordo rinte llige nce.com/indus try‑repor ts/ invit ro‑ferti lizat ion‑marke t. Accessed 22 Mar 2019.
3. FertilityIQ: IVF ‑ In Vitro Fertilization. The most successful, invasive, and expensive fertility treatment. 2019. https :// www.ferti lityi q.com/ivf‑in‑vitro ‑ferti lizat ion/. Accessed 04 Jan 2019.
4. Abuzeid MI, et al. Cumulative live birth rate and assisted reproduction: impact of female age and transfer day. Facts Views Vis Obgyn. 2014;6(3):145–9.
5. Paulson RJ. Time‑lapse imaging. Fertil Steril. 2018;109(4):583. https ://doi.org/10.1016/J.FERTN STERT .2018.02.013. 6. Wang S‑S, Sun H‑X. Blastocyst transfer ameliorates live birth rate compared with cleavage‑stage embryos transfer
in fresh in vitro fertilization or intracytoplasmic sperm injection cycles: reviews and meta‑analysis. Yonsei Med J. 2014;55(3):815–25. https ://doi.org/10.3349/ymj.2014.55.3.815.
7. Wong CC, Loewke KE, Bossert NL, Behr B, De Jonge CJ, Baer TM, Pera RAR. Non‑invasive imaging of human embryos before embryonic genome activation predicts development to the blastocyst stage. Nat Biotechnol. 2010;28:1115– 21. https ://doi.org/10.1038/nbt.1686.
8. Lyssek‑Boroń A, Wylęgała A, Polanowska K, Krysik K, Dobrowolski D. Longitudinal changes in retinal nerve fiber layer thickness evaluated using Avanti Rtvue‑XR optical coherence tomography after 23G vitrectomy for epiretinal membrane in patients with open‑angle glaucoma. J Healthcare Eng. 2017;. https ://doi.org/10.1167/iovs.12‑9782. 9. Gao X, Boccalini S, Kitslaar PH, Budde RPJ, Tu S, Lelieveldt BPF, Dijkstra J, Reiber JHC. A novel software tool for semi‑
automatic quantification of thoracic aorta dilatation on baseline and follow‑up computed tomography angiogra‑ phy. Int J Cardiovasc Imaging. 2019;35(4):711–23. https ://doi.org/10.1007/s1055 4‑018‑1488‑9.
10. Goceri, E., Goceri, N.: Deep learning in medical image analysis: Recent advances and future trends. In: 11th Int. l conf. on computer graphics, visualization, computer vision and image processing (CGVCVIP 2017), 2017; p. 305–10 11. Lundervold AS, Lundervold A. An overview of deep learning in medical imaging focusing on mri. Zeitschrift für
Medizinische Physik. 2019;29(2):102–27. https ://doi.org/10.1016/j.zemed i.2018.11.002. Special Issue: Deep learning in medical physics.
12. Khosravi P, Kazemi E, Zhan Q, Malmsten JE, Toschi M, Zisimopoulos P, Sigaras A, Lavery S, Cooper LAD, Hickman C, Meseguer M, Rosenwaks Z, Elemento O, Zaninovic N, Hajirasouliha I. Deep learning enables robust assessment and selection of human blastocysts after in vitro fertilization. Dig Med. 2019;2(1):21 10.1038/s41746‑019‑0096‑y. 13. Iwata K, Sato M, Matsumoto I, Shimura T, Yumoto K, Negami A, Mio Y. Deep learning based on images of human
embryos obtained from high‑resolusion time‑lapse cinematography for predicting good‑quality embryos. Fertil Steril. 2018;110(4):213. https ://doi.org/10.1016/j.fertn stert .2018.07.615.
14. Jeanray N, Marée R, Pruvot B, Stern O, Geurts P, Wehenkel L, Muller M. Phenotype classification of zebrafish embryos by supervised learning. PLOS ONE. 2015;10(1):1–20. https ://doi.org/10.1371/journ al.pone.01169 89.
15. Rocha JC, Passalia FJ, Matos FD, Takahashi MB, Ciniciato DdS, Maserati MP, Alves MF, de Almeida TG, Cardoso BL, Basso AC, Nogueira MFG. A method based on artificial intelligence to fully automatize the evaluation of bovine blastocyst images. Sci Rep. 2017;. https ://doi.org/10.1038/s4159 8‑017‑08104 ‑9.
16. Viswanath PS, Weiser T, Chintala P, Mandal S, Dutta R Grading of mammalian cumulus oocyte complexes using machine learning for in vitro embryo culture. In: 2016 IEEE‑EMBS international conference on biomedical and health informatics (BHI), 2016; p. 172–5. https ://doi.org/10.1109/BHI.2016.74558 62.
17. Filho ES, Noble JA, Poli M, Griffiths T, Emerson G, Wells D. A method for semi‑automatic grading of human blastocyst microscope images. Hum Reprod. 2012;27(9):2641–8.
18. Malmsten J, Zaninovic N, Zhan Q, Toschi M, Rosenwaks Z, Shan J. Automatic prediction of embryo cell stages using artificial intelligence convolutional neural network. Fertil Steril. 2018;110(4):360. https ://doi.org/10.1016/j.fertn stert .2018.07.1005.
19. Wang Y, Moussavi F, Lorenzen P. Automated embryo stage classification in time‑lapse microscopy video of early human embryo development. In: Medical image computing and computer‑assisted intervention—MICCAI 2013, p. 460–7. Springer, Berlin, Heidelberg 2013. https ://doi.org/10.1007/978‑3‑642‑40763 ‑5‑57.
20. Döring M. Performance Measures for Multi‑Class Problems. 2018. https ://www.datas cienc eblog .net/post/machi ne‑learn ing/perfo rmanc e‑measu res‑multi ‑class ‑probl ems. Accessed 05 Apr 2019.
21. Sokolova M, Lapalme G. A systematic analysis of performance measures for classification tasks. Inf Process Manag. 2009;45(4):427–37. https ://doi.org/10.1016/j.ipm.2009.03.002.
22. Montag M. How a Decision Support Tool Based on Known Implantation Data Can Enhance Embryo Selection. 2015. https ://blog.vitro life.com/toget heral lthew ay/how‑a‑decis ion‑suppo rt‑tool‑based ‑on‑known ‑impla ntati on‑data‑ can‑enhan ce‑embry o‑selec tion. Accessed 06 Sept 2019.
• fast, convenient online submission •
thorough peer review by experienced researchers in your field • rapid publication on acceptance
• support for research data, including large and complex data types •
gold Open Access which fosters wider collaboration and increased citations maximum visibility for your research: over 100M website views per year •
At BMC, research is always in progress.
Learn more biomedcentral.com/submissions
Ready to submit your research? Choose BMC and benefit from:
24. Shao RY, Wang. Bubgan: bubble generative adversarial networks for synthesizing realistic bubbly flow images. Chem Eng Sci. 2019;204:35–47.
25. Rubin M, Stein O, Turko NA, Nygate Y, Roitshtain D, Karako L, Barnea I, Giryes R, Shaked NT. Top‑gan label‑free cancer cell classification using deep learning with a small training set. Med Image Anal. 2019;57:176–85. https ://doi. org/10.3390/s1916 3578.
26. Lienhart R, Maydt J. An extended set of haar‑like features for rapid object detection. Proc Int Conf Image Process. 2002;1:900–3. https ://doi.org/10.1109/ICIP.2002.10381 71.
27. Viola P, Jones M. Rapid object detection using a boosted cascade of simple features. In: Proceedings of the 2001 IEEE computer society conference on computer vision and pattern recognition. CVPR 2001, 2001;1: p. 511–8. https ://doi. org/10.1109/CVPR.2001.99051 7.
28. OpenCV: Cascade Classification. Haar Feature‑based Cascade Classifier for Object Detection. 2019. https ://docs. openc v.org/2.4/modul es/objde tect/doc/casca de_class ifica tion.html. Accessed 25 Feb 2019.
29. Gupta S, Mazumda SG. Sobel edge detection algorithm. Int J Comput Sci Manag Res. 2013;2(2):1578–83.
30. Flanagan C. Bresenham Line‑Drawing Algorithm. (1996). https ://www.cs.helsi nki.fi/group /goa/malli nnus/lines /brese nh.html. Accessed 20 Feb 2019.
31. Goceri E. Diagnosis of Alzheimer’s disease with sobolev gradient based optimization and 3D convolutional neural network. Int J Numer Methods Biomed Eng. 2019;35:3225. https ://doi.org/10.1002/cnm.3225.
32. Goceri E. Full‑automated liver segmentation using sobolev gradient based level set evolution. Int J Numer Methods Biomed Eng. 2016;. https ://doi.org/10.1002/cnm.2765.
33. Goceri E, Martínez ED. A level set method with sobolev gradient and haralick edge detection. Glob J Technol. 2014;131–40 34. Goceri E. Fully automated and adaptive intensity normalization using statistical features for brain MR images. Celal
Bayar Üniversitesi Fen Bilimleri Dergisi, 2018; p. 125–34 https ://doi.org/10.18466 /cbaya rfbe.38472 9.
35. Goceri E. Intensity normalization in brain mr images using spatially varying distribution matching. In: 11th Int. Conf. on computer graphics, visualization, computer vision and image processing (CGVCVIP 2017), 2017. p. 300–4. 36. Khmag A, Ramli AR, Al‑haddad SAR, Kamarudin N. Natural image noise level estimation based on local statistics for
blind noise reduction. Vis Comput. 2018;34(4):575–87. https ://doi.org/10.1007/s0037 1‑017‑1362‑0.
37. Goceri E, Goksel B, Elder JB, Puduvalli V, Otero J, Gurcan MN. Quantitative validation of anti‑ptbp1 antibody for diagnostic neuropathology use: image analysis approach. Int J Numer Methods Biomed Eng. 2016;. https ://doi. org/10.1002/cnm.2862.
38. Alhindi TJ, Kalra S, Ng KH, Afrin A, Tizhoosh HR Comparing lbp, hog and deep features for classification of histopa‑ thology images. 2018 international joint conference on neural networks (IJCNN), 2018. p. 1–7.
39. Chen J, Zheng H, He N, Luo Z, Zhu R. Object detection by learning oriented gradients. In: Zhao Y, Kong X, Taubman D, editors. Image Graph. Cham: Springer; 2017. p. 86–96.
40. Ozturk S, Akdemir B. Comparison of hog, mser, sift, fast, lbp and canny features for cell detection in histopathologi‑ cal images. HELIX 8, 2018; 3321–5 https ://doi.org/10.29042 /2018‑3321‑3325.
41. Huang d, Shan C, Ardabilian M, Chen L. Local binary patterns and its application to facial image analysis: a survey. IEEE Trans Syst Man Cybern Part C. 2011;41:765–81. https ://doi.org/10.1109/TSMCC .2011.21187 50.
42. Rawat W, Wang Z. Deep convolutional neural networks for image classification: a comprehensive review. Neural Comput. 2017;29(9):2352–449. https ://doi.org/10.1162/NECO_a_00990 .
43. Sladojevic S, Arsenovic M, Anderla A, Culibrk D, Stefanovic D. Deep neural networks based recognition of plant diseases by leaf image classification. Comput Intell Neurosci. 2016;2016:1–11. https ://doi.org/10.1155/2016/32898 01. 44. Krizhevsky A, Sutskever I, Hinton EG. Imagenet classification with deep convolutional neural networks. Adv Neural
Inf Process Syst. 2012;1:1097–105. https ://doi.org/10.1061/(ASCE)GT.1943‑5606.00012 84.
45. Simonyan K, Zisserman A (2015) Very deep convolutional networks for large‑scale image recognition. In: The 3rd International Conference on Learning Representations (ICLR2015), pp. 1–14. arxiv :1409.1556
46. Bianco S, Cadene R, Celona L, Napoletano P. Benchmark analysis of representative deep neural network architec‑ tures. IEEE Access. 2018;4:64270–7. https ://doi.org/10.1109/ACCES S.2018.28778 90.
47. Vedaldi A, Lenc K. Matconvnet: Convolutional neural networks for matlab. In: Proceedings of the 23rd ACM Inter‑ national Conference on Multimedia. MM ’15, pp. 689–92. ACM, New York, USA 2015. https ://doi.org/10.1145/27333 73.28074 12
Publisher’s Note